Statistics > SOPHIA PATHWAY > Sophia_Statistics_Unit_4_Milestone 2020 - Metropolitan Community College | Sophia_Statistics_Unit_4_ (All)
Sophia_Statistics_Unit_4_Milestone 2020 - Metropolitan Community College | Sophia_Statistics_Unit_4_Milestone 2020 - (ANSWERS AND RATIONALE)
Document Content and Description Below
Sophia_Statistics_Unit_4_Milestone 2020 - Metropolitan Community College | Sophia_Statistics_Unit_4_Milestone 2020 - (ANSWERS AND RATIONALE) UNIT 4 — MILESTONE 4 Score 15/18 You passed this Miles... tone 15 questions were answered correctly. 3 questions were answered incorrectly. 1 The table below shows the grade and reading level for 5 students. Grade Reading Level Student 1 2 6 Student 2 6 14 Student 3 5 12 Student 4 4 10 Student 5 1 4 For grade, the mean is 3.6 and the standard deviation is 2.1. For reading level, the mean is 9.2 and the standard deviation is 4.1. Using the formula below or Excel, find the correlation coefficient, r, for this set of students. Answer choices are rounded to the nearest hundredth. 1.00 0.85 0.710.92 RATIONALE In order to get the correlation, we can use the formula: Correlation can be quickly calculated by using Excel. Enter the values and use the function "=CORREL(". CONCEPT Correlation I need help with this question 2 This scatterplot shows the maintenance expense for a truck based on its years of service.The equation for least regression line to this data set is ŷ = 76.82x + 88.56. What is the predicted value (in dollars) for maintenance expenses when a truck is 7 years old? $549 $473 $626 $703 RATIONALE In order to get the predicted maintenance expense when the age of the truck is 7 years, we simply substitute the value 7 in our equation for x. So we can note that: CONCEPT Predictions from Best-Fit Lines I need help with this question 3 Raoul lives in Minneapolis and he is planning his spring break trip. He creates the scatterplot below to assess how much his trip will cost.Which answer choice correctly indicates the explanatory and response variables for the scatterplot? Explanatory variable: Distance Response variable: Cost Explanatory variable: Minneapolis Response variable: Miles flown Explanatory variable: Miles flown Response variable: Minneapolis Explanatory variable: Cost Response variable: Distance RATIONALE The explanatory variable is what is along the horizontal axis, which is distance. The response variable is along the vertical axis, which is cost. CONCEPT Explanatory and Response Variables I need help with this question 4 Which of the following scatterplots shows a correlation affected by an influential point?RATIONALE An influential point will influence correlation that doesn't lie in the range of the other data. This graphs shows an outlier that is above the other data and lower in the x-direction. CONCEPT Cautions about Correlation I need help with this question 5 Peter analyzed a set of data with explanatory and response variables x and y. He concluded the mean and standard deviation for x as 7.8 and 3.70, respectively. He also concluded the mean and standard deviation for y as 12.2 and 4.15, respectively. The correlation was found to be 0.964. Select the correct slope and y-intercept for the least-squares line. Answer choices are rounded to the hundredths place. Slope = -1.08 y-intercept = 3.78 Slope = 1.08 y-intercept = -3.78 Slope = 1.08 y-intercept = 3.78Slope = -1.08 y-intercept = -3.78 RATIONALE We first want to get the slope. We can use the formula: To then get the intercept, we can solve for the y-intercept by using the following formula: y with hat on top equals b subscript 0 plus b subscript 1 x We know the slope, b subscript 1, and we can use the mean of x and the mean of y for the variables x and y with hat on top to solve for the y-intercept, b subscript 0. CONCEPT Finding the Least-Squares Line I need help with this question 6 In a study of 30 high school students, researchers found a high correlation, 0.93, between amount of exercise and weight lost. Which of the following statements is TRUE? There is a strong positive linear association between weight loss and exercise, but the researchers have not proven causation. The researchers proved that exercise causes weight loss, but only for high school students. The researchers proved that exercise causes weight loss. 93% of the high school students studied lost weight. RATIONALERecall that correlation measures the strength and direction of linear association. So r= 0.93 indicates a strong positive linear association. Recall also, that correlation doesn't imply causation. Causation is a direct change in one variable causing a change in some outcome. CONCEPT Correlation and Causation I need help with this question 7 For the data plotted in the scatterplot, the r2 value was calculated to be 0.9846. Which of the following sets of statements is true? 98.5% of the variation in age is explained by a linear relationship with yearly income. The correlation coefficient, r, is 0.969. 98.5% of the variation in yearly income is explained by a nonlinear relationship with age. The correlation coefficient, r, is 0.992. 98.5% of the variation in yearly income is explained by a linear relationship with age.The correlation coefficient, r, is 0.992 98.5% of the variation in age is explained by a nonlinear relationship with yearly income. The correlation coefficient, r, is 0.969. RATIONALE The coefficient of determination measures the percent of variation in the outcome, y, explained by the regression. So a value of 0.9846 tells us the regression with age, x, can explain about 98.5% of the variation in income, y. We can also note that r = . CONCEPT Coefficient of Determination/r^2 I need help with this question 8 A correlation coefficient between average temperature and coat sales is most likely to be __________. between 1 and 2 between 0 and 1 between 0 and -1 between -1 and -2 RATIONALE If we note that as temp goes up, we would expect coats to be less necessary, so coat sales would go down. So correlation should be negative and this would be between 0 and -1. CONCEPT Positive and Negative Correlations I need help with this question 9 Thomas was interested in learning more about the salary of a teacher. He believed as a teacher increases in age, the annual earnings also increases. The age (in years) is plotted against the earnings (in dollars) as shown below.Using the best-fit line, approximately how much money would a 45-year-old teacher make? $50,000 $58,000 $48,000 $55,000 RATIONALE To get a rough estimate of the salary of a 45 year-old, we go to the value of 45 on the horizontal axis and then see where it falls on the best-fit line. This looks to be about $50,000. CONCEPT Best-Fit Line and Regression Line I need help with this question 10 Jesse takes two data points from the weight and feed cost data set to calculate a slope, or average rate of change. A hamster weighs half a pound and costs $2 per week to feed, while a Labrador Retriever weighs 62.5 pounds and costs $10 per week to feed.Using weight as the explanatory variable, what is the slope of a line between these two points? Answer choices are rounded to the nearest hundredth. $7.75 / lb. $4.00 / lb. $6.25 / lb. $0.13 / lb. RATIONALE In order to get slope, we can use the formula: s l o p e equals fraction numerator y 2 minus y 1 over denominator x 2 minus x 1 end fraction. Using the information provided, the two points are: (0.5 lb., $2) and (62.5 lb., $10). We can note that: CONCEPT Linear Equation Algebra Review I need help with this question 11 Brad reads a scatterplot that displays the relationship between the number of cars owned per household and the average number of citizens who have health insurance in neighborhoods across the country. The plot shows a strong positive correlation. Brad recalls that correlation does not imply causation. In this example, Brad sees that increasing the number of cars per household would not cause members of his community to purchase health insurance. Identify the lurking variable that is causing an increase in both the number of cars owned and the average number of citizens with health insurance. Average annual salary per household The number of different car brandsThe number of citizens in the United States who do not have health insurance Average health insurance costs in the United States RATIONALE Recall that a lurking variable is something that must be related to the outcome and explanatory variable that when considered can help explain a relationship between 2 variables. Since higher income is positively related to owning more cars and having health insurance, this variable would help explain why we see this association. CONCEPT Correlation and Causation I need help with this question 12 Shawna finds a study of American women that had an equation to predict weight (in pounds) from height (in inches): ŷ = -260 + 6.6x. Shawna’s height was 64 inches and her weight was 150 pounds. What is the value of the residual for Shawna's weight and height? -12.4 pounds 730 pounds 12.4 pounds 162.4 pounds RATIONALE Recall that to get the residual, we take the actual value - predicted value. So if the actual height of 64 inches and the resulting actual weight is 150 pounds, we simply need the predicted weight. Using the regression line, we can say: The predicted weight is 164.4 pounds. So the residual is: CONCEPTResiduals I need help with this question 13 Which of the following scatterplots shows an outlier in the y-direction?RATIONALE To have an outlier in the y-direction the outlier must be in the range of x data but outside the range of y-data. This outlier is outside of the data in the y direction, lying below all of the data. CONCEPT Outliers and Influential Points I need help with this question 14 Which of the following is a guideline for establishing causality? The experiment performed should be controlled and randomized. Do not consider other possible causes. Look for cases where correlation does not exist between the variables. Check if the effect is present or absent when the response variable is present or absent. RATIONALE Finding an association inside an experimental design controls for many other outside influences and helps to ensure that an explanatory variable always precedes the response. This helps to support, with strong confidence, that the association is causal. CONCEPT Establishing Causality I need help with this question 15This scatterplot shows the performance of a thermocouple using the variables temperature difference and voltage. Select the answer choice that accurately describes the data's form, direction, and strength in the scatterplot. Form: The data pattern is nonlinear. Direction: There is a positive association between temperature difference and voltage. Strength: The data pattern is weak. Form: The data pattern is linear. Direction: There is a negative association between temperature difference and voltage. Strength: The data pattern is strong. Form: The data pattern is nonlinear. Direction: There is a negative association between temperature difference and voltage. Strength: The data pattern is weak. Form: The data pattern is linear. Direction: There is a positive association between temperature difference and voltage. Strength: The data pattern is strong.RATIONALE If we look at the data, it looks as if a straight line captures the relationship, so the form is linear. The slope of the line is positive, so it is increasing. Finally, since the dots are closely huddled around each other in a linear fashion, it looks strong. CONCEPT Describing Scatterplots I need help with this question 16 Which statement about correlation is FALSE? Correlation is used to define the variables of only non-linearly related data sets. The correlation of a data set can be positive, negative, or 0. Correlation between the variables of the data set can be measured. Correlation is the degree to which the two variables of a data set resemble each other. RATIONALE Recall that correlation is used for linear association between 2 quantitative variables, NOT for non-linearly related variables. CONCEPT Correlation I need help with this question 17 A bank manager declares, with help of a scatterplot, that the number of health insurances sold may have some association with the number of inches it snows.How many policies were sold when it snowed 2 to 4 inches? 350 470 210 240 RATIONALE In order to find the total number of policies between 2 and 4 inches, we must add the three values of 10 in that interval. At 2 inches, there were 100 policies. At 3 inches, there were 110 policies. At 4 inches, there were 140 policies. So the total is 100 + 110 + 140 = 350 policies. CONCEPT Scatterplot I need help with this question 18 Data for price and thickness of soap is entered into a statistics software package and results in a regression equation of ŷ = 0.4 + 0.2x.What is the correct interpretation of the slope if the price is the response variable and the thickness is an explanatory variable? The price of the soap increases by $0.20, on average, when the thickness increases by 1 cm. The price of the soap decreases by $0.20, on average, when the thickness increases by 1 cm. The price of the soap decreases by $0.40, on average, when the thickness increases by 1 cm. The price of the soap increases by $0.40, on average, when the thickness increases by 1 cm. RATIONALE When interpreting the linear slope, we generally substitute in a value of 1. So we can note that, in general, as x increases by 1 unit the slope tells us how the outcome changes. So for this equation we can note as x (thickness) increases by 1 cm, the outcome (price) will increase by $0.20 on average. CONCEPT Interpreting Intercept and Slope I need help with this question © 2020 SOPHIA Learning, LLC. SOPHIA is a registered trademark of SOPHIA Learning, LLC. About Contact Us Privacy Policy Terms of Use [Show More]
Last updated: 1 year ago
Preview 1 out of 18 pages
Reviews( 0 )
Recommended For You
Statistics> SOPHIA PATHWAY > Sophia_Statistics_Final_Milestone 2020 - Metropolitan Community College | Sophia_Statistics_Final_Milestone 2020 (All)
Sophia_Statistics_Final_Milestone 2020 - Metropolitan Community College | Sophia_Statistics_Final_Milestone 2020
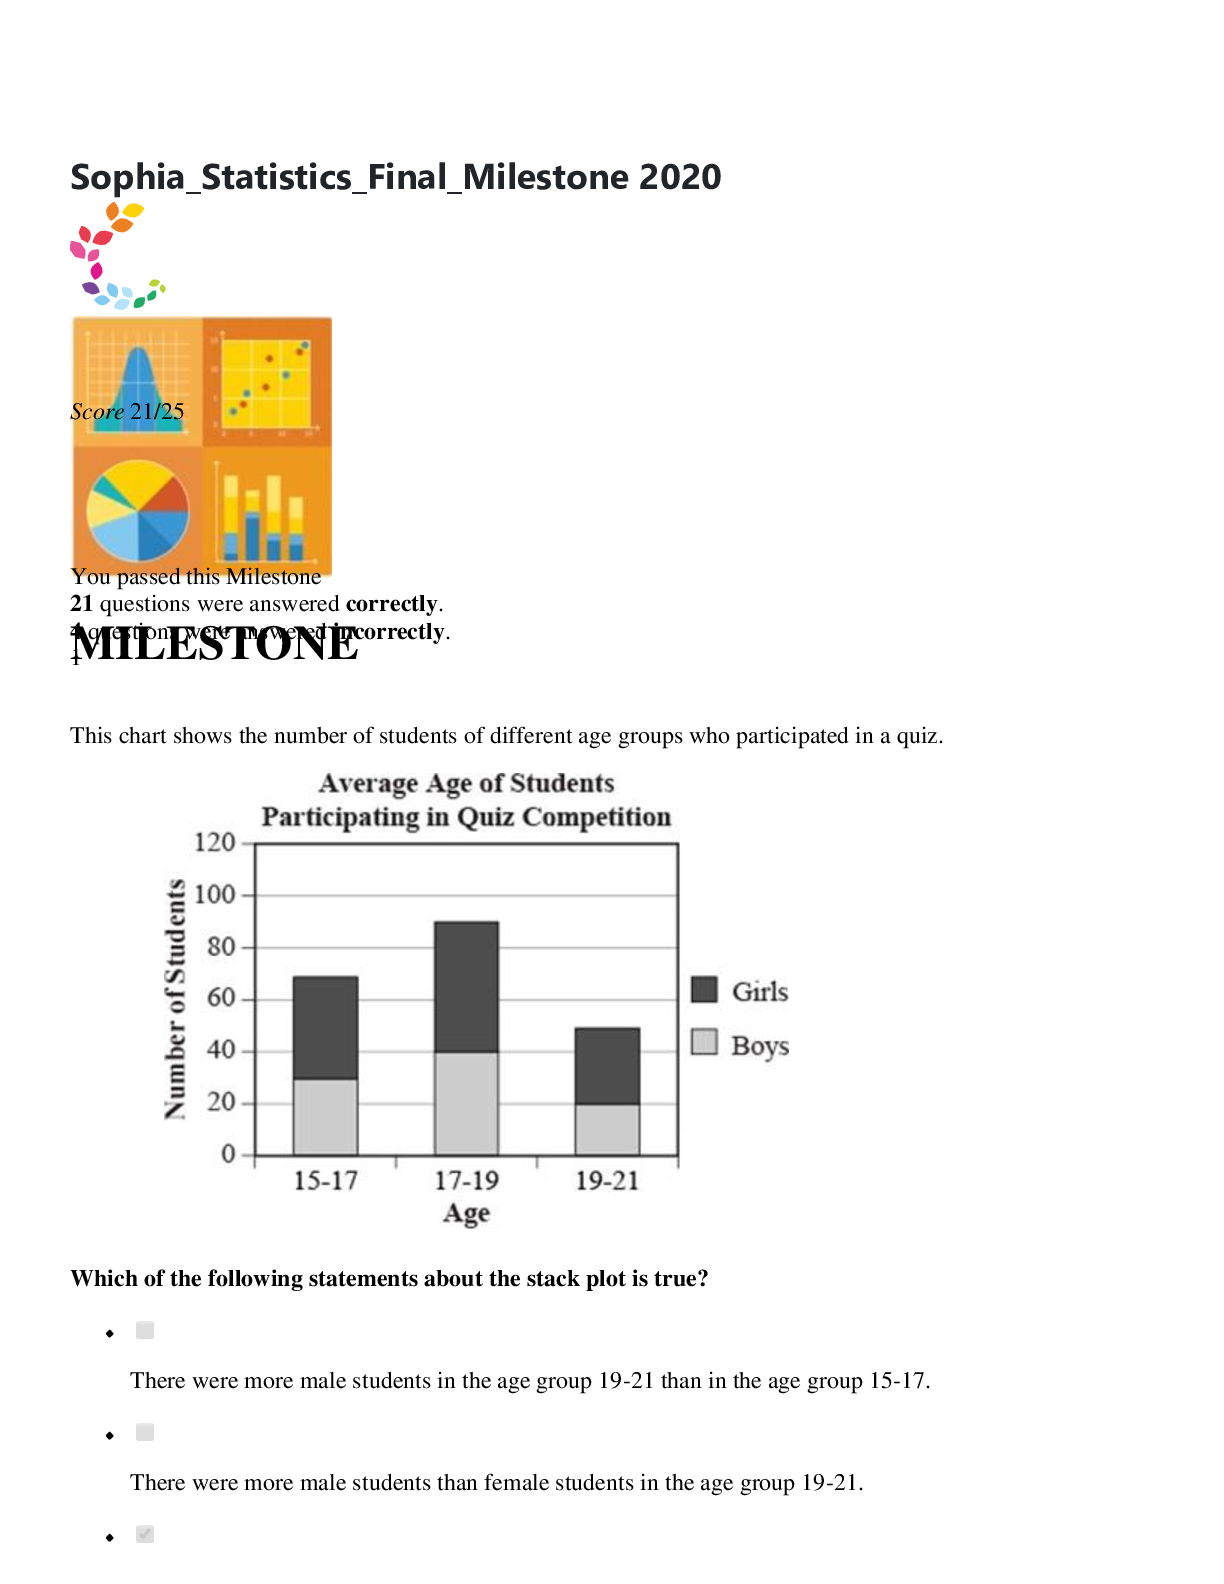
Which of the following statements about the stack plot is true? There were more male students in the age group 19-21 than in the age group 15-17. There were more male students than female st...
By PHISHER , Uploaded: Jul 09, 2021
$12.5
Statistics> SOPHIA PATHWAY > Sophia_Statistics_Unit_1_Milestone 2020 - Metropolitan Community College | Sophia_Statistics_Unit_1_Milestone 2020 (All)

Sophia_Statistics_Unit_1_Milestone 2020 - Metropolitan Community College | Sophia_Statistics_Unit_1_Milestone 2020
Sophia_Statistics_Unit_1_Milestone 2020 - Metropolitan Community College UNIT 1 — MILESTONE 1 Questions and Answers with Rationale Score 25/29 You passed this Milestone 25 questions were answered...
By Martin Freeman , Uploaded: Sep 11, 2020
$14
Statistics> SOPHIA PATHWAY > Sophia_Statistics_Unit_2_Milestone 2020 - Metropolitan Community College | Sophia_Statistics_Unit_2_Milestone 2020 - (ANSWERS AND RATIONALE) (All)
Sophia_Statistics_Unit_2_Milestone 2020 - Metropolitan Community College | Sophia_Statistics_Unit_2_Milestone 2020 - (ANSWERS AND RATIONALE)
Sophia_Statistics_Unit_2_Milestone 2020 - Metropolitan Community College | Sophia_Statistics_Unit_2_Milestone 2020 - (ANSWERS AND RATIONALE) UNIT 2 — MILESTONE 2 Score 22/26 You passed this Milesto...
By Martin Freeman , Uploaded: Sep 11, 2020
$14
Statistics> SOPHIA PATHWAY > Sophia_Statistics_Unit_5_Milestone 2020 - Metropolitan Community College | Sophia_Statistics_Unit_5_Milestone 2020 - (ANSWERS AND RATIONALE) (All)
Sophia_Statistics_Unit_5_Milestone 2020 - Metropolitan Community College | Sophia_Statistics_Unit_5_Milestone 2020 - (ANSWERS AND RATIONALE)
Sophia_Statistics_Unit_5_Milestone 2020 - Metropolitan Community College | Sophia_Statistics_Unit_5_Milestone 2020 - (ANSWERS AND RATIONALE) UNIT 5 — MILESTONE 5 Score 16/24 You passed this Milesto...
By Martin Freeman , Uploaded: Sep 11, 2020
$14.5
Biology> SOPHIA PATHWAY > Sophia_Human_Biology_Final_Milestone 2020 (A GRADE) - Metropolitan Community College | Sophia_Human_Biology_Final_Milestone 2020 (All)

Sophia_Human_Biology_Final_Milestone 2020 (A GRADE) - Metropolitan Community College | Sophia_Human_Biology_Final_Milestone 2020
Sophia_Human_Biology_Final_Milestone 2020 - Metropolitan Community College | Sophia_Human_Biology_Final_Milestone 2020 MILESTONE Score 24/25 You passed this Milestone 24 questions were answered co...
By Martin Freeman , Uploaded: Sep 10, 2020
$12.5
Environmental Science> SOPHIA PATHWAY > Sophia - Environmental Science - Unit 4 Milestone 4,100% CORRECT (All)
Sophia - Environmental Science - Unit 4 Milestone 4,100% CORRECT
Sophia - Environmental Science - Unit 4 Milestone 4
By securegrades , Uploaded: Jan 01, 2022
$14
Biology> SOPHIA PATHWAY > SOPHIA PATHWAY_Human Biology_Unit 5 Milestone 5. Concepts indicated and ALL CORRECT ANSWERS HIGHLIGHTED IN YELLOW. (All)
SOPHIA PATHWAY_Human Biology_Unit 5 Milestone 5. Concepts indicated and ALL CORRECT ANSWERS HIGHLIGHTED IN YELLOW.
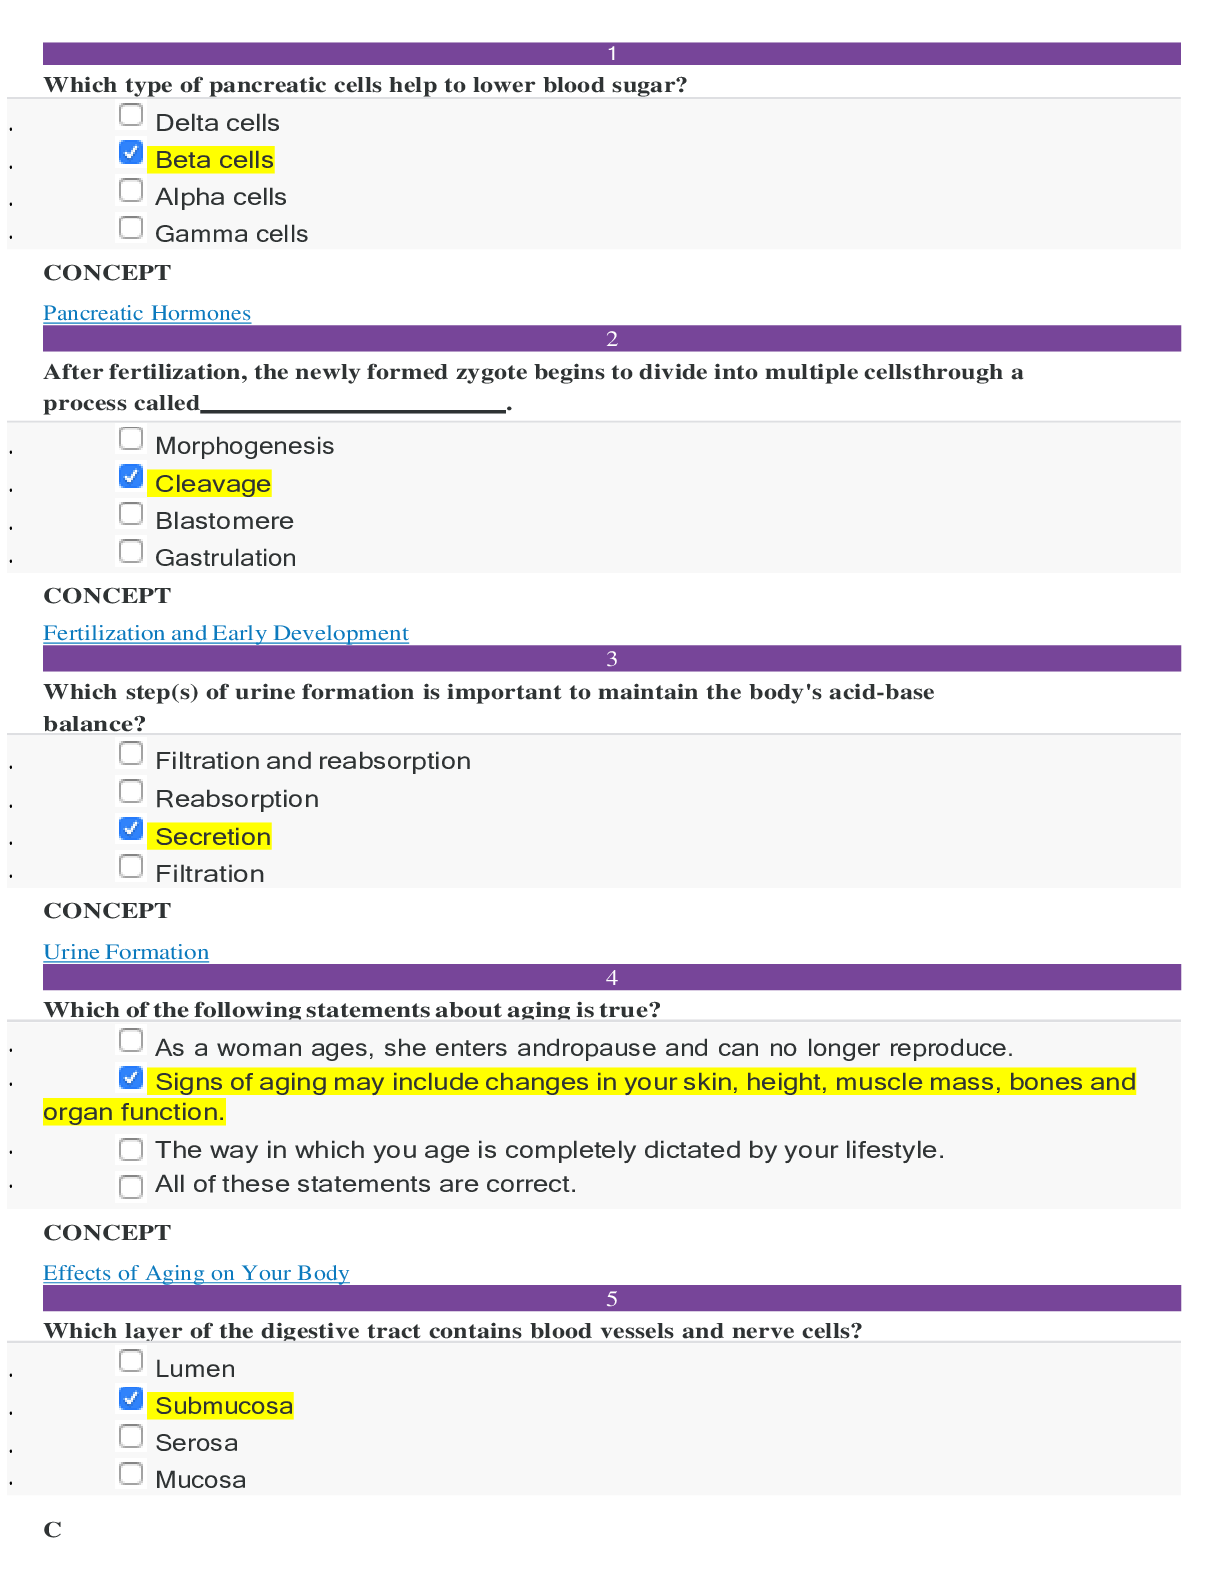
Sophia - Human Biology - Unit 5 Milestone 51 Correct Answers Highlighted in Yellow Which type of pancreatic cells help to lower blood sugar? • Delta cells • Beta cells • Alpha cells • Ga...
By QuizMaster , Uploaded: Oct 10, 2020
$8
*NURSING> SOPHIA PATHWAY > PALS - Team Response Final Scenario: Sophia Giamanti COMPLETE SOLUTION 2022 (All)
PALS - Team Response Final Scenario: Sophia Giamanti COMPLETE SOLUTION 2022
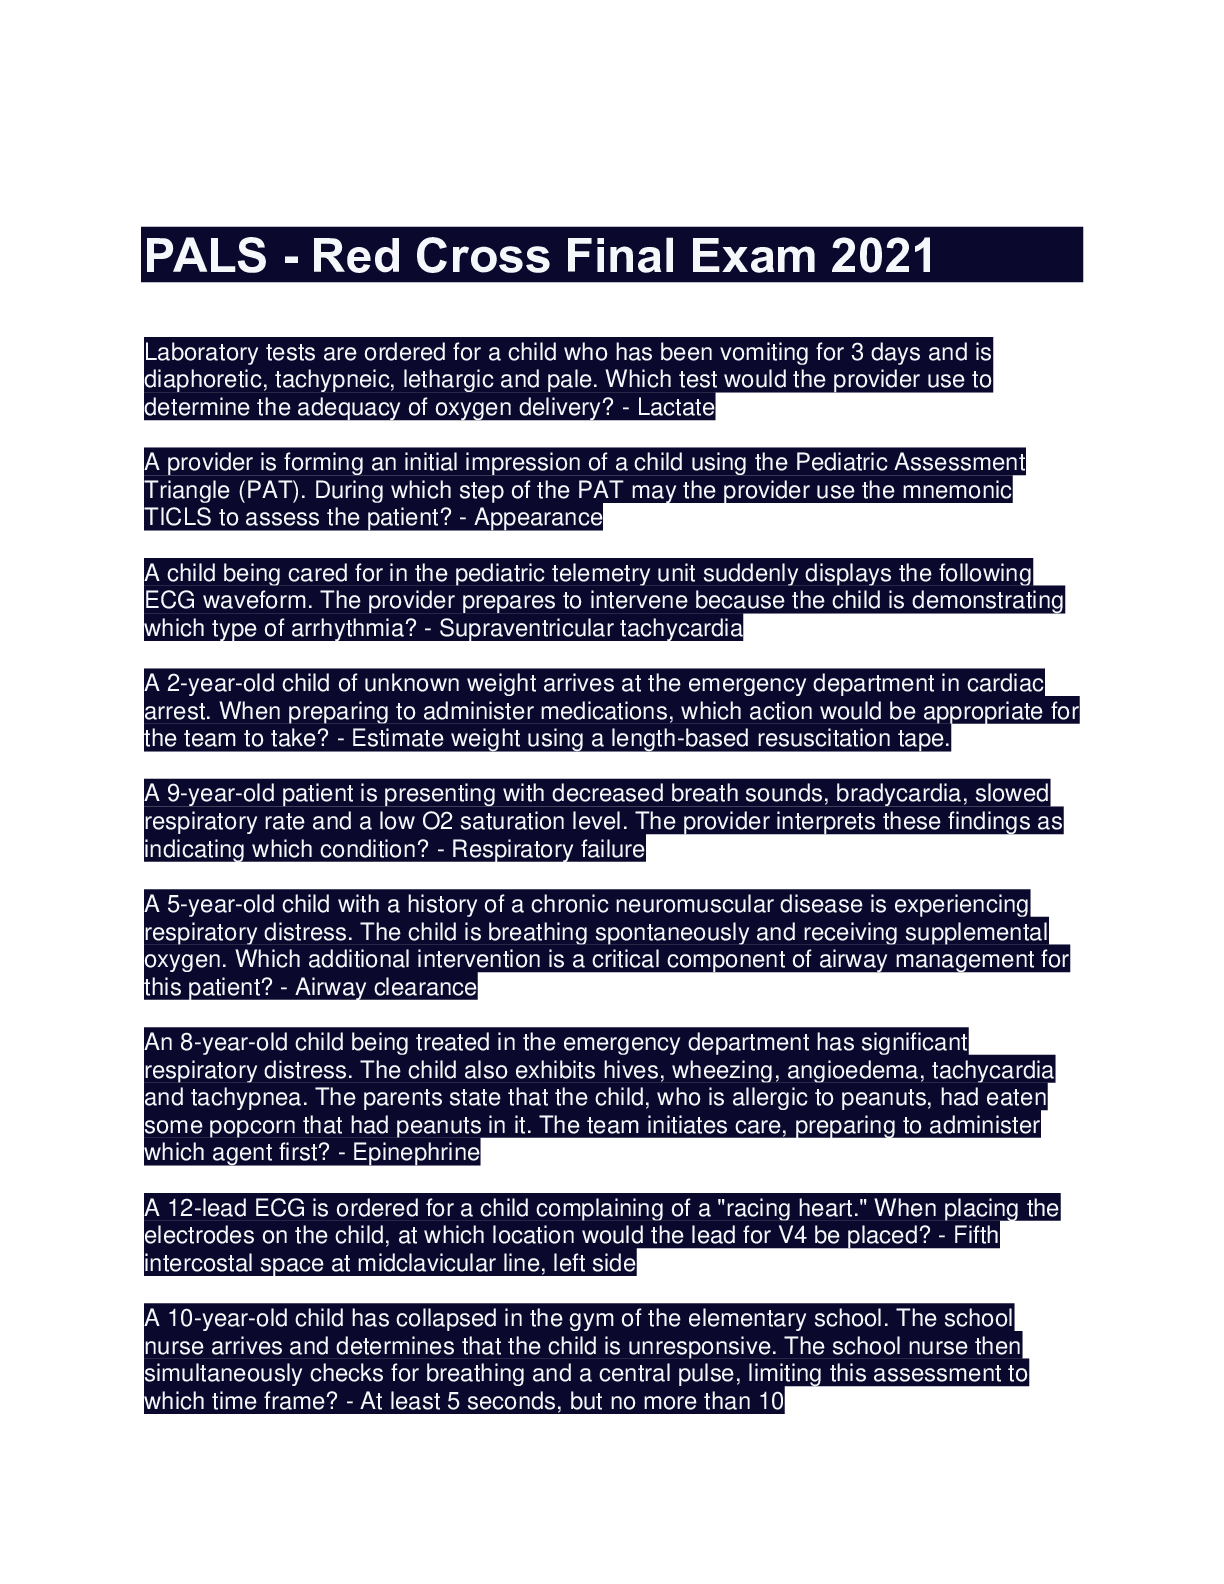
PALS - Team Response Final Scenario: Sophia Giamanti COMPLETE SOLUTION 2022 Which of the following should Jeremy do immediately after checking for responsiveness using the shouttap-shout sequence? -...
By Prof.Pierro , Uploaded: Jul 11, 2022
$6
Environmental Science> SOPHIA PATHWAY > Sophia - Environmental Science - Unit 3 Challenge 1 (All)
Sophia - Environmental Science - Unit 3 Challenge 1
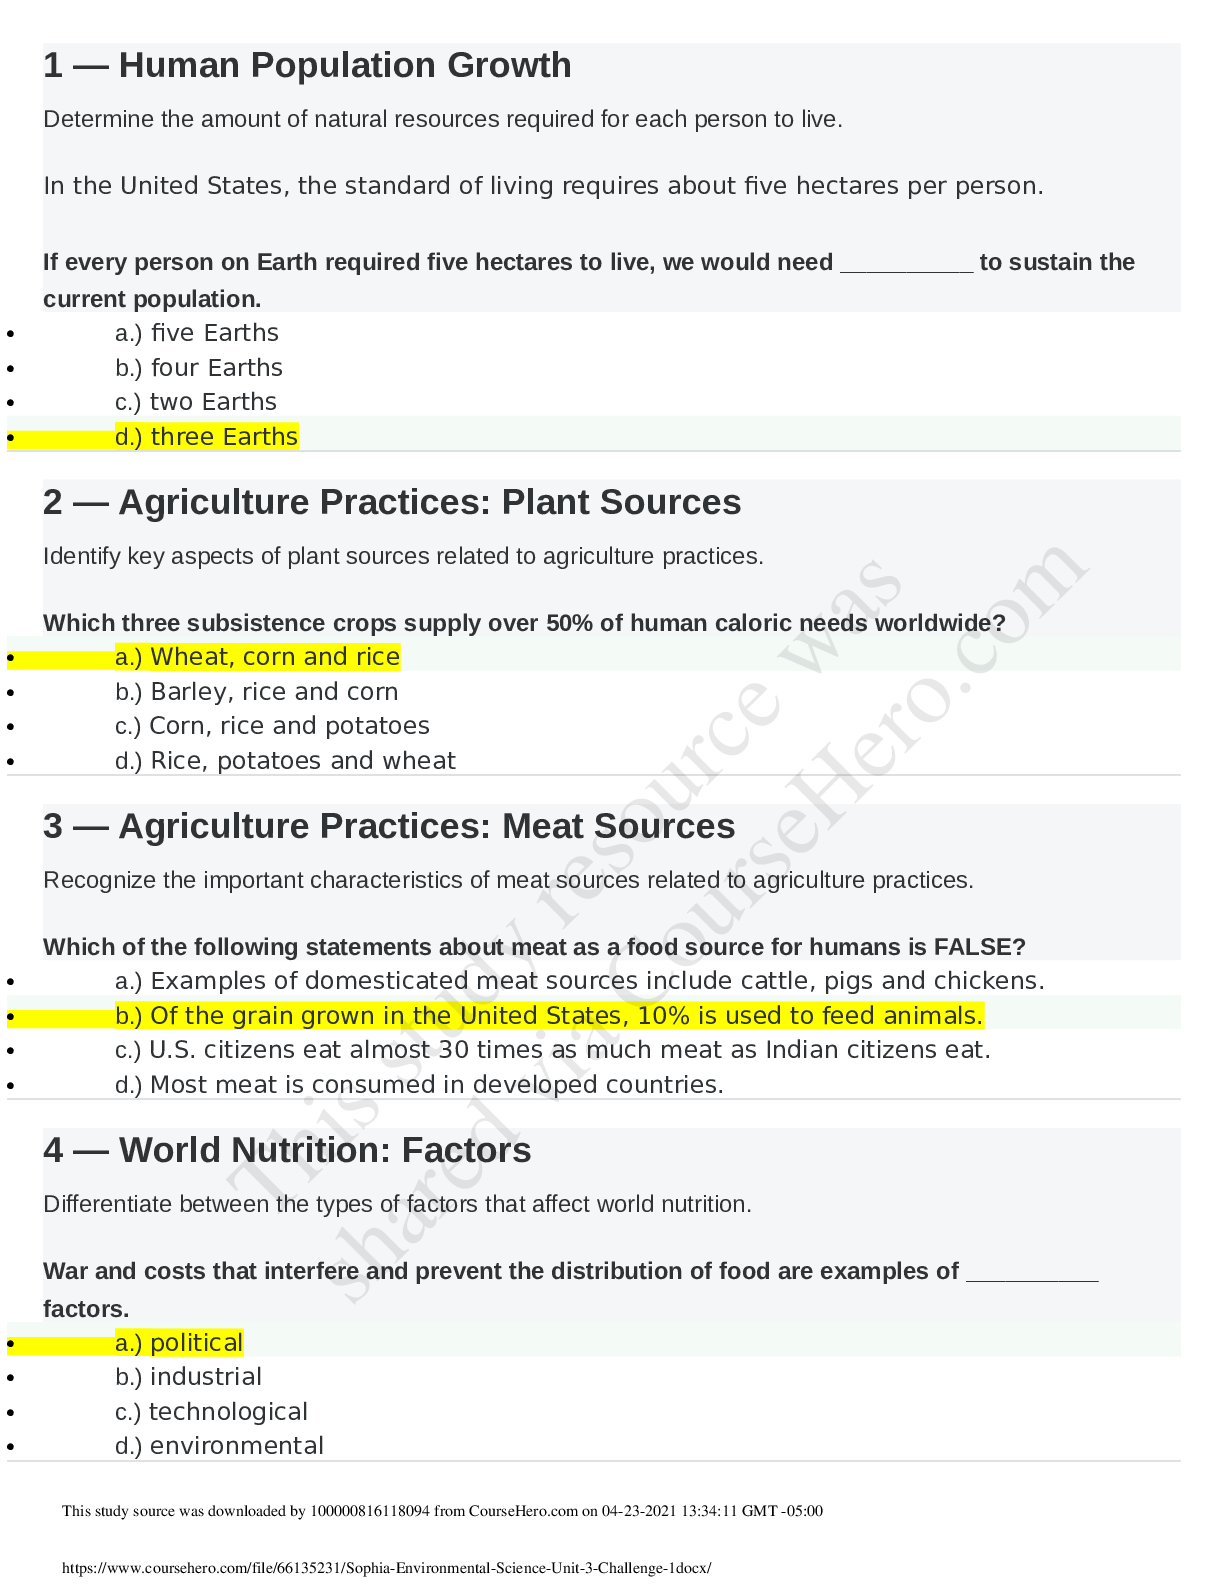
Sophia - Environmental Science - Unit 3 Challenge 1/Sophia - Environmental Science - Unit 3 Challenge 1/Sophia - Environmental Science - Unit 3 Challenge 1/Sophia - Environmental Science - Unit 3 Chal...
By PROF , Uploaded: Apr 23, 2021
$10
*NURSING> SOPHIA PATHWAY > Sophia - Environmental Science - Unit 3 Challenge 1 (All)
Sophia - Environmental Science - Unit 3 Challenge 1
Sophia - Environmental Science - Unit 3 Challenge 1
By PROF , Uploaded: Feb 08, 2021
$13.5
Document information
Connected school, study & course
About the document
Uploaded On
Sep 11, 2020
Number of pages
18
Written in

Additional information
This document has been written for:
Uploaded
Sep 11, 2020
Downloads
0
Views
224