Statistics > SOPHIA PATHWAY > MAT 300 Unit 2 Practice Milestone 2_2022/2023 | MAT300 Unit 2 Practice Milestone 2_Graded A+ (All)
MAT 300 Unit 2 Practice Milestone 2_2022/2023 | MAT300 Unit 2 Practice Milestone 2_Graded A+
Document Content and Description Below
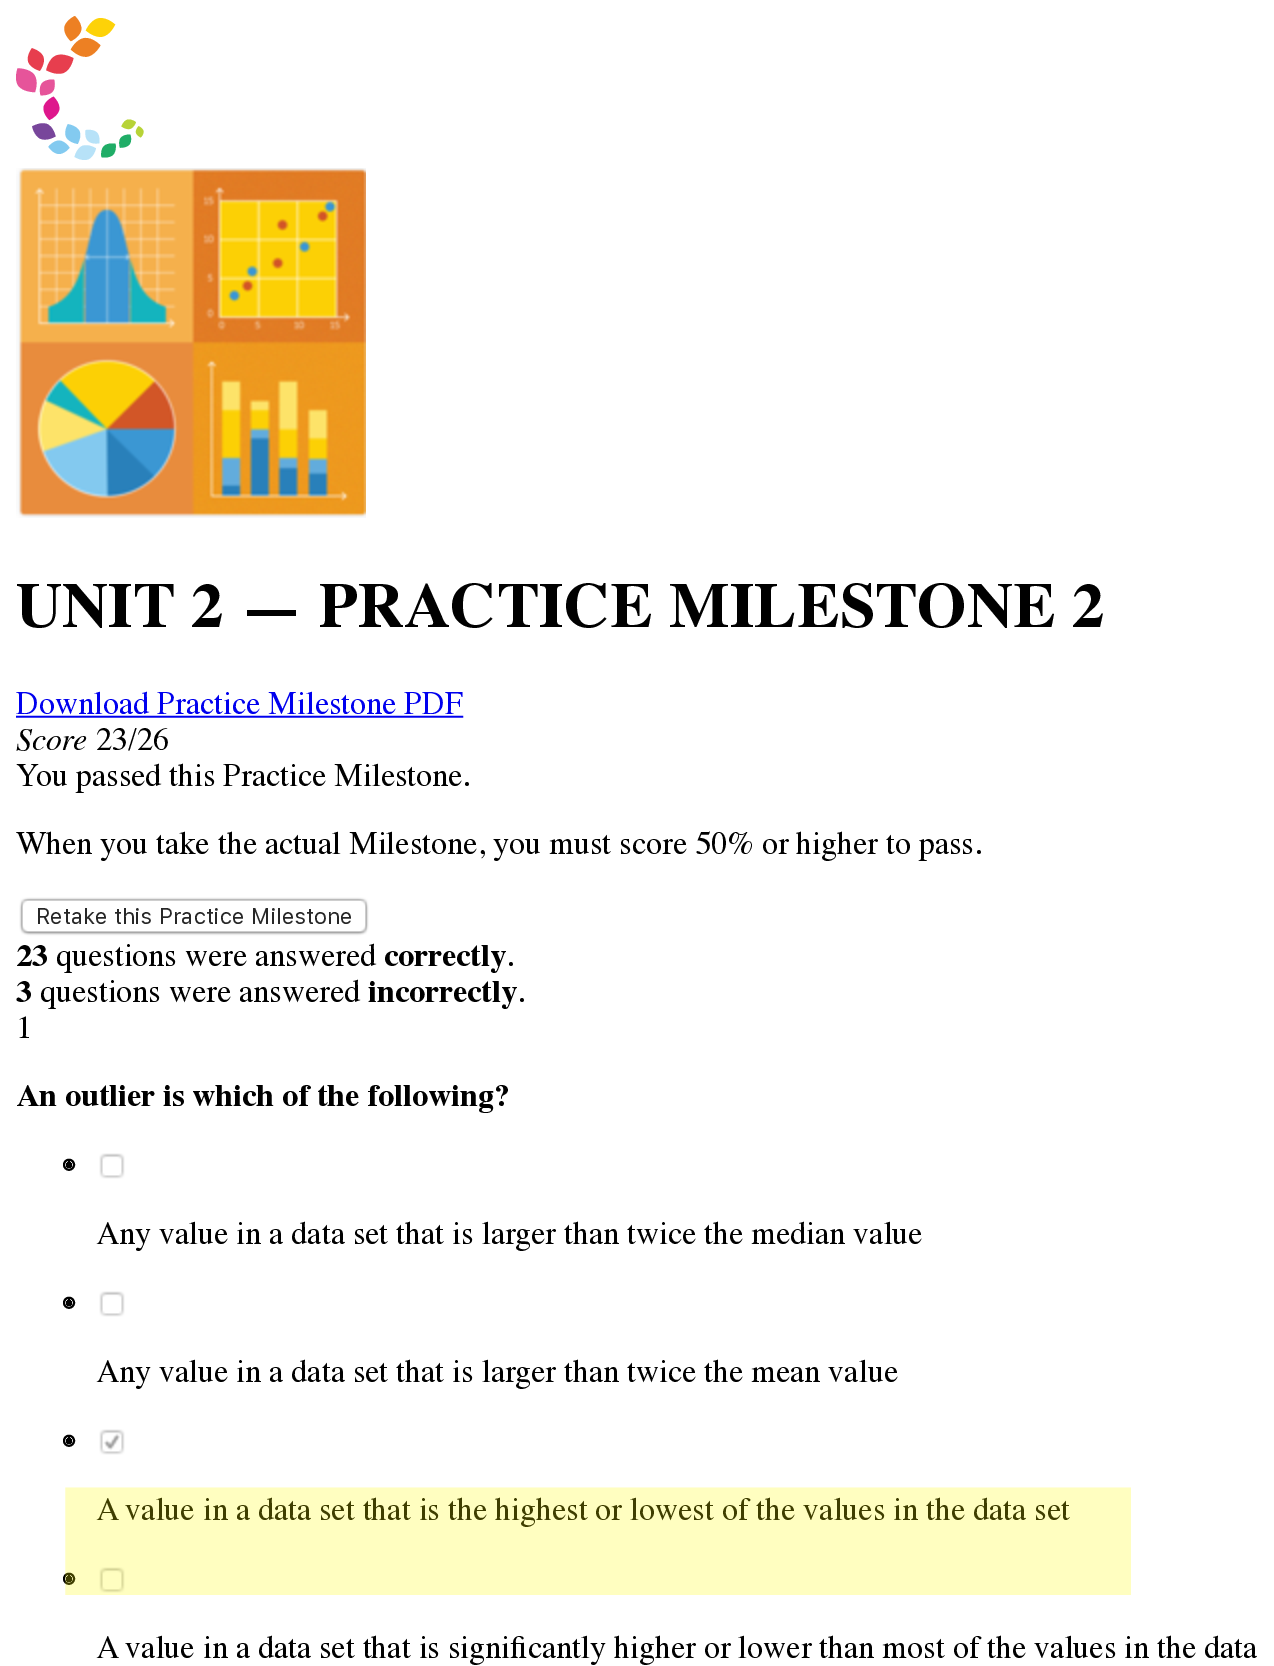
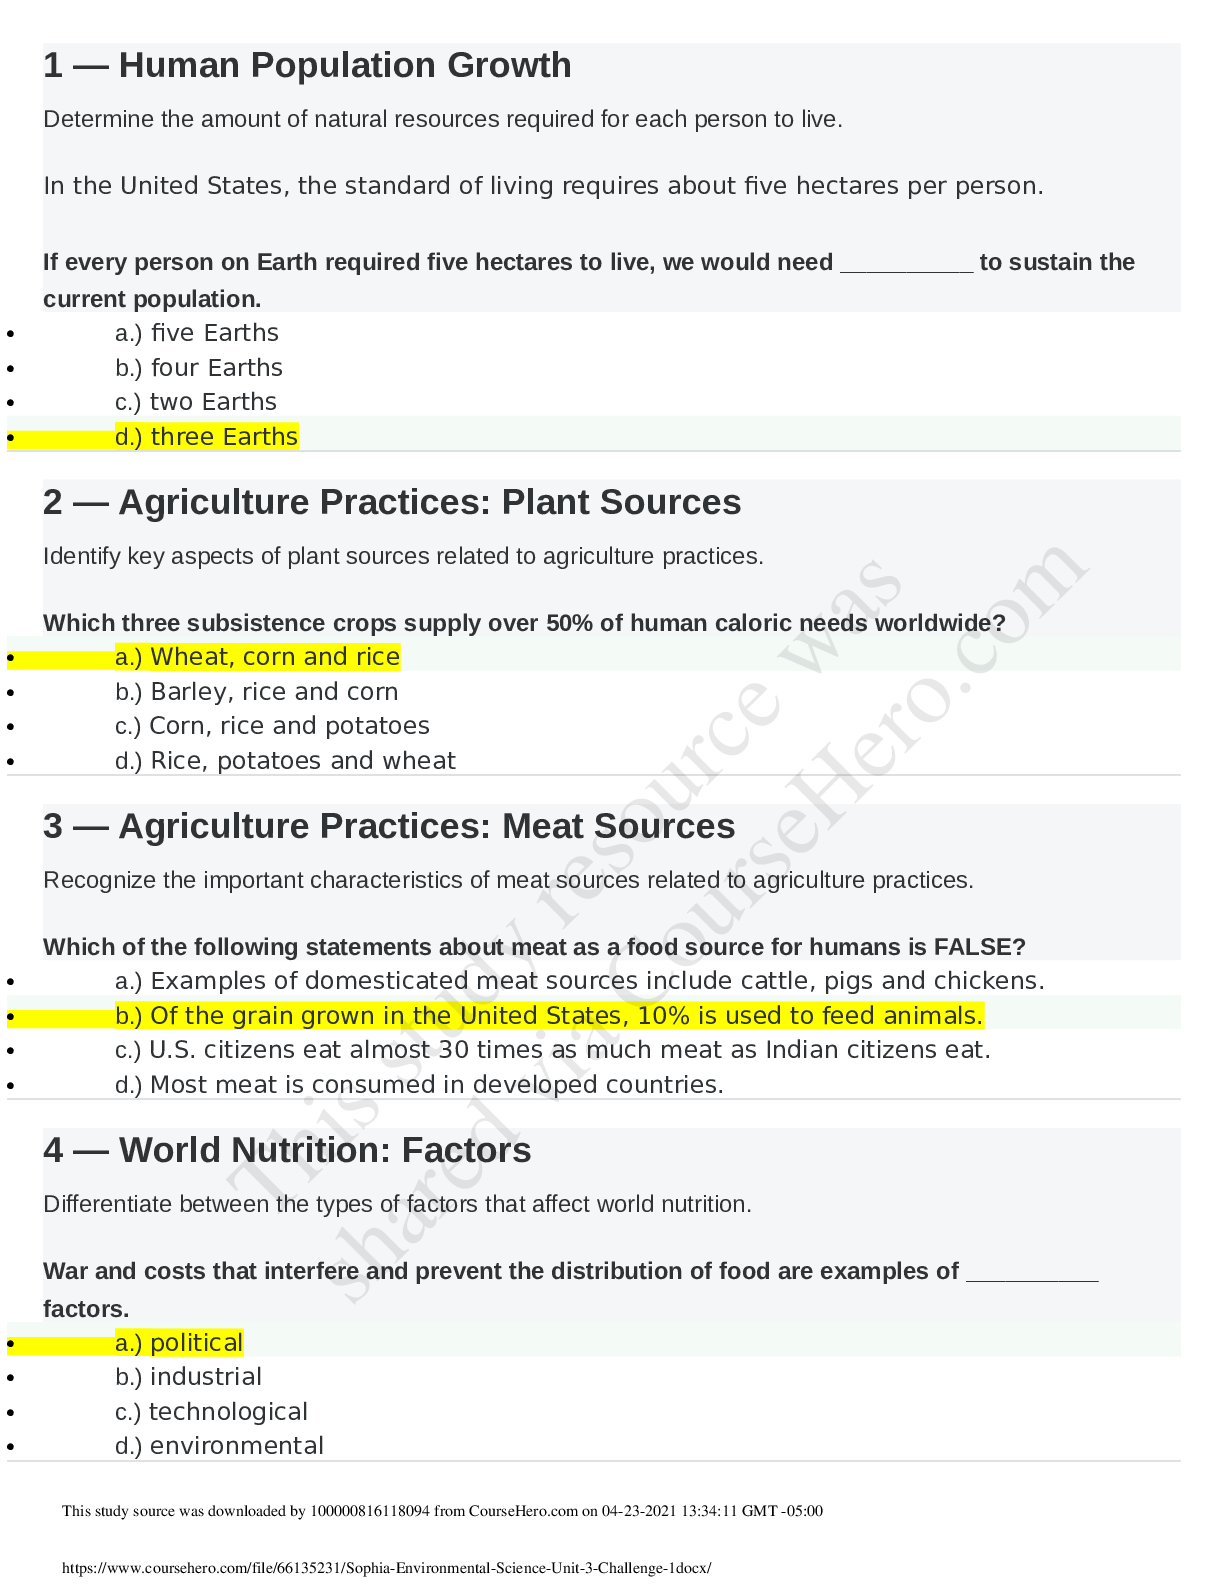
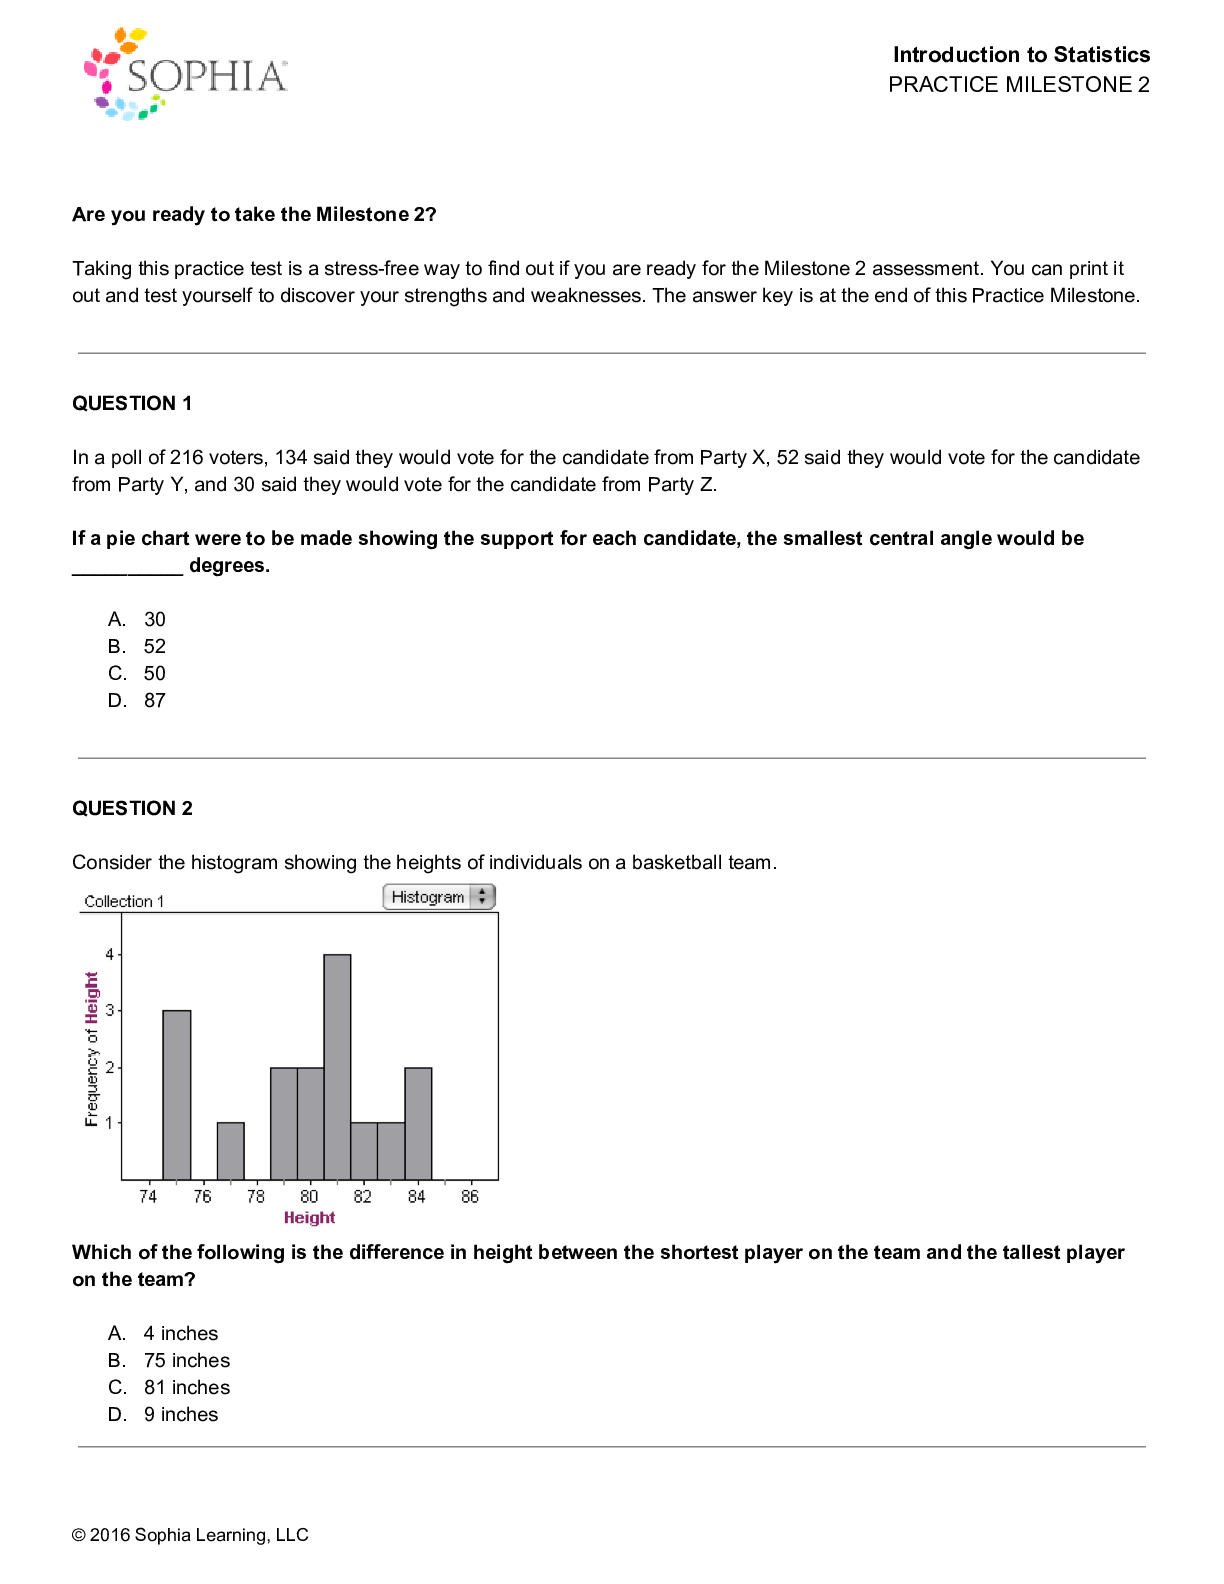
MAT 300 Unit_2_Practice_Milestone_2_(2022) - Sophia University MAT300 Unit_2_Practice_Milestone_2_(2022) UNIT 2 — PRACTICE MILESTONE 2 Download Practice Milestone PDF Score 23/26 You passed thi... s Practice Milestone. When you take the actual Milestone, you must score 50% or higher to pass. Retake this Practice Milestone 23 questions were answered correctly. 3 questions were answered incorrectly. 1 An outlier is which of the following? Any value in a data set that is larger than twice the median value Any value in a data set that is larger than twice the mean value A value in a data set that is the highest or lowest of the values in the data set A value in a data set that is significantly higher or lower than most of the values in the dataset A value in a data set that is only significantly lower than most of the values in the data set RATIONALE An outlier is data that doesn't fit with other data. It is either much larger or much smaller than the other data. CONCEPT Outliers and Modified Boxplots 2 The data below shows the number of text messages received by a group of students in a day. How many students received 10 to 13 messages? 4 5 69 RATIONALE The dot plot shows us how many values are at each point. To find the number of students who received 10 to 13 messages, count the number of x's in at each value: 1 student received 10 messages, 2 students received 11 messages, 2 students received 12 messages, and 4 students received 13 messages. If we count up the number of x's from 10 and 13 values, we see that there are 9 x's, or 9 students. CONCEPT Dot Plots 3 The formula for standard deviation of a sample is: Select the true statement for the following data set that has a mean of 5: 2, 4, 4, 4, 5, 5, 5, 7, 9 The variance is 2 and the standard deviation is 4. The variance is 8 and the standard deviation is 0. The variance is 4 and the standard deviation is 2. The variance is 3 and the standard deviation is 1.RATIONALE We can first calculate the variance of the data, , by using the part of the formula under the square root: Next, we can find the standard deviation, , by simply taking the square root of the variance: CONCEPT Standard Deviation 4 Using the box-and-whisker plot, match each description with the correct value. C First Quartile E Second Quartile A Third Quartile A. 52 B.70 C. 33 D. 29 E. 40 RATIONALE Recall the box shows us Q1, Q2, and Q3. The ends of the box are Q1 and Q3 with the lowest edge (33) being Q1 and the highest (52) being Q3. The line in the box is Q2 or the median, which is 40. CONCEPT Five Number Summary and Boxplots 5 Let x stand for the percentage of an individual student's math test score. 100 students were sampled at a time. The population mean is 75 percent and the population standard deviation is 12 percent. What are the mean and standard deviation of the sampling distribution of sample means? mean = 7.5, standard deviation = 1.2 mean = 75, standard deviation = 1.2 mean = 75, standard deviation = 12 mean = 7.5, standard deviation = 12RATIONALE The mean of the sampling distribution should be the true population mean, which would be 75 percent. The standard deviation of the sampling distribution is equal to the population standard deviation divided by the square root of the sample size: CONCEPT Center and Variation of a Sampling Distribution 6 Matt just received his test back. He scored a 78 out of a possible 90 points. His teacher told him the mean score on the test was a 70, with a standard deviation of 5. Matt’s z-score for the test was __________. -1.6 1.6 -2.4 2.4 RATIONALE Recall that the z-score can be calculated with the following formula: The given value is 78 points, the mean is 70 points, and the standard deviation is 5 points. Plugthese values in to get the following z-score: This also tells us that 78 is 1,6 z-scores or standard deviations above the mean. CONCEPT Standard Scores and Z-Scores 7 Erica is performing an experiment that requires her to weigh multiple samples. The masses of her samples are found to be normally distributed with a mean of 157g and a standard deviation of 5.2g. If Erica wants to convert her data to a standard normal distribution, which of the following statements is true? The new mean would be 1, and the standard deviation would be 5. The new mean would be 0, and the standard deviation would be 1. The new mean would be 1, and the standard deviation would be 0. The new mean would be 0, and the standard deviation would be 5. RATIONALE The mean and standard deviation for a standard normal is always 0 and 1. It is standardized since it takes all the raw data and converts them into z-scores. CONCEPT Standard Normal Distribution 8The graph in the figure shows the Gross Domestic Product (GDP) from 2008-2011. The segment of the graph that corresponds to almost no GDP growth at all is __________. D C B A RATIONALE In this graph, a segment that is horizontal would show no change in the consumer price index. This occurs at segment C. CONCEPT Line Charts and Time-Series Diagrams9 Which of the following statements is NOT true about the normal distribution? The normal distribution is symmetric about the mean. We only need to know the mean and standard deviation in order to completely describe a normal distribution. A large portion of the data is located near the center in a normal distribution. The normal distribution is an example of a bimodal distribution. The normal distribution can be described as “bell-shaped.” RATIONALE The normal distribution is a bell-shaped symmetic distribution with only one peak. So it is not bi-modal (i.e. 2 modes), but is unimodal, which means it has 1 mode. CONCEPT Normal Distribution 10 Which of the following statements correctly describes the variance of a data set? The variance has the same units as the data set. The variance is the square of the standard deviation.The variance is calculated using the median. The variance has the same units as the standard deviation. The variance is the square root of the standard deviation. RATIONALE In order to go from the variance to the standard deviation (SD), we take the square root. Conversely, to get the variance from the SD we simply square the SD. CONCEPT Standard Deviation 11 Jenova has scored ten standardized tests with scores of 65, 88, 46, 72, 77, 90, 95, 59, 66, and 83. The standardized test score that represents the sixtieth percentile is __________. 59 77 65 66 RATIONALE If we note that there are 10 values, so the 60th percentile can be found with the following calculation:This tells us that we need to find the 6th ordered value. The 6th value is 77. CONCEPT Percentiles 12 Which of the following statements is NOT true? The Central Limit Theorem is applicable only for data sets comprising 30 or more samples. For the Central Limit Theorem to be true, you must have a large sample, the underlying population must be normally distributed, and the standard deviation should not be finite. According to the Central Limit Theorem, the mean of the sampling distribution is equal to the population mean. For a large enough sample size, the Central Limit Theorem states that the sample means of repeated samples of a population are normally distributed. RATIONALE The Central Limit Theorem (CLT) puts no restrictions on the type of population you draw from. It could be normal, uniform, skewed, etc. So, the CLT does not say you must draw from a normal population. It also requires that the variance is finite, which simply means it must be defined. CONCEPTShape of a Sampling Distribution 13 Which of the following two statements are true? The interquartile range is better than the standard deviation to describe skewed data sets. The range is found by subtracting the maximum value from the minimum value. The interquartile range covers the middle 75% of the data set. The range is found by subtracting the minimum value from the maximum value. RATIONALE The definition of the range is simply the max - min value, which is subtracting the min from the max. CONCEPT Range and Interquartile Range (IQR) 14 Stan is looking at the statistics for his favorite baseball player, who has hit 25, 26, 32, 38, 43, 40, 28, 32, 34, and 42 home runs in ten seasons. Using this data set, match each value with the correct description. C Mean B Median AMode A. 32 B. 33 C. 34 RATIONALE The mode is the most frequently occurring data point. The number 32 occurs two times, which is more than any other number's frequency. The mean is equal to the sum of the values divided by how many numbers there are. When we add the total number of home runs, we get 340. There were 10 seasons, so the mean can be calculated by the following calculation: The median is the middle value once the data is ordered. Since there are an even number of values, we take the average of the 2 middle values of 32 and 34 to get a mean of 33: CONCEPT Mean, Median, and Mode 15 Determine if each graph is positively skewed, negatively skewed, or symmetrical. = Correct Answer = Incorrect AnswerPositively (Right) Skewed Negatively (Left) Skewed Symmetrical DistributionRATIONALE Recall that skew tells us the direction of the tail. So a tail to the right is right skewed, while a tail to the left implies left skewed. If the graph is the same on both sides, we refer to it as symmetric. Finally, a graph with 2 peaks is bimodal. CONCEPT Shapes of Distribution 16 Rick is an engineer testing the stress required to break samples of steel. He measured the failure stress of 50 samples and found the mean failure stress to be 350 MPa, with a standard deviation of 25 MPa. If the distribution is normal, the percentage of the data that lies within two standard deviations of the mean is approximately __________. 5% 68% 95% 99.7%RATIONALE The normal distribution follows the empirical rule, which tells us that within 2 standard deviations we should find 95% of the data. CONCEPT 68-95-99.7 Rule 17 In a poll of 216 voters, 134 said they would vote for the candidate from Party X, 52 said they would vote for the candidate from Party Y, and 30 said they would vote for the candidate from Party Z. If a pie chart were to be made showing the support for each candidate, the smallest central angle would be ________ degrees. 87 52 30 50 RATIONALE Recall that to get the angle for something in a pie chart we use the following formula: So in this case, the smallest central angle will be associated with the candidate with the least about of votes, which would be from 30 votes for Party Z. The central angle for the candidate from Party Z would be:So the smallest angle would be 50 degrees. CONCEPT Bar Graphs and Pie Charts 18 A baseball scout recorded the type of pitch a pitcher threw during a game and whether it was thrown for a strike or a ball. Which of the following is a true statement about the stacked bar chart? The pitcher’s most accurate pitch (highest percent strikes) is the curveball. The pitcher threw under 100 total pitches. Over half of the sliders the pitcher threw were balls.The pitcher threw about the same number of strikes when throwing changeups as he did throwing fastballs. RATIONALE Recall that strikes are the lighter color. So if we look at the lighter part of each graph, we can note strikes for changeup is 10 to 35 or about 25 strikes. For fastball it is 22 to 47 or 25 strikes. So there are about the same number of strikes for both of these pitches. CONCEPT Stack Plots 19 Which of the following statements correctly describes a measure of center? There can only be one mode in any given set of data. The mean and median can be used to summarize any quantitative data. The mean is unaffected by extreme values in a small data set. The median is calculated by adding all of the values in a data set and then dividing by the total number of values. The median can be used to describe any qualitative data. RATIONALE Recall that for data that is quantitative, if the dataset is finite there is always a defined mean and median. There is not always a mode.CONCEPT Measures of Center 20 Match each term with its corresponding definition. B A number that describes the middle of a set of data A A qualitative statement about how the data looks after it has been plotted C A number that describes how far the data is from the middle A. Shape B. Center C. Spread RATIONALE Recall that center describes the middle. Spread tells us how the data is distributed and is generally a measure from center (such as variance and standard deviation). Shape describes what the plotted data looks like and is a qualitative measure because it simply describes the shape. CONCEPT Data Analysis 21 A workplace gave an “Employee Culture Survey” in which 500 employees rated their agreementwith the statement, “I feel respected by those I work for.” Rating Frequency Strongly Agree 156 Agree 114 Neutral 99 Disagree 88 Strongly Disagree 43 The relative frequency of people who strongly agree with the statement is __________. 54% 31.2% 16% 8.6% RATIONALE To get the relative frequency, we take the frequency of the value and divide it by the total number. So in this case for strongly agree, the relative frequency would be: CONCEPT Frequency Tables 22 Consider the histogram showing the heights of individuals on a basketball team.Which of the following is the difference in height between the shortest player on the team and the tallest player on the team? 75 inches 4 inches 81 inches 9 inches RATIONALE The shortest height is 75 inches. In the histogram, we can see the frequency is 3, indicating that there are 3 players at that height. Similarly the tallest height is 84 inches. There are 2 players that tall.So the difference in height from the largest to the smallest player is from 75 to 84 inches, or 9 inches. CONCEPT Histograms 23 Consider the times (in seconds) that it took children and adults to solve a Rubik’s cube at a competition. What does the circled section represent? It took 7 children 21 seconds to complete the Rubik’s cube. It took 21 children 7 seconds to solve the Rubik’s cube. Two children took over 70 seconds to solve the Rubik’s cube.It took 7 children 12 seconds to solve the Rubik’s cube. RATIONALE Recall, that a stem and leaf shows the data in stem and leaf form. So, the stem of 7 implies that this is in the tens, so 70 seconds. So the 1 and 2 mean 70+1 or 71 seconds and 70+2 = 72 seconds. This means we can say 2 children took a bit over 70 seconds to complete the cube. CONCEPT Stem-and-Leaf Plots 24 Sara wonders what percentage of her students answered over 75% of the quiz questions correctly. The relative cumulative frequency of students who earned a score of 31 or higher on thequiz is __________%. 44% 6% 88% 12% RATIONALE To get the relative frequency of 31 or higher, we need to find the cumulative number of 31 or more. We simply add up any bin that has the number 31 or more, such as the bin that shows scores of 31-35 and 36-40. This would be: To get relative frequency, we will take this cumulative number and divide it by the total number of students. CONCEPT Cumulative Frequency 25 Joe is playing a game in which he has to roll two six-sided dice. In his past ten rolls, he has rolled a sum of one 2, two 5s, three 7s, two 8s, one 10, and one 12. The weighted mean of all of Joe’s dice rolls is __________. 7.17.5 7.3 6.8 RATIONALE In order to get the weighted average, we use the following formula: The weight for each value is the number of times a value counts towards the total. For example, the value 2 occurred once, the value of 5 occurred twice, etc. CONCEPT Weighted Mean 26 Katherine, Jonathan, and Ryan are very competitive friends who went bowling. Afterwards, two of them decided to make bar graphs to plot their scores.Who do you think made Graph 1 and why? Jonathan, because he wanted to make the scores appear reasonably close. Jonathan, because he wanted to make the scores appear very different. Ryan, because he wanted to accurately show each person’s score. Katherine, because she wanted to make the scores appear reasonably close. Katherine, because she wanted to make the scores appear very different. RATIONALE Although we cannot know for sure, it looks like the bar that is most different between the 2 is for Katherine. She has a much larger value in graph 1. Since they are competitive, it would be logical to assume she overestimated her score to look the best and thus created graph 1. CONCEPT Misleading Graphical Displays © 2020 SOPHIA Learning, LLC. SOPHIA is a registered trademark of SOPHIA Learning, LLC. About Contact Us Privacy Policy Terms of Use [Show More]
Last updated: 1 year ago
Preview 1 out of 26 pages
Reviews( 0 )
Recommended For You
Environmental Science> SOPHIA PATHWAY > Sophia - Environmental Science - Unit 4 Milestone 4,100% CORRECT (All)
Sophia - Environmental Science - Unit 4 Milestone 4,100% CORRECT
Sophia - Environmental Science - Unit 4 Milestone 4
By securegrades , Uploaded: Jan 01, 2022
$14
Biology> SOPHIA PATHWAY > SOPHIA PATHWAY_Human Biology_Unit 5 Milestone 5. Concepts indicated and ALL CORRECT ANSWERS HIGHLIGHTED IN YELLOW. (All)
SOPHIA PATHWAY_Human Biology_Unit 5 Milestone 5. Concepts indicated and ALL CORRECT ANSWERS HIGHLIGHTED IN YELLOW.
Sophia - Human Biology - Unit 5 Milestone 51 Correct Answers Highlighted in Yellow Which type of pancreatic cells help to lower blood sugar? • Delta cells • Beta cells • Alpha cells • Ga...
By QuizMaster , Uploaded: Oct 10, 2020
$8
*NURSING> SOPHIA PATHWAY > PALS - Team Response Final Scenario: Sophia Giamanti COMPLETE SOLUTION 2022 (All)
PALS - Team Response Final Scenario: Sophia Giamanti COMPLETE SOLUTION 2022
PALS - Team Response Final Scenario: Sophia Giamanti COMPLETE SOLUTION 2022 Which of the following should Jeremy do immediately after checking for responsiveness using the shouttap-shout sequence? -...
By Prof.Pierro , Uploaded: Jul 11, 2022
$6
Environmental Science> SOPHIA PATHWAY > Sophia - Environmental Science - Unit 3 Challenge 1 (All)
Sophia - Environmental Science - Unit 3 Challenge 1
Sophia - Environmental Science - Unit 3 Challenge 1/Sophia - Environmental Science - Unit 3 Challenge 1/Sophia - Environmental Science - Unit 3 Challenge 1/Sophia - Environmental Science - Unit 3 Chal...
By PROF , Uploaded: Apr 23, 2021
$10
*NURSING> SOPHIA PATHWAY > Sophia - Environmental Science - Unit 3 Challenge 1 (All)
Sophia - Environmental Science - Unit 3 Challenge 1
Sophia - Environmental Science - Unit 3 Challenge 1
By PROF , Uploaded: Feb 08, 2021
$13.5
*NURSING> SOPHIA PATHWAY > NURS C475|Care of the older Adult study guide Objectives (complete) Latest 2022 (All)
NURS C475|Care of the older Adult study guide Objectives (complete) Latest 2022
Care of the older Adult. #1 Competency 742.1.1: Compassionate and Respectful Care of Older Adults 1. How do you define Baby Boomers? Born between 1946-1964 2. What are the five racial groups lis...
By Expert1 , Uploaded: Oct 22, 2020
$15
Environmental Science> SOPHIA PATHWAY > SOPHIA PATHWAY Sophia - Environmental Science - Practice Unit 1 Milestone 1. CORRECT ANSWERS HIGHLIGHTED IN YELLOW. (All)
SOPHIA PATHWAY Sophia - Environmental Science - Practice Unit 1 Milestone 1. CORRECT ANSWERS HIGHLIGHTED IN YELLOW.
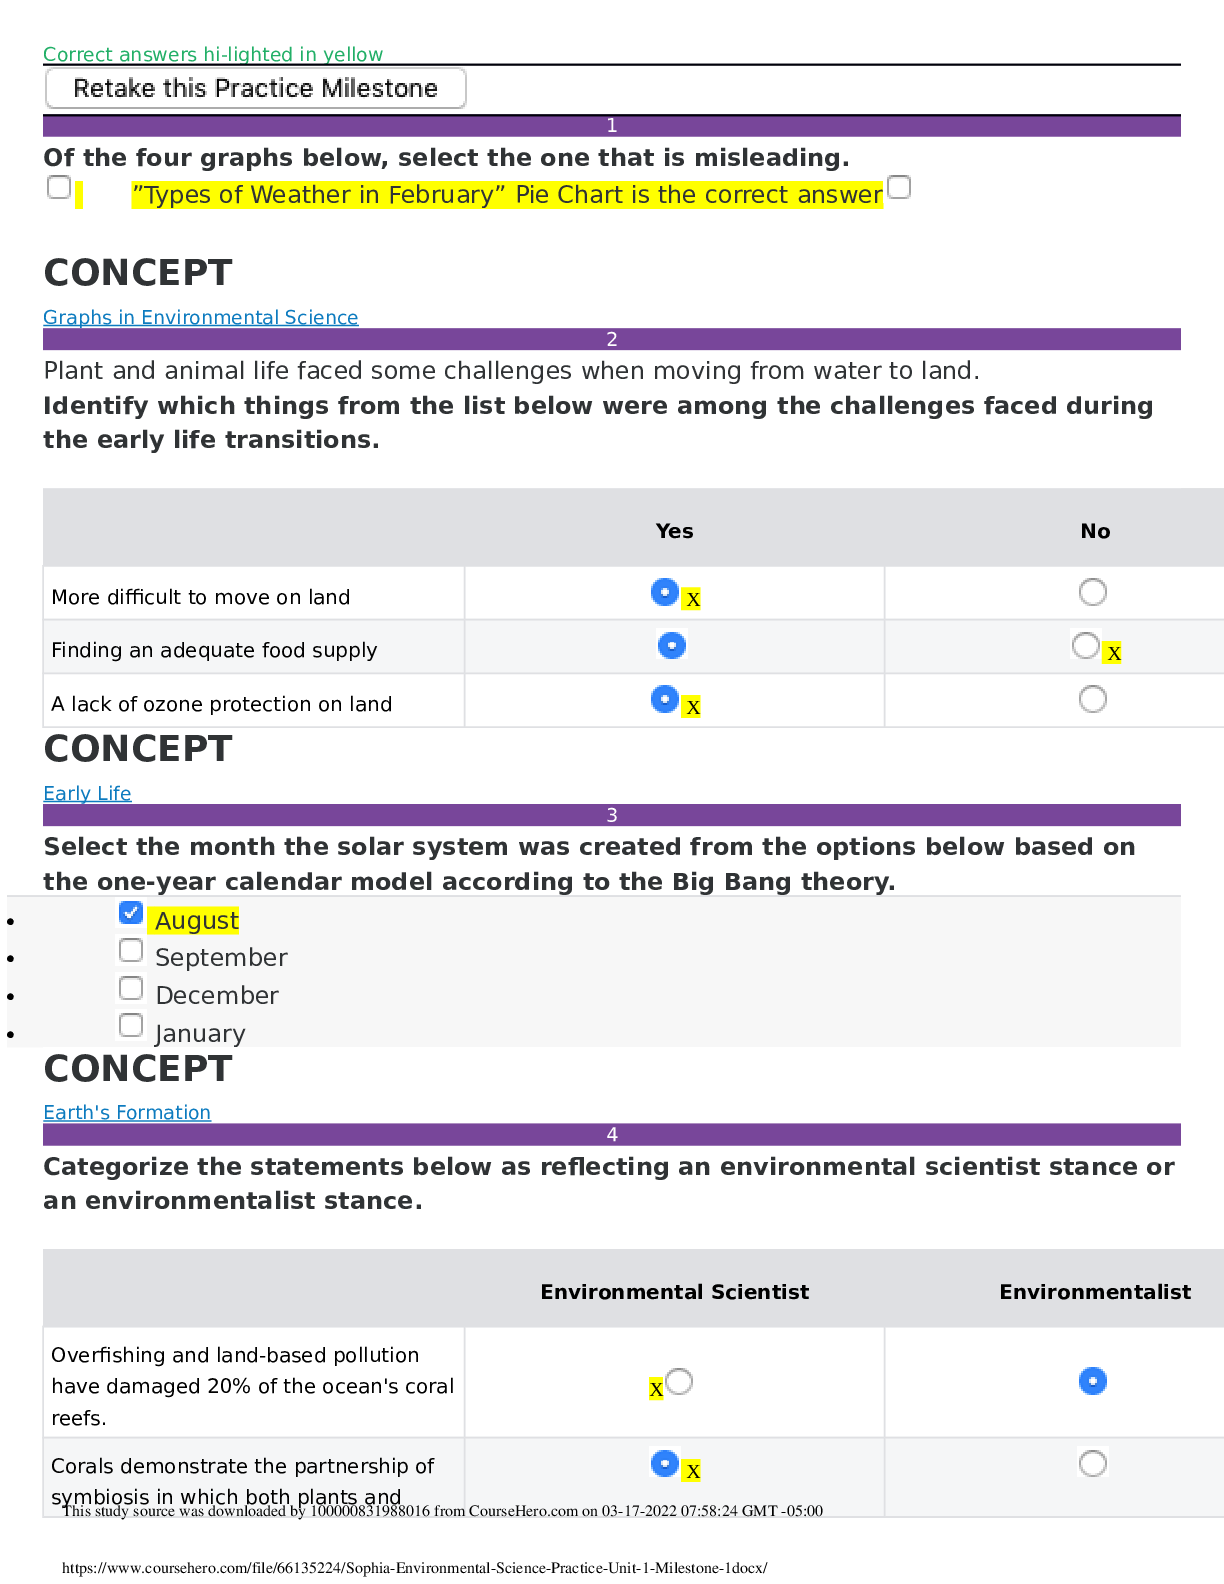
Of the four graphs below, select the one that is misleading. ”Types of Weather in February” Pie Chart is the correct answer CONCEPT Graphs in Environmental Science 2 Plant and animal life f...
By QuizMaster , Uploaded: Oct 09, 2020
$9.5
Statistics> SOPHIA PATHWAY > MAT 300 Unit 2 - Introduction to Statistics Practice Milestone_2 - 2022/2023 | MAT300 Unit_2_Practice Milestone_2_Graded A+ (All)
MAT 300 Unit 2 - Introduction to Statistics Practice Milestone_2 - 2022/2023 | MAT300 Unit_2_Practice Milestone_2_Graded A+
MAT 300 Unit_2_Milestone_2_ (2022) - Sophia University MAT300 Unit_2_Milestone_2_(2022) Introduction to Statistics PRACTICE MILESTONE 2 Are you ready to take the Milestone 2? Taking this practice...
By Martin Freeman , Uploaded: Sep 14, 2020
$14.5
History> SOPHIA PATHWAY > US HISTORY 1-UNIT 4-MILESTONE 4_Questions & Answers (Fall 2023) (All)
US HISTORY 1-UNIT 4-MILESTONE 4_Questions & Answers (Fall 2023)
US HISTORY 1-UNIT 4-MILESTONE 4 1 Why did the Committee of Merchants for the Relief of Colored People Suffering from the Late Riots emphasize that Peter Heuston's "wife died about three weeks before...
By Expert#1 , Uploaded: Sep 15, 2020
$5.5
Statistics> SOPHIA PATHWAY > Sophia Statistics Final Milestone 2022/2023 | Sophia Statistics Final Milestone_LATEST ANSWERS & RATIONALE (All)
Sophia Statistics Final Milestone 2022/2023 | Sophia Statistics Final Milestone_LATEST ANSWERS & RATIONALE
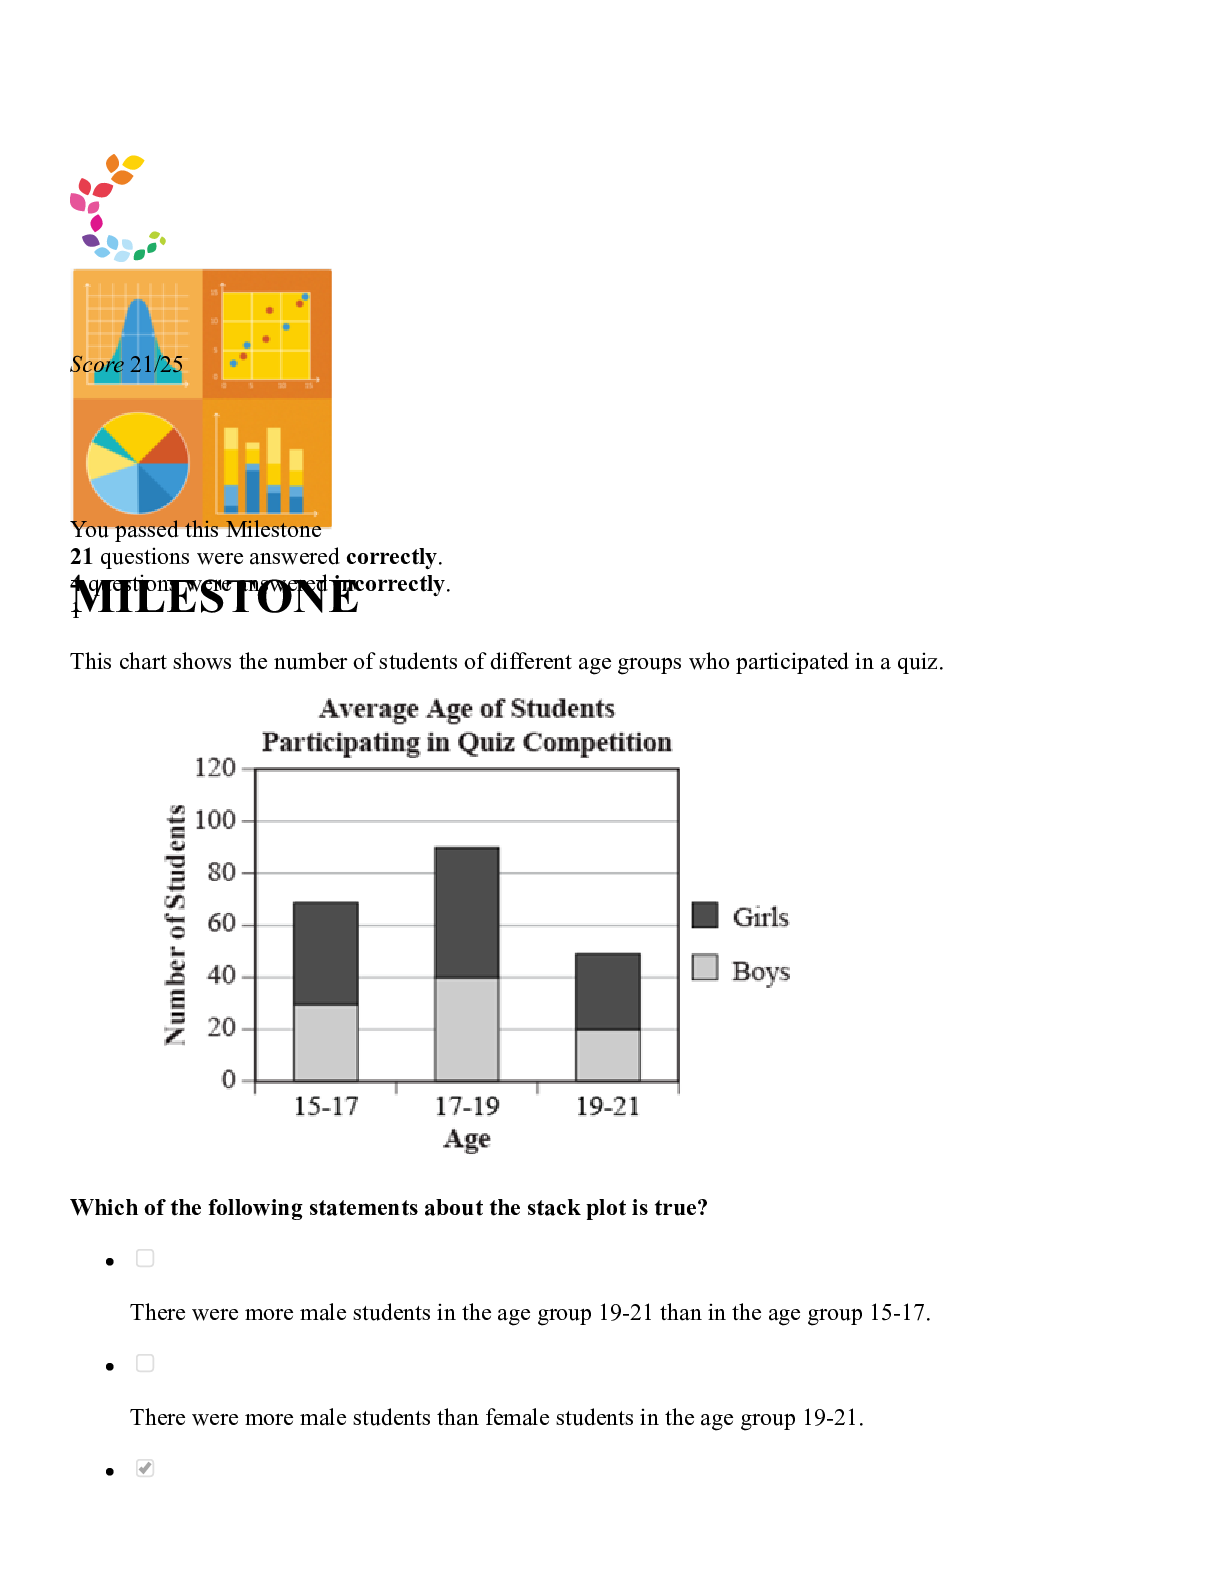
Sophia_Statistics_Final_Milestone 2022 - Metropolitan Community College | Sophia_Statistics_Final_Milestone 2020 - (ANSWERS AND RATIONALE) MILESTONE Score 21/25 You passed this Milestone 21 questi...
By Martin Freeman , Uploaded: Sep 11, 2020
$14.5
Document information
Connected school, study & course
About the document
Uploaded On
Sep 14, 2020
Number of pages
26
Written in

Additional information
This document has been written for:
Uploaded
Sep 14, 2020
Downloads
1
Views
211