Food and Nutrition > PROJECT FINAL > IHP 340 Final Project Research Analyses Food Environments and Obesity: Household Diet Expenditure ve (All)
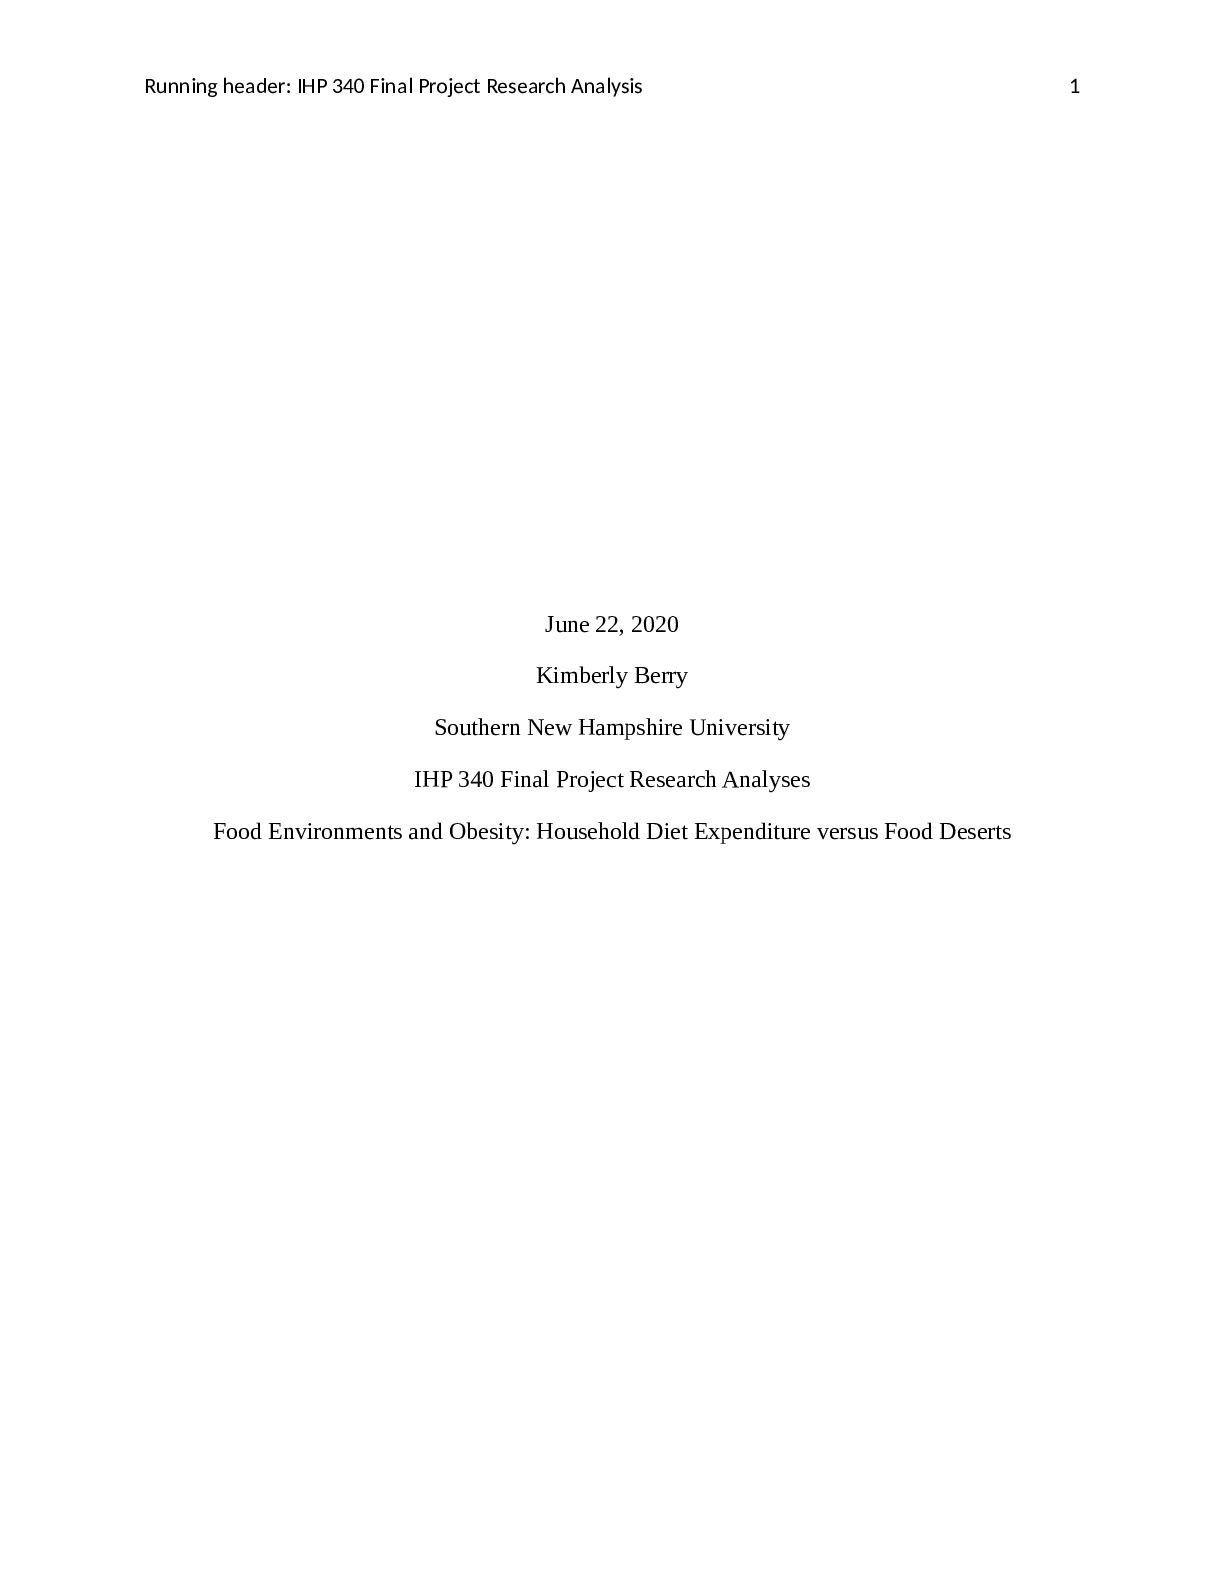
IHP 340 Final Project Research Analyses Food Environments and Obesity: Household Diet Expenditure versus Food Deserts
Document Content and Description Below
For this analysis, I used the chose the 2016 article, "Food Environments and Obesity: Household Diet Expenditure Versus Food Deserts,” by Chen Danhong, Edward Jaenicke, and Richard J. Volpe. The s... tudy was done to explore the association between obesity and food environments at both at home and in the community. Researchers were seeking to answer how obesity and overweight status, may be influenced by individual factors, such as age and gender; household factors like race, ethnicity, education and income, home food environment, and, neighborhood factors such as the density and types of food establishments, poverty rates, and, urban vs. rural community status. (Danhong, et.al. 2016) The researchers hypothesized, they would find an association between the USDA score and obesity. They believed when the study participant’s diets became healthier, and, the USDA Food Score rose, the rate of obesity would fall. The researchers also believed they would find higher obesity rates within more rural communities with fewer healthy food options. (Danhong, et.al. 2016) The study, “Food Environments and Obesity: Household Diet Expenditure Versus Food Deserts,” was an observational study, using data collected from several sources such as selfreported responses to questionnaires collected and stored in the IRi Consumer Panel. The IRi Consumer Panels companion, the IRi MedProfiler, 2012 data set, provided "self-reported responses on height, weight, health outcomes, and various behavioral questions for individuals in the IRi households matched by household ID." (Danhong, et.al. 2016, pg.2 para.4) Additionally, data from government offices like the US census Bureau and the USDA were used. The participant pool consisted of 38,650 individuals living in 18,381 households, located with 2,104 counties in the United States. Researchers compiled data sets, obtained from the IRi IHP 340 Final Project 3 Consumer Panel and IRi MedProfiler. This data included, all retail food purchases made by the study participants between 2008 and 2012 recorded using a handheld scanner device,(Danhong, et.al., 2016) household information, and, the self-reported responses to questionnaires, regarding height, weight, their health and behavior. Their multi-level data set also contained neighborhood data such as food and restaurant information collected by the US Census Bureau's County Business Patterns, population and poverty rates from the US Census Bureau's American Community Survey, and, census tract food desert statistics from the USDA. (Danhong, et.al. 2016) These data collection methods were appropriate, as this study looked at a large pool of data from individuals living in many counties across the U.S. and spanned approximately 5 years. The food purchase data “reflected all food purchases from 2008 to 2012.” (Danhong, et.al. 2016, pg.2 para.4) Considering the volume of data and span of time looked at, it would have been very difficult and inefficient, not to have used data previously collected. Additionally, using the scanner data, gave more accurate at-home food purchases, with potentially less bias, than selfreported purchases. Considering the volume of data and span of time looked at, it would have been very difficult and inefficient, not to have used data previously collected. The majority of the data in this study is quantitive, but there is a small mix of categorical data in the data set as well. Examples of quantitive data collected for this study would be the participant’s age, weight and height, and, the retail food expenditure data, as well as, the numbers of restaurants and grocery stores in each participant's county. Categorical data used in this study includes household-level demographic characteristics, such as race/ethnicity, household size, income, education, and marital status, collected directly from the IRi Consumer Panel. (Danhong, et.al. 2016) IHP 340 Final Project 4 While the study's use of scanner data to provide participant food purchase history, was efficient and likely contained less bias than that of self-reported information, there is potential weakness in this data collection method as well. The scanner data only accounted for food-athome purchases and did not include restaurant or convenience store purchases, or, food consumption. Another potential weaknesses in the data collection methods included the number of food stores or restaurants per capita basically identified a “supply ratio,” and "did not take into consideration geographic distance and mobility obstacles to access the food outlets that might be measured if data were geocoded," (Danhong, et.al. 2016, pg.7 para. 3) The reliance on selfreported information, which can be subject to error is also a potential weakness. The authors state, “Our study relied on self-reported information found in IRi’s MedProfiler data and might be subject to various measurement errors. A systematic review of previous studies comparing self-reported with measured heights and weights concluded that, in general, heights tend to be over reported and weights are underreported, leading to underestimated BMIs.” (Danhong, et.al. 2016, pg.7 para.2) Statistical analysis of the data collected in this study was done based on multilevel models with random components at the individual, household and neighborhood levels to account for the multi-level data set. The multilevel model was used after the researcher’s calculated descriptive statistics for obesity and overweight status, individual and household variables. The researchers reported means and standard deviations for continuous variables, and, percentages for observations equal to 1 for binary variables, using two dependent variables in their models, obesity and overweight status. Examples of the descriptive statistical percentages or means, are overweight status 31.92%, diet feature 0.00 plus or minus 1.00, fast food consumed 3.29% and exercise 39.98%. (Danhong, et.al.2016). All study models included the obesity and overweight IHP 340 Final Project 5 status, individual and household variables. The statistical analysis was performed using Stata version 13(StataCorp LP, College Station, TX).” (Danhong, et.al. 2016, pg.7 para.2). Since the researchers used multiple data sets across individual, household and neighborhood levels, from several years, the statistical analysis method, using random-intercept logistic models for most of the study’s major analysis, was appropriate. The multi-level models are most efficient when looking at multiple data sets, and using the multi-level model, researchers were able model all levels in the study at once. (Ponce, 2013) The article stated, "To account for the multilevel data structure, we based our major analyses on random-intercept logistic models (or multilevel models) with random components at the individual, household, and neighborhood levels." (Danhong, et.al. 2016, pg.4 para.4-5) While the use of random intercept logistic models for analysis of multi-level data sets is most efficient, and, recommended, there is possible weakness in this method. For example, Multi-level models are less robust and more difficult estimate than other methods of analysis dealing with clustering. (Ponce, 2013) Also, for the most accurate multi-level models, it is necessary to have sufficient sample sizes at all levels. (Ponce, 2013) In this study, actual sample sizes were smaller due to missing responses and omitted information. (Danhong, et.al. 2016, pg.2 para.6) Key demographics of the 38,650 individuals, 18,381 households and 2104 U.S. counties in the study sample, gender, both male and female, age, participants ranged between 30 years old and 71years old. Key demographics also include overweight status (32%) and obesity status (32%), race, ethnicity, education, marital status (62% were married) and income. Study participant’s estimated mean household income at above $69 000.00. Neighborhood level demographics included metro status, food desert tracts and food establishments’ density. IHP 340 Final Project 6 (Danhong, et.al. 2016) Inclusion criteria included all adults over the age of 18, living within the 2,104 counties in the U.S. responding to questionnaires sent by the IRi Consumer panel. For respondent households with children, BMI data was included for children between the ages of 2 and 17. Exclusion criteria included any child under the age of 2. (Danhong, et.al. 2016) The results of the study, “Food Environments and Obesity: Household Diet Expenditure Versus Food Deserts,” showed that while neighborhood food environments had less impact than individual and household characteristics, those living in areas with limited access to healthy food options, especially, fruits and vegetables were more likely to become obese. (Danhong, et.al. 2016) The density of small grocery stores, fast food restaurants, convenience stores and supercenters does appear to be associated with obesity or overweight status. The authors state, “our study found that higher densities of club stores and supercenters were associated with higher odds of overweight or obesity status in our non-metro subsample."(Danhong, et.al. 2016, pg.6, para.2) One exception to the study results reflecting the association between food establishments and obesity status is full service restaurants, the results indicated that tracts with a density of full-service restaurants, "were negatively associated with obesity status (OR = 0.97; 95% CI = 0.94, 0.99)." (Danhong, et.al. 2016, pg.5, para.4) The key take away from this study, is that individual demographics, such as race, ethnicity, age, gender and lifestyle choices, had the strongest impact on obesity rates and overweight status, but, food environment and food deserts do affect obesity prevalence. (Danhong, et.al, 2016) To support the significance of their findings, the authors of this study not only researched and compared previous studies, looking at the association of obesity prevalence and food environment, but also encompassed the roles of food at home and the neighborhood food environment, as well as, several other important controls. (Danhong, et.al. 2016) IHP 340 Final Project 7 Study participants included male and female, age 30-71, white and black, college and noncollege educated, married and un-married, in higher and lower socio-economic status and living in both urban and non-urban neighborhoods. (Danhong, et.al. 2016) In this study, 85% of households were white as opposed to 15% Black and Hispanic households, 83% had some level of college education, 62% were married vs. 38% unmarried. Females comprised 53% of the participants. (Danhong, et.al. 2016) There were several contrasts in the individual measures among the different groups in the study sample. The study showed females were more likely to be obese than males, Non-Hispanic Blacks were more likely to be obese or overweight than NonHispanic Whites, and, Asians were significantly less likely to be overweight than either Whites or Blacks. Household measures indicated households with college or post college educated individuals, are less likely to be obese than those with high school educations or less. Additionally, the study reflected higher income groups were less likely to be obese or overweight, than the lower socio-economic group. (Danhong, et.al. 2016) Despite the large sample population, there are at least two significant limitations related to this sample pool. First, 85% of study participants were Non-Hispanic Whites. Since other studies have shown that Whites are less likely than Blacks to be obese or overweight, a more equal ratio of Non-Hispanic Blacks and Whites may have given different results. (Danhong, et.al. 2016) A second limitation within the study population is that 83% of participant households had some level of college education. It has been shown that college educated households typically have a higher socio-economic status and are less likely to be obese or overweight when compared to non-college educated households, again possibly reflecting selection bias. (Danhong, et.al. 2016) The sample size also presents a limitation. Although the original full data set included 38,650 IHP 340 Final Project 8 individuals, the actual sample size used for analysis was smaller, due to missing observations for [Show More]
Last updated: 1 year ago
Preview 1 out of 24 pages

Reviews( 0 )
Recommended For You
Food and Nutrition> PROJECT FINAL > Food Environments and Obesity: Household Diet Expenditure versus Food Deserts (All)

Food Environments and Obesity: Household Diet Expenditure versus Food Deserts
The study was conducted to determine the association and relation between food environments and obesity. The research question was to identify how various aspects of food environment that is at home...
By Nutmegs , Uploaded: Jul 18, 2021
$7
Food and Nutrition> PROJECT FINAL > Food environments and obesity: Household diet expenditure versus food deserts (All)

Food environments and obesity: Household diet expenditure versus food deserts
List the title and author of the article you chose. Chen, D., Jaenicke, E. C., & Volpe, R. J. (2016). Food environments and obesity: Household diet expenditure versus food deserts Describe the purp...
By Nutmegs , Uploaded: Jul 18, 2021
$7
Food and Nutrition> PROJECT FINAL > Food Environments and Obesity: Household Diet Expenditure versus Food Desert (All)

Food Environments and Obesity: Household Diet Expenditure versus Food Desert
Food Environments and Obesity: Household Diet Expenditure versus Food Desert In my reading of Food Environments and Obesity: Household Diet Expenditure versus Food Dessert and after also examining O...
By Nutmegs , Uploaded: Jul 18, 2021
$7
Food and Nutrition> PROJECT FINAL > Food Environments and Obesity: Household Diet Expenditure Versus Food Deserts. (All)

Food Environments and Obesity: Household Diet Expenditure Versus Food Deserts.
Authors: Danhong Chen; Jaenicke, Edward C.; Volpe, Richard J. Affiliation: Department of Agricultural Economics and Agribusiness, University of Arkansas, Fayetteville Department of Agricultural Ec...
By Nutmegs , Uploaded: Jul 18, 2021
$7
Financial Accounting> PROJECT FINAL > ACC 201 5-1 Final Project Milestone Two - Accounting Workbook (All)

ACC 201 5-1 Final Project Milestone Two - Accounting Workbook
Overview In Milestone One, you completed the first part of your course project to demonstrate your ability to accurately record financial data. In Milestone Two, you will use your journal entries fro...
By ACADEMICTUTORIAL , Uploaded: Nov 29, 2021
$3.5
Information Technology> PROJECT FINAL > IDS 403 4-2 Final Project Milestone 2 Analyzing an Issue or Event in Technology (All)

IDS 403 4-2 Final Project Milestone 2 Analyzing an Issue or Event in Technology
Analyzing an Issue or Event in Technology through the Lenses of History and the Humanities
By ACADEMICTUTORIAL , Uploaded: Jan 24, 2022
$3
*NURSING> PROJECT FINAL > NURS 420 Final Project Outline (All)

NURS 420 Final Project Outline
NURS 420 Final Project Outline
By ACADEMICTUTORIAL , Uploaded: May 18, 2022
$3
Business> PROJECT FINAL > BUS 206 5-2 Project Two Submission (All)

BUS 206 5-2 Project Two Submission
BUS 206 5-2 Project Two Submission
By ACADEMICTUTORIAL , Uploaded: May 18, 2022
$3
Health Care> PROJECT FINAL > IHP 330 7-2 Final Project (All)

IHP 330 7-2 Final Project
Principles of Epidemiology IHP 330 7-2 Final Project
By ACADEMICTUTORIAL , Uploaded: May 19, 2022
$3
Health Care> PROJECT FINAL > HSC 1531 Module 06 Course Project Full Medical Record (All)

HSC 1531 Module 06 Course Project Full Medical Record
HSC 1531 Module 06 Course Project Full Medical Record
By ACADEMICTUTORIAL , Uploaded: May 20, 2022
$3
Document information
Connected school, study & course
About the document
Uploaded On
Jul 18, 2021
Number of pages
24
Written in
Additional information
This document has been written for:
Uploaded
Jul 18, 2021
Downloads
0
Views
117


