Statistics > STUDY GUIDE > STAT 200 - Assignment #2_ Descriptive Statistics Analysis and Writeup (complete solution) (All)
STAT 200 - Assignment #2_ Descriptive Statistics Analysis and Writeup (complete solution)
Document Content and Description Below
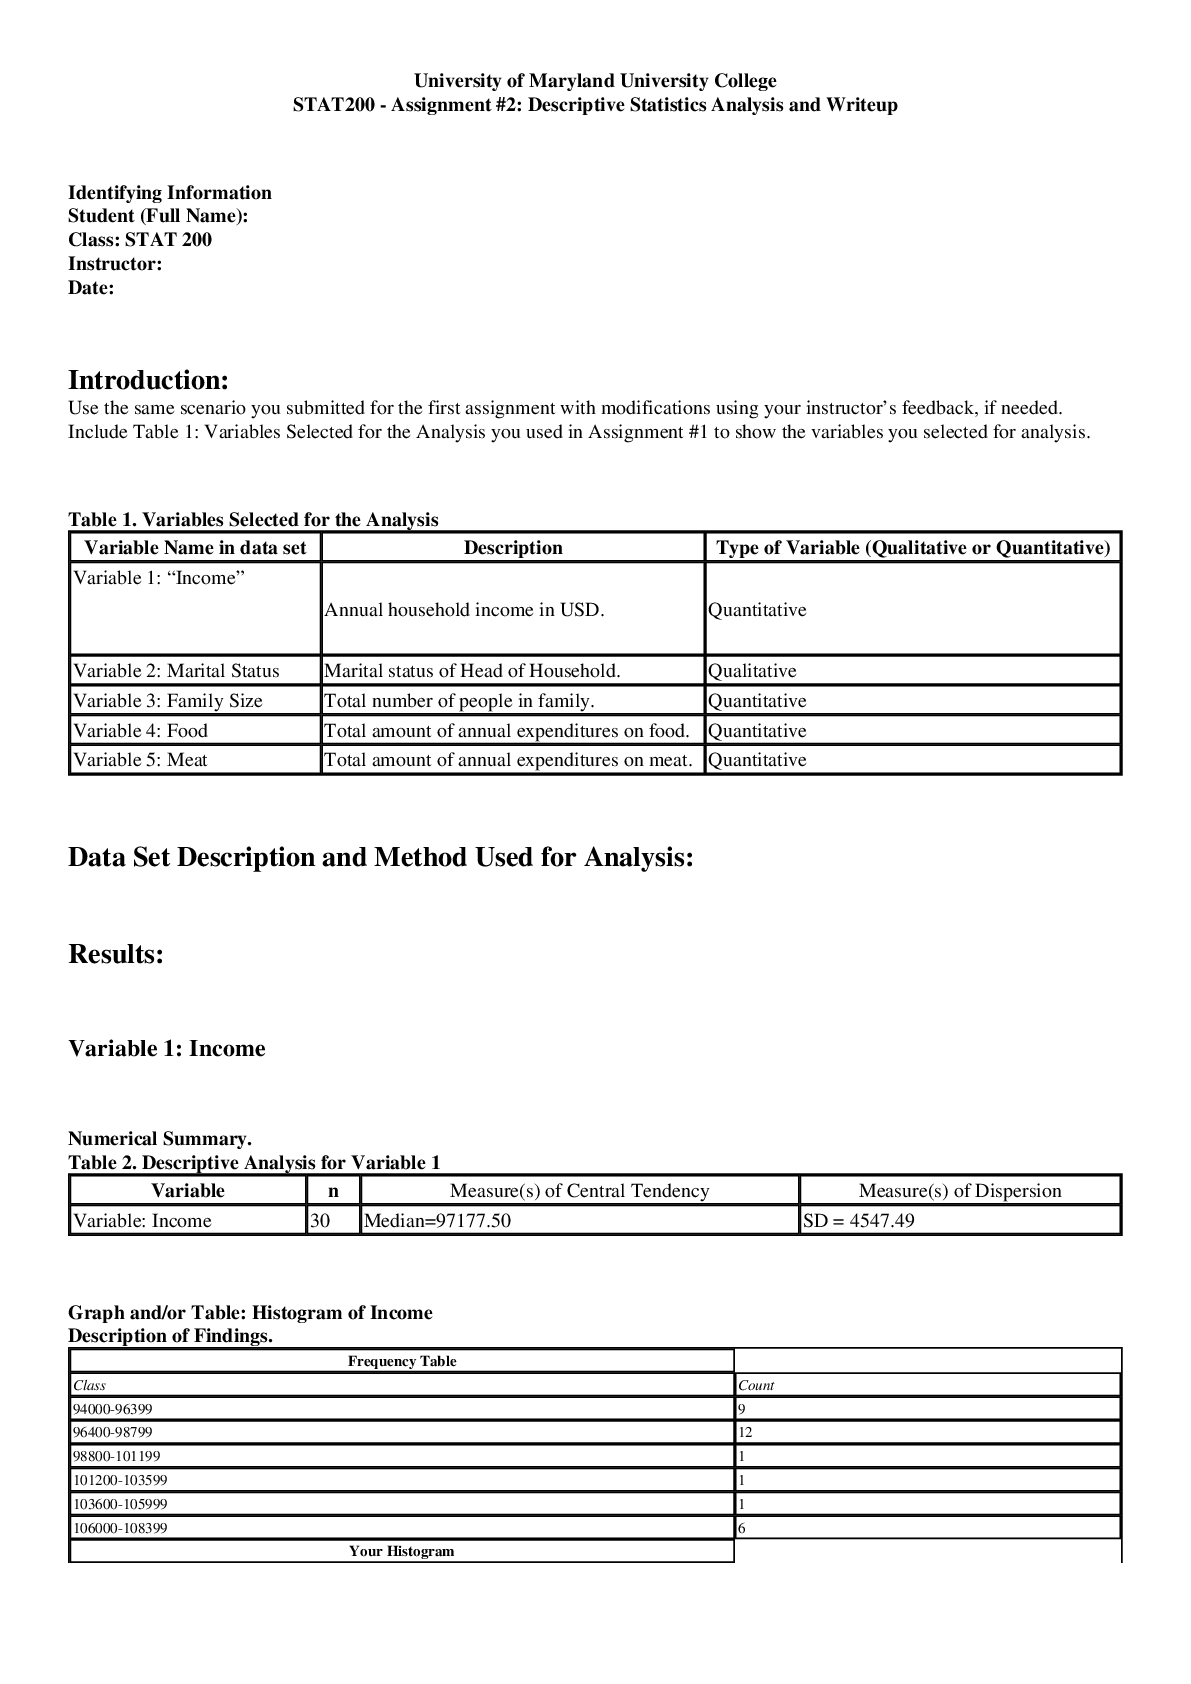
University of Maryland University College STAT200 - Assignment #2: Descriptive Statistics Analysis and Writeup Identifying Information Student (Full Name): DeNedra Hodge Class: STAT 200 Instructor: Pr... ofessor Chen Date: 20 June 2018 Introduction: The sample data was gathered from 30 households chosen randomly from US Department of Labor’s 2016 Consumer Expenditure Surveys. The information provided in the survey were both socioeconomic and expenditure variables that were provided by each household. From the dataset, I plan to learn approximately how much income and expenses the average household incurs. All income and expenses must be gathered for each household in order to get a better picture. Table 1. Variables Selected for the Analysis Variable Name in the Data Set Description (See the data dictionary for describing the variables.) Type of Variable (Qualitative or Quantitative) Variable 1: “Income” Annual household income in USD. Quantitative Variable 2: “Expenditures” Annual household expenditures USD Quantitative Variable 3: “Housing” Annual household housing costs USD Quantitative Variable 4: “Electricity” Annual household electricity costs USD Quantitative Variable 5: “Water” Annual household water costs USD Quantitative Data Set Description and Method Used for Analysis: Results: Variable 1: Income Numerical Summary. Table 2. Descriptive Analysis for Variable 1 Variable n Measure(s) of Central Tendency Measure(s) of Dispersion Variable: Income 30 Median= 96907 SD = 6402.215 Graph and/or Table: Histogram of Income Description of Findings. From the analysis, we can see that the median is 96907 ad standard deviation is 6402.215. We can see that the standard deviation is high which means there is a high disparity on incomes of the sample. We can also see from the histogram that many families earn an income that ranges from 94 867 and 102 067. Variable 2: Expenditure Numerical Summary. Table 3. Descriptive Analysis for Variable 2 Variable N Measure(s) of Central Tendency Measure(s) of Dispersion Variable: Expenditure 30 Mean = 67 631.5 SD = 12 312.27 Graph and/or Table. Description of Findings. For this variable, we can see that the deviation for the mean is 12 312.5 with the mean as 67 631.5. The deviation from mean is high which shows that most families have a high difference in income. Variable 3: Housing Numerical Summary. Table 4. Descriptive Analysis for Variable 3 Variable n Measure(s) of Central Tendency Measure(s) of Dispersion Variable: Housing 30 Mean = 21684.67 SD = 3463.397 Graph and/or Table. Description of Findings. The mean is 21 684.67 and standard deviation 3463.397. The deviation is less which means that most families spend almost same amount in their annual housing cost. Variable 4: Electricity Numerical Summary. Table 5. Descriptive Analysis for Variable 4 Variable N Mean/Median St. Dev. Variable 4: Electricity 30 Mode: 1478 SD: 102.2936 Graph and/or Table. Description of Findings. From the analysis we see that that the most occurring electric bill is 1478, the standard deviation is 102.2936 meaning the deviation around the mean is low. Variable 5: water Numerical Summary. Table 6. Descriptive Analysis for Variable 5 Variable n Measure(s) of Central Tendency Measure(s) of Dispersion Variable: 30 Median = 554 Sd: 100.8857 Graph and/or Table. Description of Findings. It has a median of 554 and a standard deviation of 100.8857. The deviation from the mean for water coast Is less which means most families use almost same amount of water. Discussion and Conclusion. Based on the information, most families spend about the same amount in housing, electricity and water expenses. It’s also identified that there is a high disparity on incomes and that the majority of household income ranges from 94 867 and 102 067. Additionally, there is a big difference in income for some households. Income From Variable 1: “Income” Variable 2: “Expenditures” Variable 3: “Housing” Variable 4: “Electricity” Variable 5: “Water” 551.0 542.0 548.0 520.0 546.0 555.0 538.0 545.0 552.0 535.0 553.0 540.0 523.0 539.0 523.0 547.0 743.0 814.0 773.0 705.0 719.0 694.0 754.0 620.0 627.0 689.0 767.0 769.0 709.0 768.0 56124.0 56440.0 55120.0 55932.0 55247.0 55963.0 57082.0 56453.0 56515.0 56488.0 55558.0 55746.0 55321.0 56051.0 55512.0 76558.0 80801.0 82699.0 83347.0 73092.0 81419.0 71597.0 83766.0 75996.0 73550.0 72971.0 83448.0 83471.0 82676.0 84002.0 18676.0 18376.0 18391.0 18701.0 18483.0 18435.0 18576.0 18520.0 18648.0 18838.0 18502.0 18149.0 18312.0 18484.0 18633.0 26513.0 25392.0 24949.0 22915.0 23252.0 26991.0 22376.0 22899.0 26283.0 27164.0 23150.0 25679.0 26074.0 22414.0 26771.0 1468.0 1441.0 1458.0 1479.0 1451.0 1465.0 1478.0 1469.0 1480.0 1470.0 1478.0 1455.0 1450.0 1457.0 1485.0 1342.0 1514.0 1503.0 1723.0 1300.0 1421.0 1315.0 1682.0 1326.0 1330.0 1320.0 1511.0 1486.0 1688.0 1457.0 STAT200: Assignment #2 - Descriptive Statistics Analysis Writeup - Template Page 1 of 1 [Show More]
Last updated: 1 year ago
Preview 1 out of 6 pages

Reviews( 0 )
Document information
Connected school, study & course
About the document
Uploaded On
Dec 15, 2020
Number of pages
6
Written in

Additional information
This document has been written for:
Uploaded
Dec 15, 2020
Downloads
0
Views
52


.png)