Programming > QUESTIONS & ANSWERS > University of California, Berkeley DATA MISC Homework 08 Confidence Intervals (All)
University of California, Berkeley DATA MISC Homework 08 Confidence Intervals
Document Content and Description Below
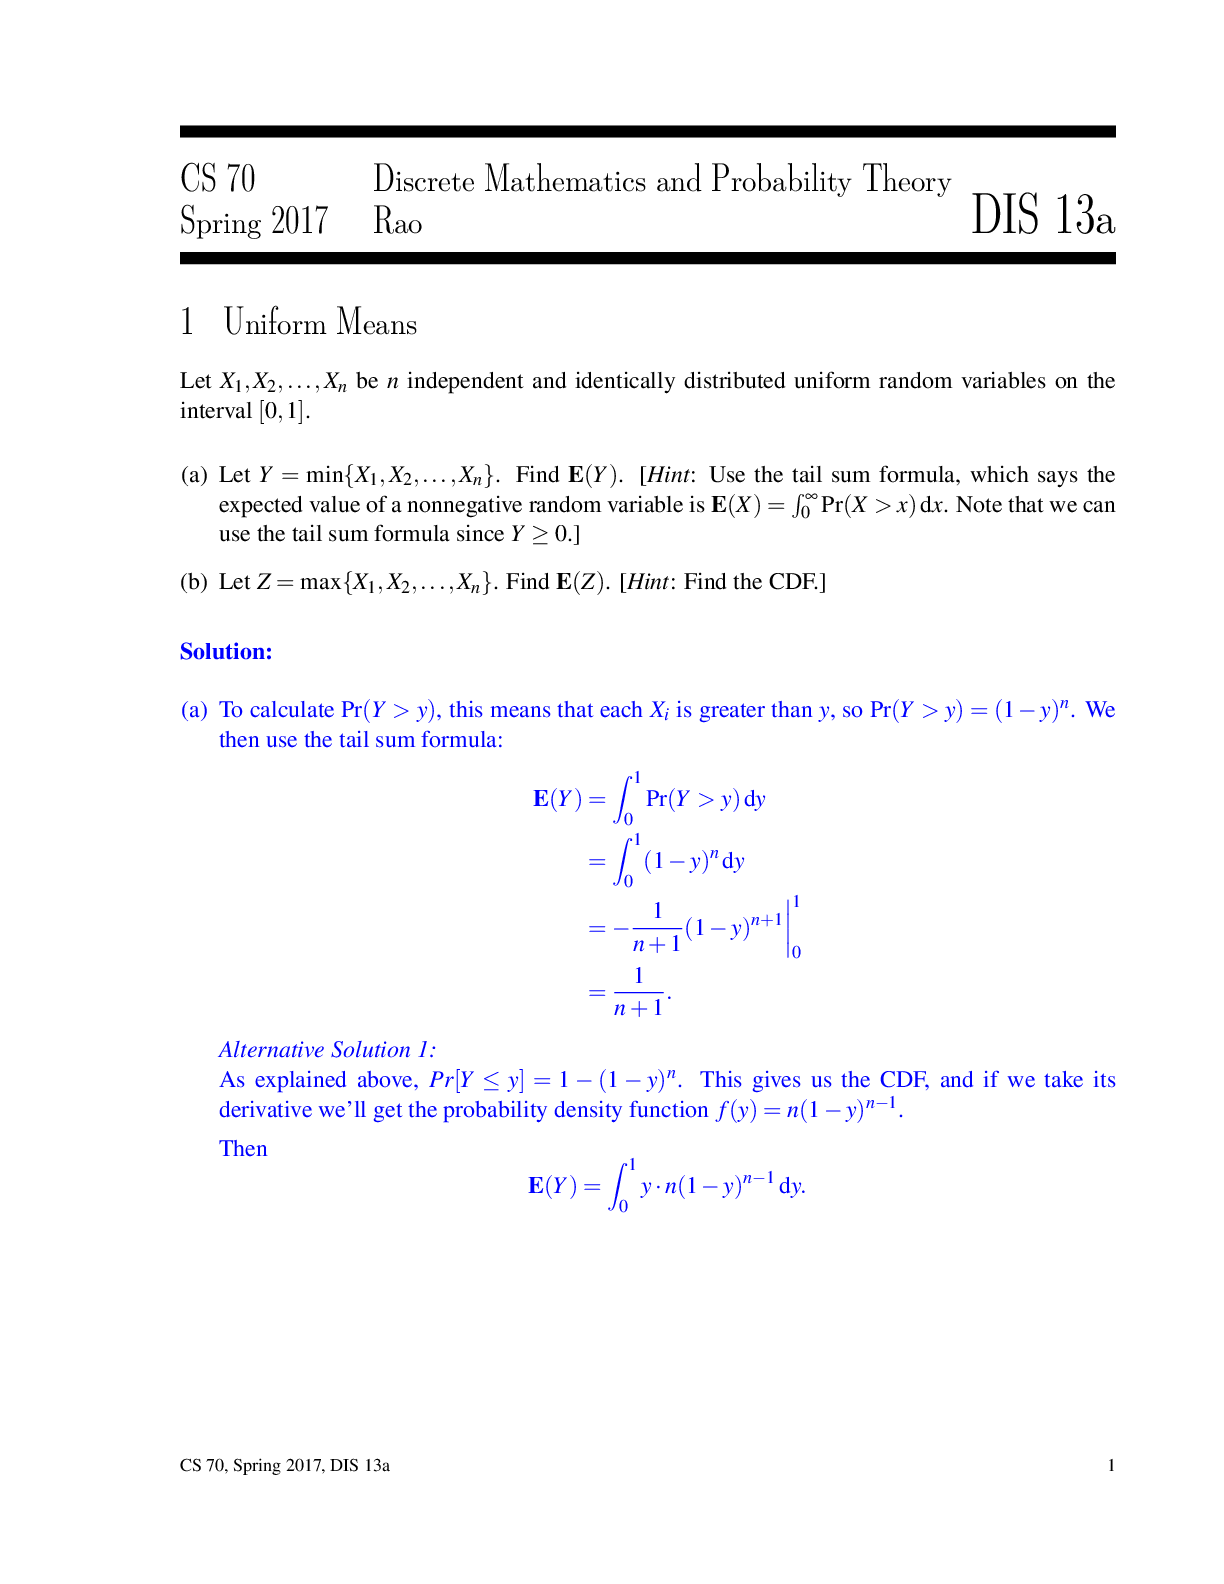
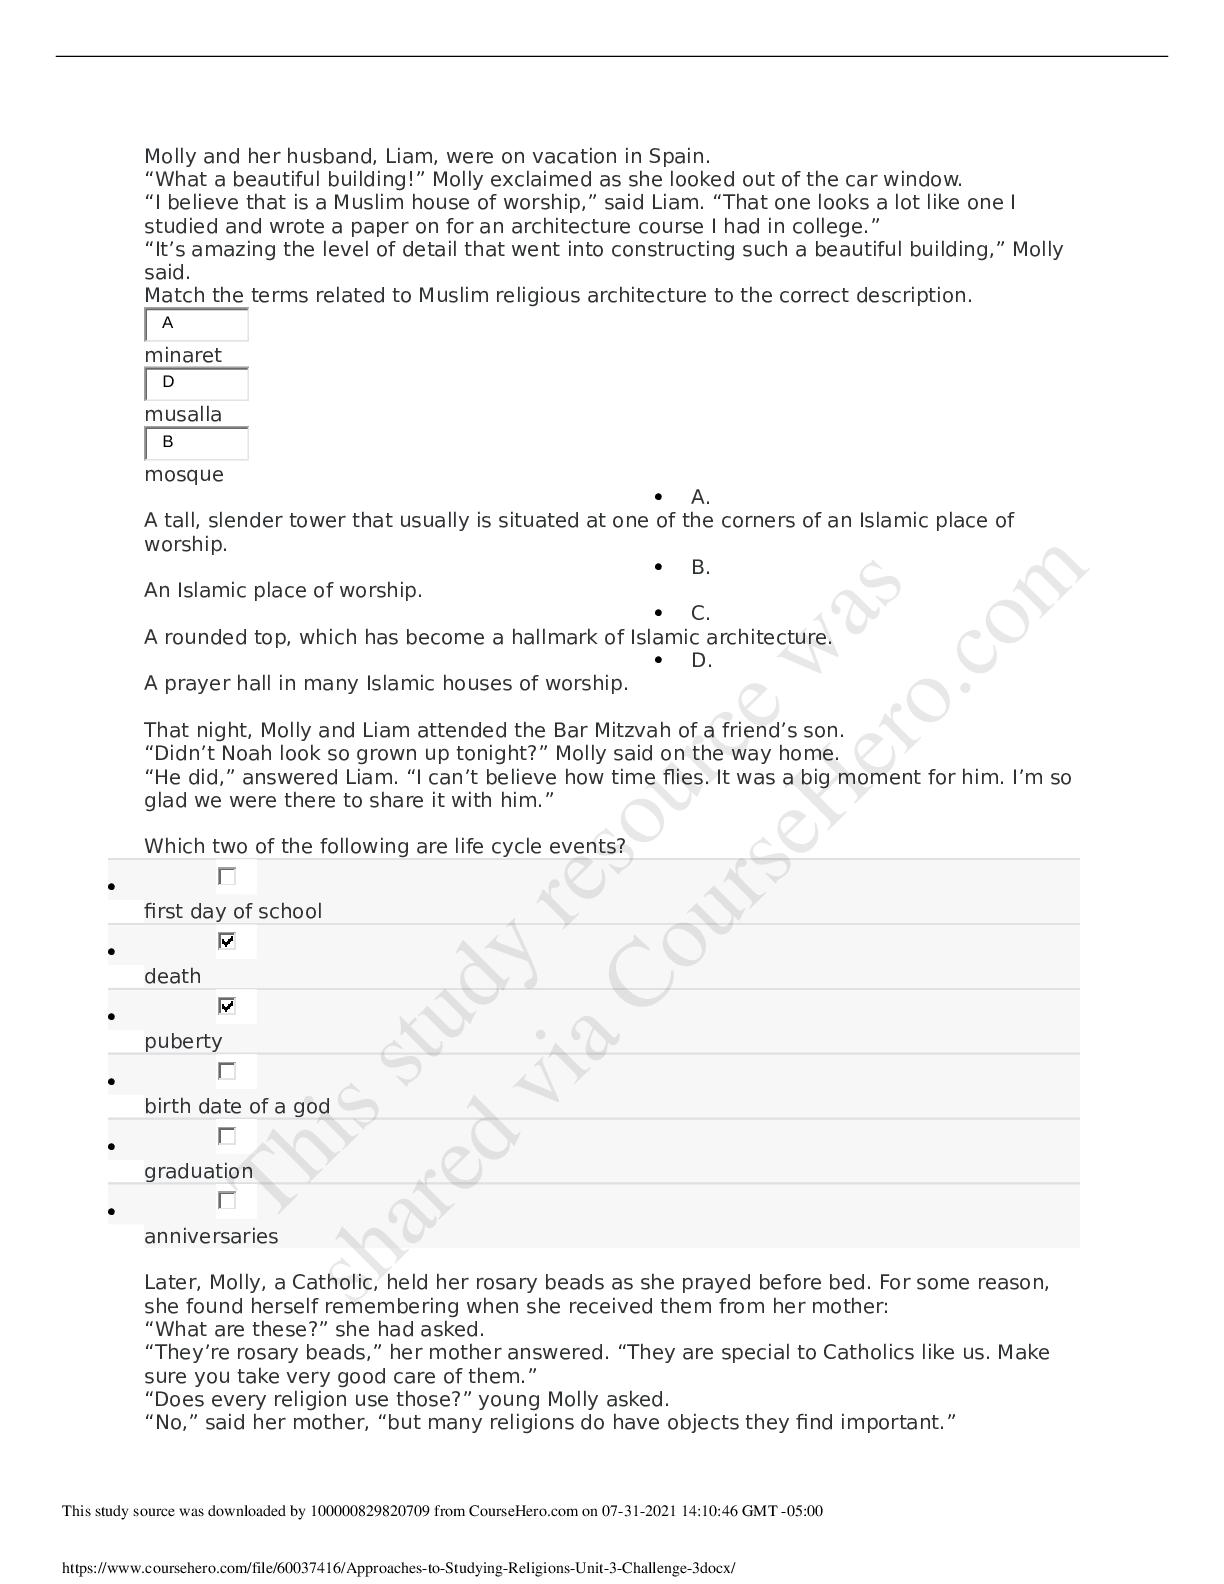
hw08 October 25, 2018 1 Homework 8: Confidence Intervals Reading: * Estimation Please complete this notebook by filling in the cells provided. Before you begin, execute the following cell to load... the provided tests. Each time you start your server, you will need to execute this cell again to load the tests. Homework 8 is due Thursday, 10/25 at 11:59pm. You will receive an early submission bonus point if you turn in your final submission by Wednesday, 10/24 at 11:59pm. Start early so that you can come to office hours if you’re stuck. Check the website for the office hours schedule. Late work will not be accepted as per the policies of this course. Directly sharing answers is not okay, but discussing problems with the course staff or with other students is encouraged. Refer to the policies page to learn more about how to learn cooperatively. For all problems that you must write our explanations and sentences for, you must provide your answer in the designated space. Moreover, throughout this homework and all future ones, please be sure to not re-assign variables throughout the notebook! For example, if you use max_temperature in your answer to one question, do not reassign it later on. In [27]: # Don't change this cell; just run it. import numpy as np from datascience import * # These lines do some fancy plotting magic. import matplotlib %matplotlib inline import matplotlib.pyplot as plt plt.style.use('fivethirtyeight') import warnings warnings.simplefilter('ignore', FutureWarning) from client.api.notebook import Notebook ok = Notebook('hw08.ok') _ = ok.auth(inline=True) ===================================================================== Assignment: Homework 8: Confidence Intervals 1OK, version v1.12.5 ===================================================================== Successfully logged in as [email protected] 1.1 1. Plot the Vote Four candidates are running for President of Dataland. A polling company surveys 1000 people selected uniformly at random from among voters in Dataland, and it asks each one who they are planning on voting for. After compiling the results, the polling company releases the following proportions from their sample: Candidate Proportion Candidate C 0.47 Candidate T 0.38 Candidate J 0.08 Candidate S 0.03 Undecided 0.04 These proportions represent a uniform random sample of the population of Dataland. We will attempt to estimate the corresponding population parameters, or the proportion of the votes that each candidate received from the entire population. We will use confidence intervals to compute a range of values that reflects the uncertainty of our estimate. The table votes contains the results of the survey. Candidates are represented by their initials. Undecided voters are denoted by U. In [28]: votes = Table().with_column('vote', np.array(['C']*470 + ['T']*380 + ['J']*80 + ['S']* num_votes = votes.num_rows votes.sample() Out[28]: vote TJCCSTCCCT ... (990 rows omitted) Question 1. Below, complete the given code that will use bootstrapped samples from votes to compute estimates of the true proportion of voters who are planning on voting for Candidate C. Make sure that you understand what’s going on here. It may be helpful to explain proportions_in_resamples to a friend or TA. 2In [37]: def proportions_in_resamples(): prop_c = make_array() for i in np.arange(5000): bootstrap = votes.sample() single_proportion = np.count_nonzero(bootstrap.column('vote') == 'C') / num_vo prop_c = np.append(prop_c, single_proportion) return prop_c In the following cell, we run the function you just defined, proportions_in_resamples, and create a histogram of the calculated statistic for the 5,000 bootstraps. Based on what the original polling proportions were, does the graph seem reasonable? Talk to a friend or ask a TA if you are unsure! In [38]: sampled_proportions = proportions_in_resamples() Table().with_column('Estimated Proportion', sampled_proportions).hist(bins=np.arange(0 3Question 2. Using the array sampled_proportions, find the values that bound the middle 95% of the values in the data. (Compute the lower and upper ends of the interval, named c_lower_bound and c_upper_bound, respectively.) [Show More]
Last updated: 1 year ago
Preview 1 out of 9 pages

Reviews( 0 )
Document information
Connected school, study & course
About the document
Uploaded On
Oct 02, 2022
Number of pages
9
Written in

Additional information
This document has been written for:
Uploaded
Oct 02, 2022
Downloads
0
Views
44


.png)