ENGLISH 101 IELTS Writing Task 1-(Simon IELTS)
Document Content and Description Below
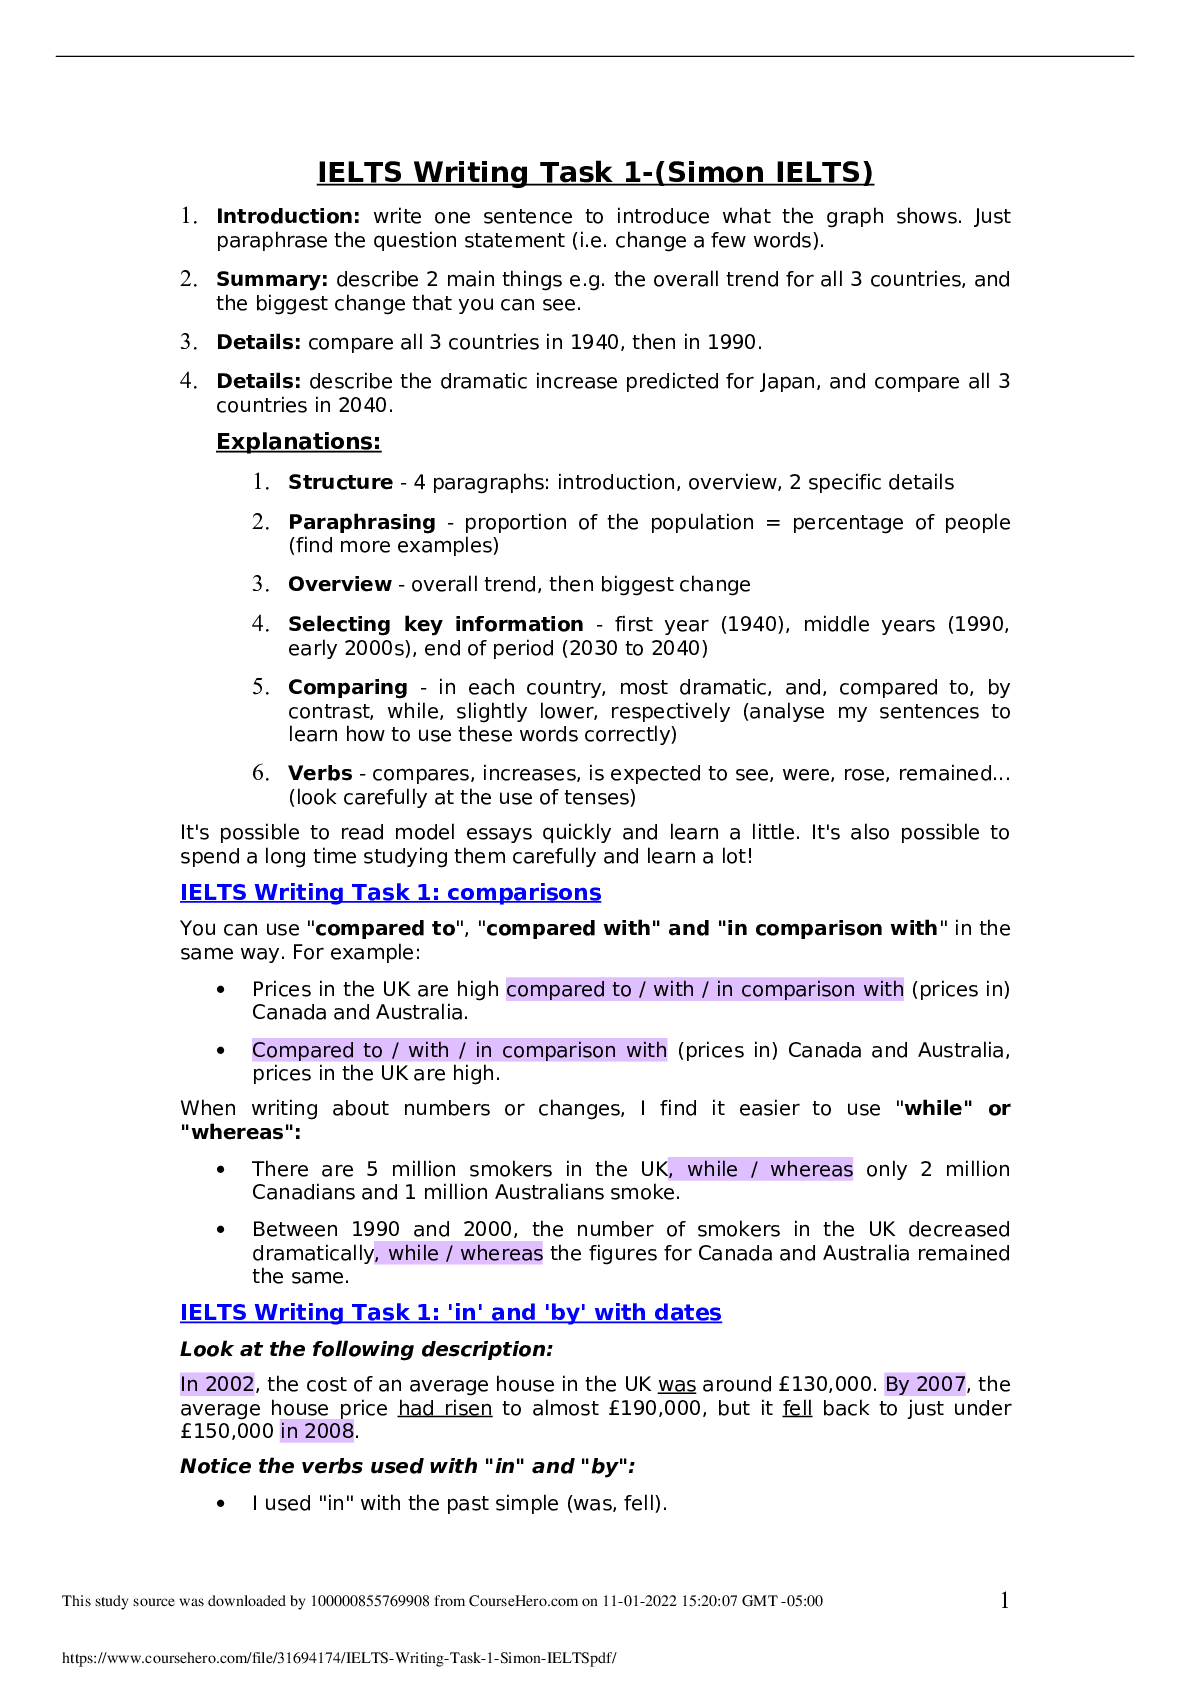
ENGLISH 101 IELTS Writing Task 1-(Simon IELTS) 1. Introduction: write one sentence to introduce what the graph shows. Just paraphrase the question statement (i.e. change a few words). 2. Summary... : describe 2 main things e.g. the overall trend for all 3 countries, and the biggest change that you can see. 3. Details: compare all 3 countries in 1940, then in 1990. 4. Details: describe the dramatic increase predicted for Japan, and compare all 3 countries in 2040. Explanations: 1. Structure - 4 paragraphs: introduction, overview, 2 specific details 2. Paraphrasing - proportion of the population = percentage of people (find more examples) 3. Overview - overall trend, then biggest change 4. Selecting key information - first year (1940), middle years (1990, early 2000s), end of period (2030 to 2040) 5. Comparing - in each country, most dramatic, and, compared to, by contrast, while, slightly lower, respectively (analyse my sentences to learn how to use these words correctly) 6. Verbs - compares, increases, is expected to see, were, rose, remained... (look carefully at the use of tenses) It's possible to read model essays quickly and learn a little. It's also possible to spend a long time studying them carefully and learn a lot! IELTS Writing Task 1: comparisons You can use "compared to", "compared with" and "in comparison with" in the same way. For example: Prices in the UK are high compared to / with / in comparison with (prices in) Canada and Australia. Compared to / with / in comparison with (prices in) Canada and Australia, prices in the UK are high. When writing about numbers or changes, I find it easier to use "while" or "whereas": There are 5 million smokers in the UK, while / whereas only 2 million Canadians and 1 million Australians smoke. Between 1990 and 2000, the number of smokers in the UK decreased dramatically, while / whereas the figures for Canada and Australia remained the same. IELTS Writing Task 1: 'in' and 'by' with dates Look at the following description: In 2002, the cost of an average house in the UK was around £130,000. By 2007, the average house price had risen to almost £190,000, but it fell back to just under £150,000 in 2008. Notice the verbs used with "in" and "by": I used "in" with the past simple (was, fell). I used "by" with the past perfect (had risen) to give the idea that the increase had happened in the years leading up to 2007. To avoid worrying about "by + past perfect" you could write: "Between 2002 and 2007, the average house price rose to..." IELTS Writing Task 1: to, by, with, at Several people have asked me to explain how to use to, by, with and at when describing numbers. Here are some examples to give you a basic idea of the differences: 1) Use to when describing what happened to the number: In 2008, the rate of unemployment rose to 10%. 2) Use by when describing the amount of change between two numbers: In 2009, the rate of unemployment fell by 2% (from 10% to 8%). 3) Use with to give the idea of 'having' the number: Obama won the election with 52% of the vote. 4) Use at to add the number on the end of a sentence: Unemployment reached its highest level in 2008, at 10%. IELTS Writing Task 1: paraphrasing The easiest way to start your Task 1 essay is by paraphrasing the question. Paraphrasing means writing something in a different way (using your own words). Here are some simple changes you can make: graph = line graph chart = bar chart diagram = figure shows = illustrates (or 'compares' if the graph is comparing) proportion = percentage information = data the number of = the figure for the proportion of = the figure for people in the USA = Americans from 1999 to 2009 = between 1999 and 2009 from 1999 to 2009 = over a period of 10 years how to produce = the process of producing in three countries = in the UK, France and Spain (i.e. name the countries) Tip: "The figure for / figures for" is a great phrase that not many people use (e.g. the graph shows figures for unemployment in three countries). I'll change 3 elements of this sentence: 1. table shows = bar chart compares 2. figures for imprisonment = number of people in prison 3. between... and... = over a period of So, here's my paraphrased introduction: Here's my introduction and overview: The picture illustrates the process of coffee manufacture and preparation for sale on the market. It is clear that there are 11 stages in the production of coffee. The process begins with the picking of coffee beans, and ends at the packing stage. [Show More]
Last updated: 1 year ago
Preview 1 out of 8 pages
Reviews( 0 )
Document information
Connected school, study & course
About the document
Uploaded On
Nov 02, 2022
Number of pages
8
Written in
Additional information
This document has been written for:
Uploaded
Nov 02, 2022
Downloads
0
Views
75

