Student Exploration: Earthquakes 1 – Recording Station GIZMO
Document Content and Description Below
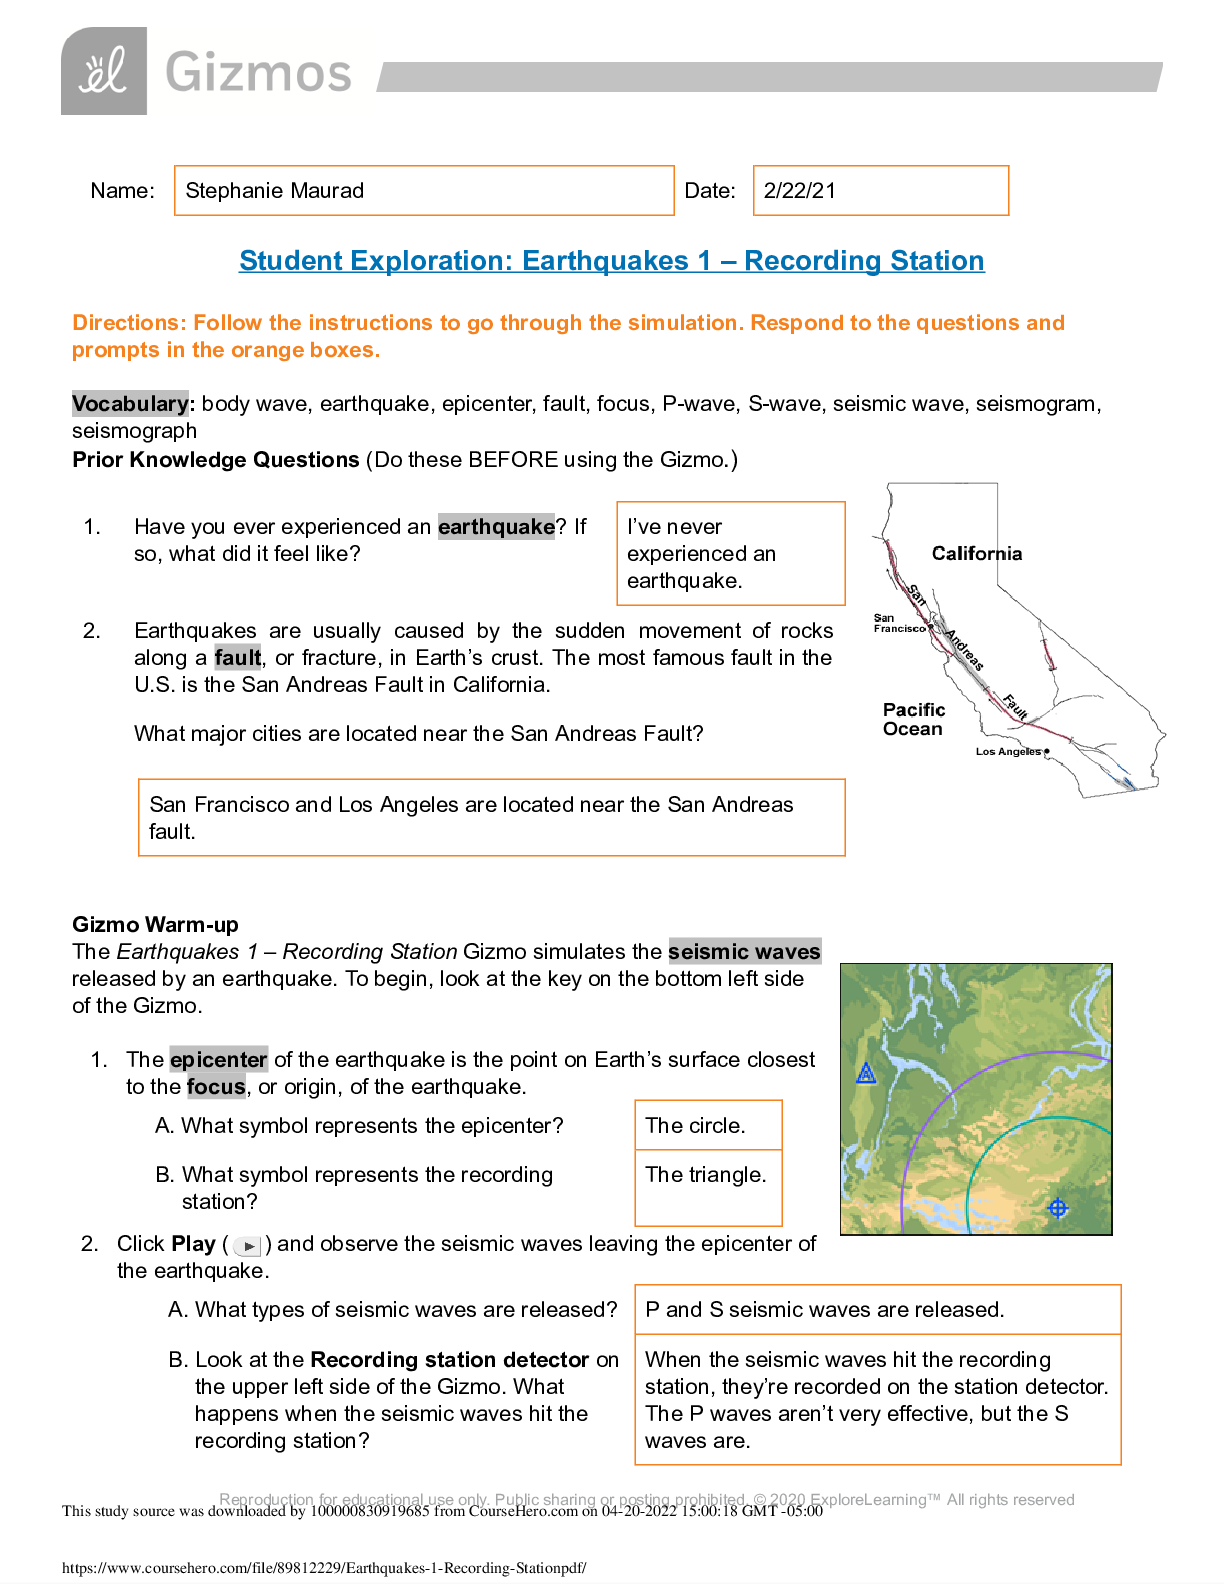
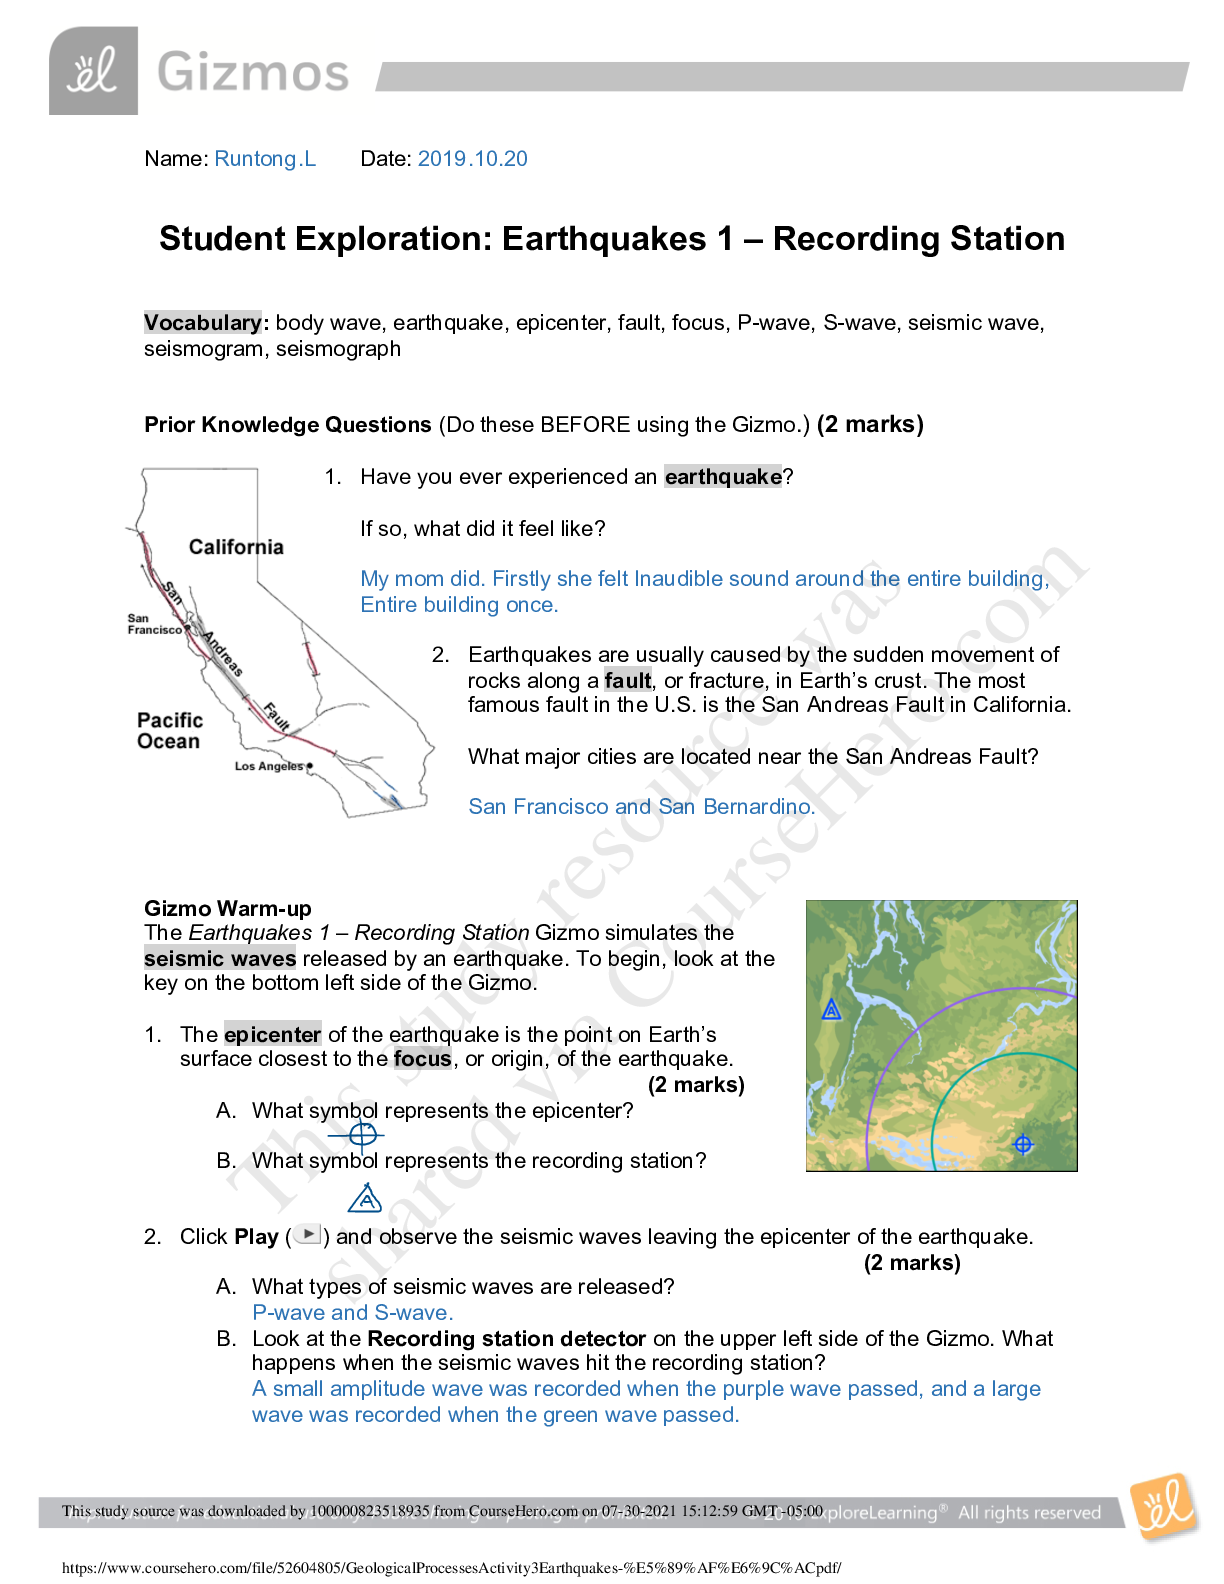
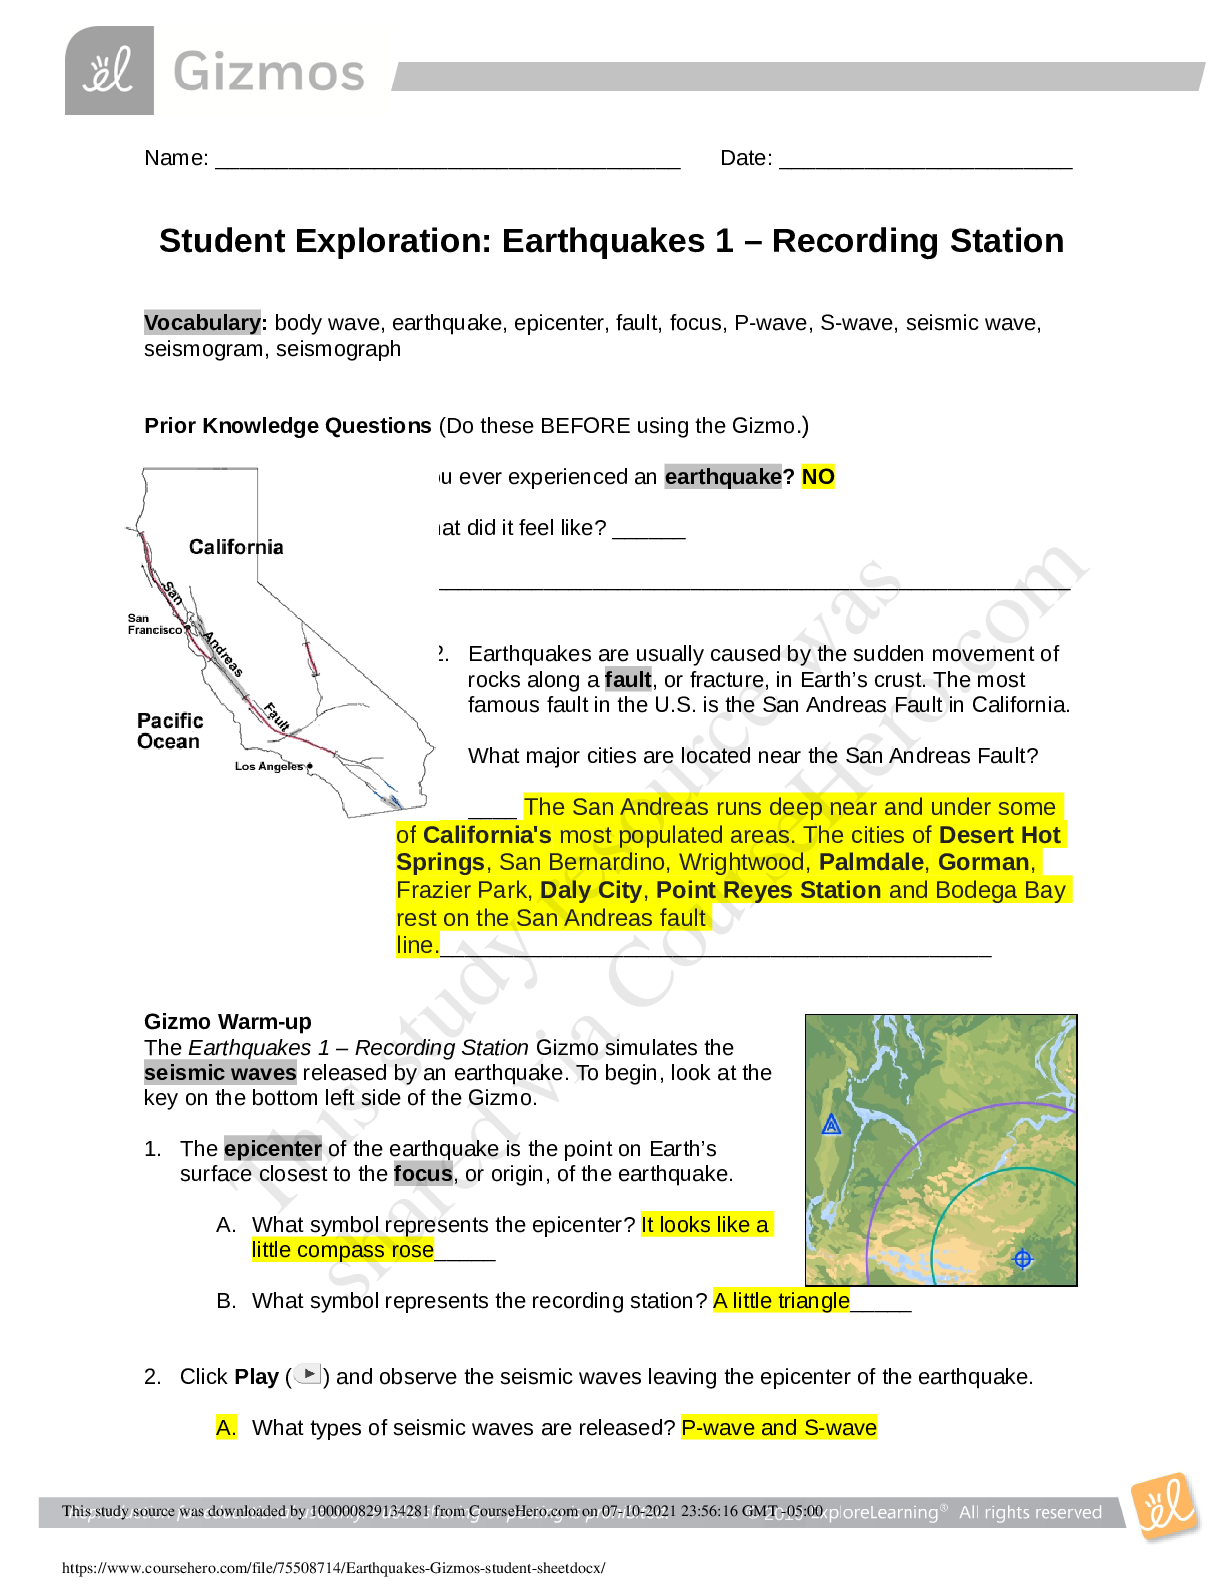
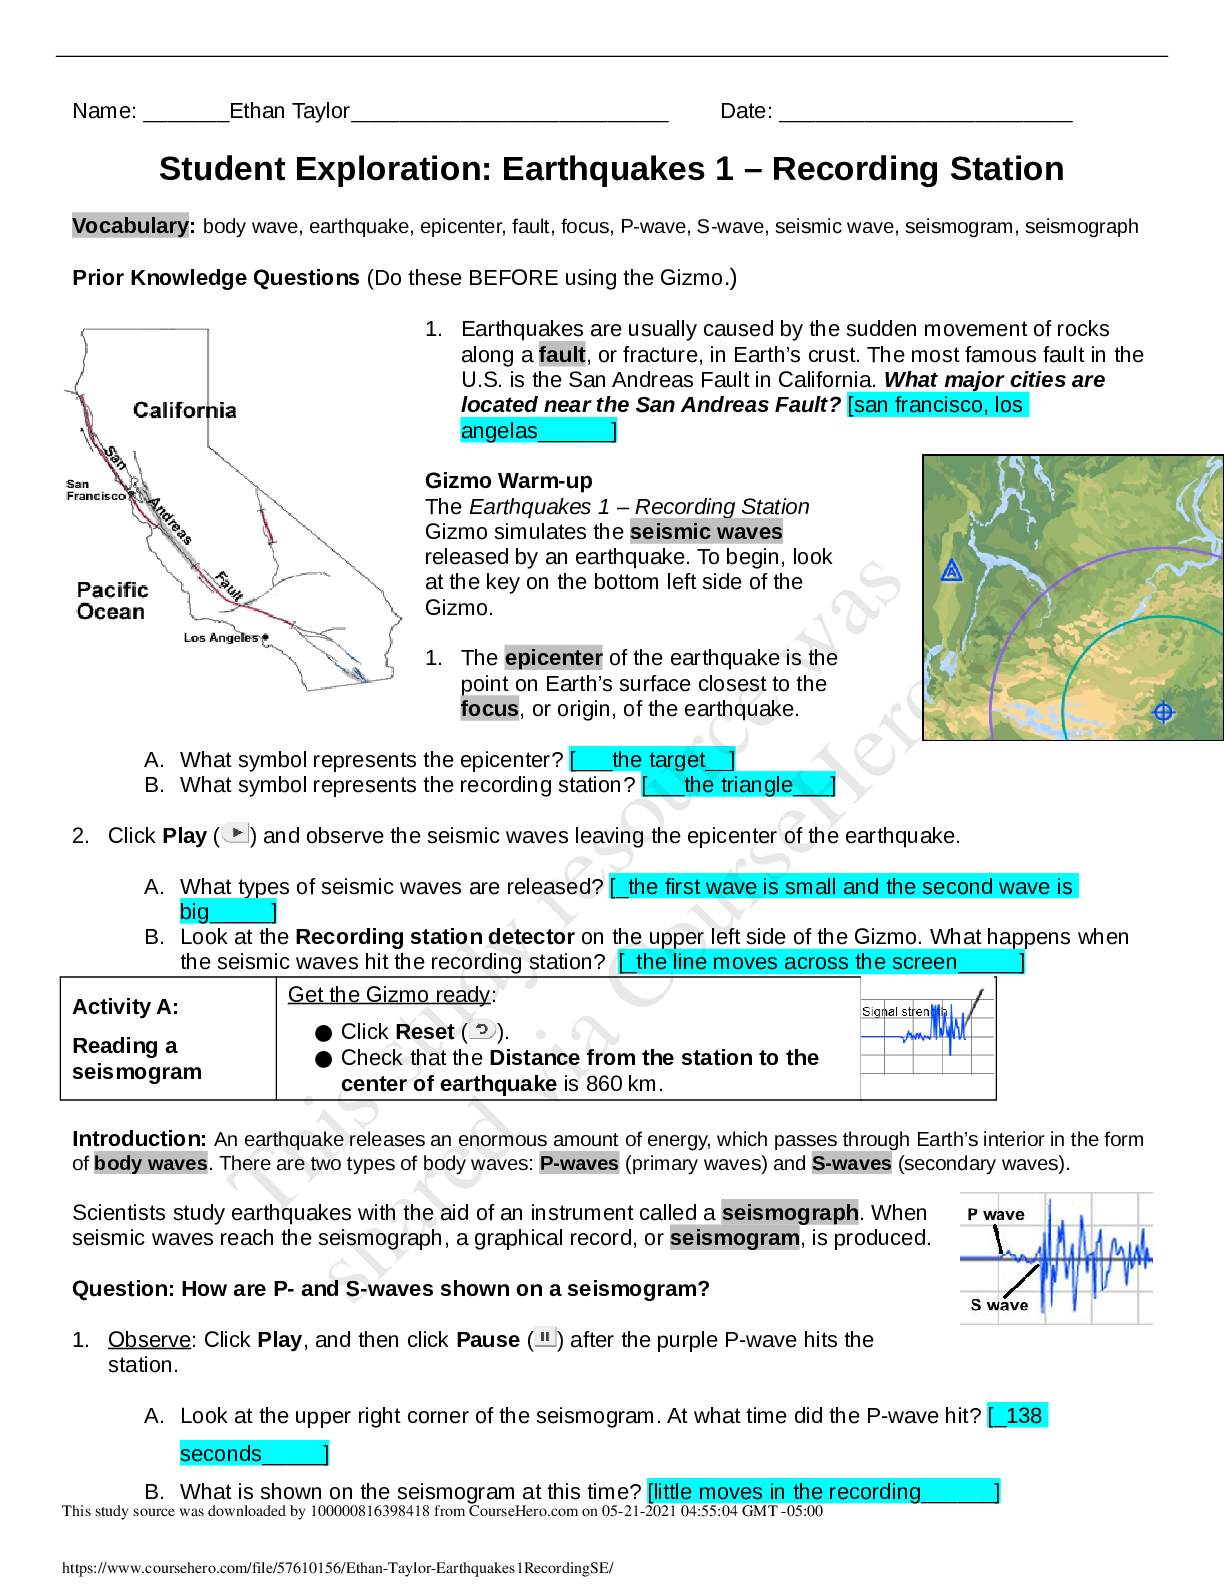
Student Exploration: Earthquakes 1 – Recording Station Vocabulary: body wave, earthquake, epicenter, fault, focus, P-wave, S-wave, seismic wave, seismogram, seismograph Prior Knowledge Questions (... Do these BEFORE using the Gizmo.) 1. Earthquakes are usually caused by the sudden movement of rocks along a fault, or fracture, in Earth’s crust. The most famous fault in the U.S. is the San Andreas Fault in California. What major cities are located near the San Andreas Fault? [san francisco, los angelas______] Gizmo Warm-up The Earthquakes 1 – Recording Station Gizmo simulates the seismic waves released by an earthquake. To begin, look at the key on the bottom left side of the Gizmo. 1. The epicenter of the earthquake is the point on Earth’s surface closest to the focus, or origin, of the earthquake. A. What symbol represents the epicenter? [___the target__] B. What symbol represents the recording station? [___the triangle___] 2. Click Play ( ) and observe the seismic waves leaving the epicenter of the earthquake. A. What types of seismic waves are released? [_the first wave is small and the second wave is big_____] B. Look at the Recording station detector on the upper left side of the Gizmo. What happens when the seismic waves hit the recording station? [_the line moves across the screen_____] Activity A: Reading a seismogram Get the Gizmo ready: ● Click Reset ( ). ● Check that the Distance from the station to the center of earthquake is 860 km. Introduction: An earthquake releases an enormous amount of energy, which passes through Earth’s interior in the form of body waves. There are two types of body waves: P-waves (primary waves) and S-waves (secondary waves). Scientists study earthquakes with the aid of an instrument called a seismograph. When seismic waves reach the seismograph, a graphical record, or seismogram, is produced. Question: How are P- and S-waves shown on a seismogram? 1. Observe: Click Play, and then click Pause ( ) after the purple P-wave hits the station. A. Look at the upper right corner of the seismogram. At what time did the P-wave hit? [_138 seconds_____ [Show More]
Last updated: 1 year ago
Preview 1 out of 3 pages
Reviews( 0 )
Document information
Connected school, study & course
About the document
Uploaded On
May 21, 2021
Number of pages
3
Written in

Additional information
This document has been written for:
Uploaded
May 21, 2021
Downloads
1
Views
472