Mathematics > EXAM > Math 302 Knowledge Test 1 Questions And Answers( Complete Solution) (All)
Math 302 Knowledge Test 1 Questions And Answers( Complete Solution)
Document Content and Description Below
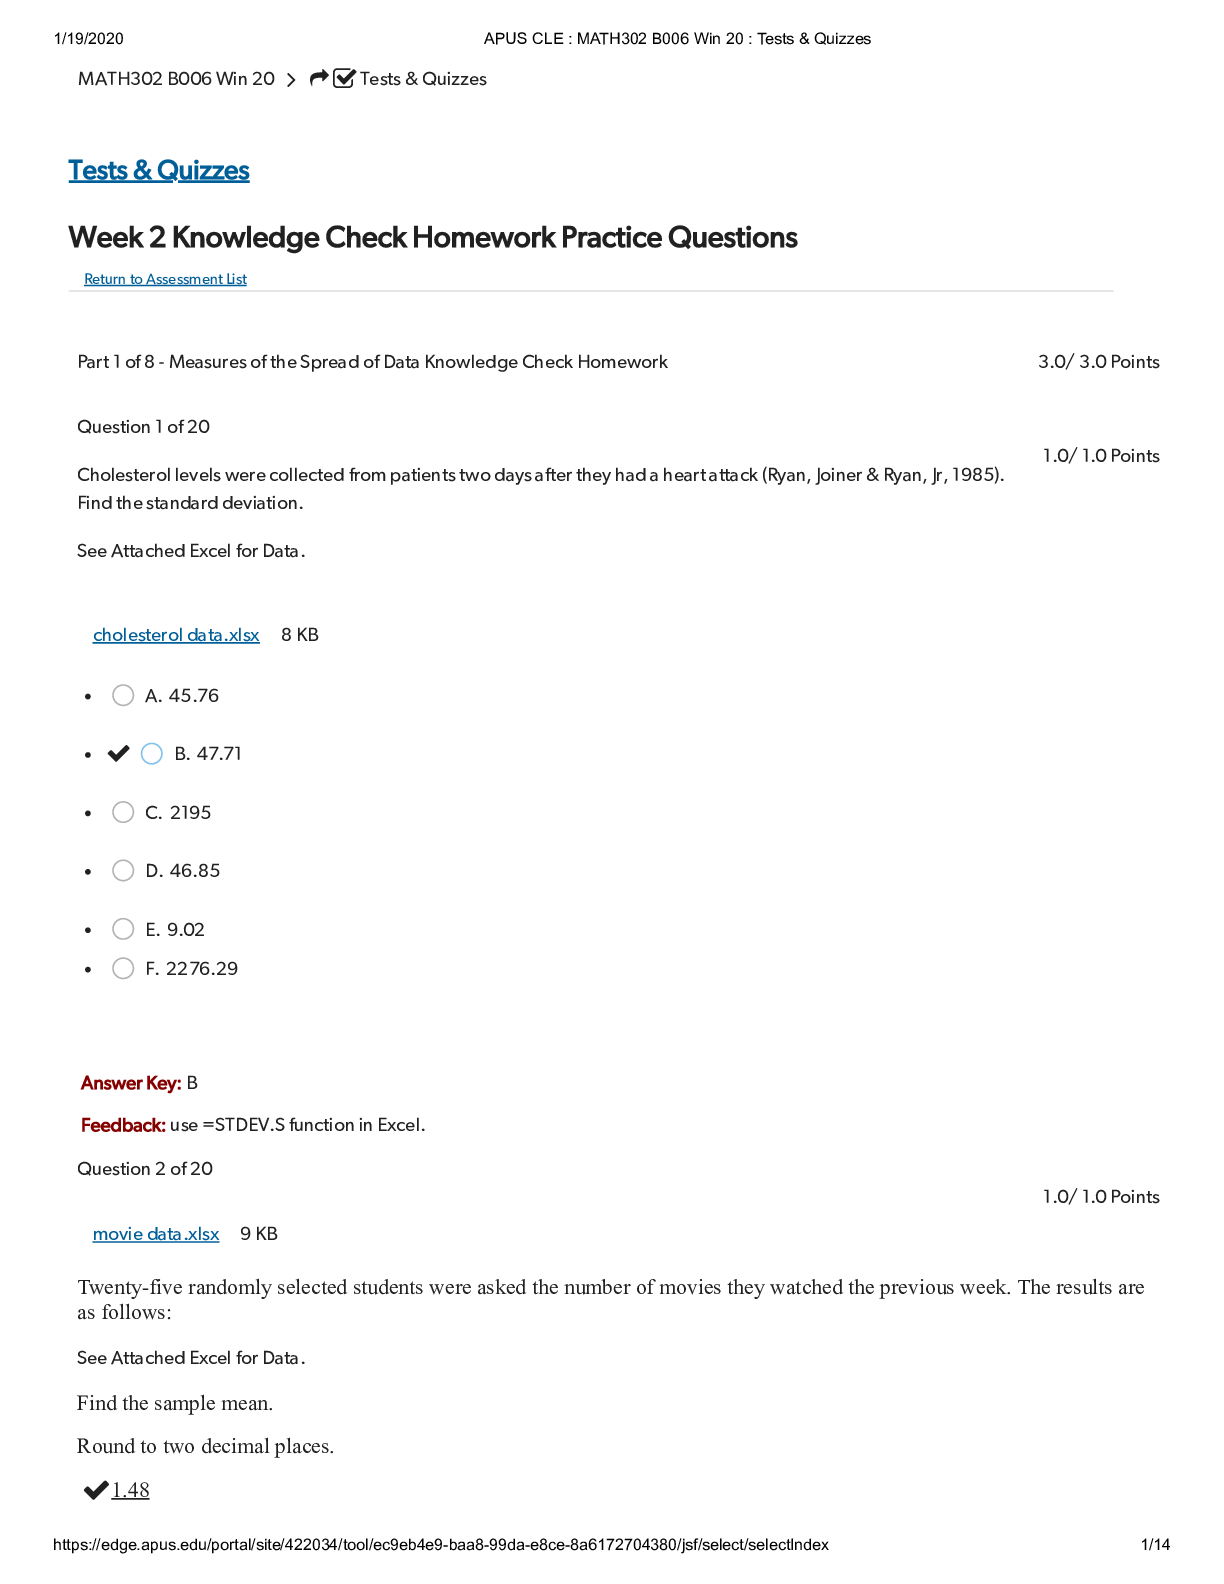
1/19/2020 APUS CLE : MATH302 B006 Win 20 : Tests & Quizzes https://edge.apus.edu/portal/site/422034/tool/ec9eb4e9-baa8-99da-e8ce-8a6172704380/jsf/select/selectIndex 1/14 1.0/ 1.0 Points 1.0/ 1.0 Po... ints Week 2 Knowledge Check Homework Practice Questions Return to Assessment List Part 1 of 8 - Measures of the Spread of Data Knowledge Check Homework 3.0/ 3.0 Points Question 1 of 20 Cholesterol levels were collected from patients two days after they had a heart attack (Ryan, Joiner & Ryan, Jr, 1985). Find the standard deviation. See Attached Excel for Data. cholesterol data.xlsx 8 KB A. 45.76 B. 47.71 C. 2195 D. 46.85 E. 9.02 F. 2276.29 Answer Key: B Feedback: use =STDEV.S function in Excel. Question 2 of 20 movie data.xlsx 9 KB Twenty-five randomly selected students were asked the number of movies they watched the previous week. The results are as follows: See Attached Excel for Data. Find the sample mean. Round to two decimal places. 1.48 MATH302 B006 Win 20 Tests & Quizzes Tests & Quizzes 1/19/2020 APUS CLE : MATH302 B006 Win 20 : Tests & Quizzes https://edge.apus.edu/portal/site/422034/tool/ec9eb4e9-baa8-99da-e8ce-8a6172704380/jsf/select/selectIndex 2/14 1.0/ 1.0 Points 1.0/ 1.0 Points Answer Key: 1.48 Feedback: use =AVERAGE function in Excel. Question 3 of 20 FTES data.xlsx 8 KB The population FTES for 2005–2006 through 2010–2011 was given in an updated report. The data are reported here. See Attached Excel for Data. Standard Deviation: 167 Calculate the standard deviation. Round to one decimal place. Answer Key: 167.0| 167 Feedback: use =STDEV.S function in Excel. Part 2 of 8 - Box Plot Knowledge Check Homework Practice 2.0/ 2.0 Points Question 4 of 20 A survey was conducted of 130 purchasers of new BMW 3 series cars, 130 purchasers of new BMW 5 series cars, and 130 purchasers of new BMW 7 series cars. In it, people were asked the age they were when they purchased their car. The following box plots display the results. What is the interquartile range for the BMW 5 Series? A. about 32 years B. about 17 years 1/19/2020 APUS CLE : MATH302 B006 Win 20 : Tests & Quizzes https://edge.apus.edu/portal/site/422034/tool/ec9eb4e9-baa8-99da-e8ce-8a6172704380/jsf/select/selectIndex 3/14 1.0/ 1.0 Points 0.0/ 1.0 Points C. about 42 years D. about 63 years Answer Key: B Feedback: IQR = Q3 - Q1 Q3 = 55 and Q1 is roughly 38. Question 5 of 20 For a boxplot, the vertical line inside the box indicates the location of the A. median B. mode C. mean D. inter quartile range Answer Key: A Feedback: The Median is also known as Q2 or the second quartile value. Part 3 of 8 - Displaying Data Knowledge Check Homework Practice 1.0/ 2.0 Points Question 6 of 20 The following data represents the percent change in tuition levels at public, four-year colleges (inflation adjusted) from 2008 to 2013 (Weissmann, 2013). Below is the frequency distribution and histogram. Percentage Change in Tuition Levels histogram Class Limits Class Midpoint Frequency Relative Frequency 2.2 – 11.7 6.95 6 0.12 11.8 – 21.3 16.55 20 0.40 21.4 – 30.9 26.15 11 0.22 31.0 – 40.5 35.75 4 0.08 40.6 – 50.1 45.35 2 0.04 50.2 – 59.7 54.95 2 0.04 59.8 – 69.3 64.55 3 0.06 69.4 – 78.9 74.15 2 0.04 What was the approximate value of the most frequent change in tuition? 1/19/2020 APUS CLE : MATH302 B006 Win 20 : Tests & Quizzes https://edge.apus.edu/portal/site/422034/tool/ec9eb4e9-baa8-99da-e8ce-8a6172704380/jsf/select/selectIndex 4/14 1.0/ 1.0 Points A. 74.15 B. 20 C. 16.55 D. 78 E. 0.40 Answer Key: C Feedback: This has the highest frequency and relative frequency Question 7 of 20 The following data represents the grades in a statistics course. Below is the frequency distribution and histogram. 1/19/2020 APUS CLE : MATH302 B006 Win 20 : Tests & Quizzes https://edge.apus.edu/portal/site/422034/tool/ec9eb4e9-baa8-99da-e8ce-8a6172704380/jsf/select/selectIndex 5/14 Class Limit Class Midpoint Frequency Relative Frequency 40 – 49.9 45 2 0.08 50 – 59.9 55 1 0.04 60 – 69.9 65 7 0.28 70 – 79.9 75 6 0.24 80 – 89.9 85 7 0.28 90 – 99.9 95 2 0.04 1/19/2020 APUS CLE : MATH302 B006 Win 20 : Tests & Quizzes https://edge.apus.edu/portal/site/422034/tool/ec9eb4e9-baa8-99da-e8ce-8a6172704380/jsf/select/selectIndex 6/14 1.0/ 1.0 Points 1.0/ 1.0 Points What was the approximate lowest and highest grade in the class? A. 4 and 28 B. 40 and 100 C. 65 and 85 D. 40 and 99.9 E. 45 and 95 Answer Key: D Feedback: Lowest value is 40 and the highest value in the Class Limit is 99.9 Part 4 of 8 - Measures of Central Tendency Knowledge Check Homework Practice 3.0/ 4.0 Points Question 8 of 20 Cholesterol levels were collected from patients two days after they had a heart attack (Ryan, Joiner & Ryan, Jr, 1985). Find the mean. Round to 4 decimal places. See Attached Excel for Data. cholesterol data.xlsx 8 KB A. 235.2593 B. 253.9286 C. 268 D. 248.3245 E. 236 Answer Key: B Feedback: use =AVERAGE function in Excel Question 9 of 20 The following data show the amount (in ounces) of beverage in randomly selected 16-ounce beverage cans. See Attached Excel for Data. 1/19/2020 APUS CLE : MATH302 B006 Win 20 : Tests & Quizzes https://edge.apus.edu/portal/site/422034/tool/ec9eb4e9-baa8-99da-e8ce-8a6172704380/jsf/select/selectIndex 7/14 1.0/ 1.0 Points 0.0/ 1.0 Points The mode of this data is ounces data.xlsx 8 KB A. no mode B. 16.1 C. 15.7 D. 15.8 E. 15.6 Answer Key: C Feedback: The value that appears most often is 15.7 Question 10 of 20 boat length data.xlsx 8 KB The following data show the lengths of boats moored in a marina. The data are ordered from smallest to largest. See Attached Excel for Data Identify the Median. 27 Answer Key: 27|27.0 Feedback: Use =MEDIAN function in Excel. Question 11 of 20 The following histogram shows the distribution percent return on stocks from 1971-2010. The shape of this distribution is: 1/19/2020 APUS CLE : MATH302 B006 Win 20 : Tests & Quizzes https://edge.apus.edu/portal/site/422034/tool/ec9eb4e9-baa8-99da-e8ce-8a6172704380/jsf/select/selectIndex 8/14 0.0/ 1.0 Points 0.0/ 1.0 Points (source: http://www.softschools.com/math/probability_and_statistics/shapes_of_distributions/) A. right skewed (skewed positive) B. symmetric C. left skewed (skewed negative) Answer Key: C Part 5 of 8 - Measures of the Location of Data Knowledge Check Homework Practice 1.0/ 3.0 Points Question 12 of 20 age data.xlsx 8 KB Listed are 29 ages for Academy Award-winning best actors in order from smallest to largest. See Attached Excel for Data. Find the 78th percentile. Round one decimal place. 69.8 years Hint: Use =PERCENTILE.INC function in Excel or use textbook formula (n+1)p/100. Answer Key: 68.7 Feedback: use =PERCENTILE.INC( , .78) in Excel. Question 13 of 20 height data.xlsx 8 KB 1/19/2020 APUS CLE : MATH302 B006 Win 20 : Tests & Quizzes https://edge.apus.edu/portal/site/422034/tool/ec9eb4e9-baa8-99da-e8ce-8a6172704380/jsf/select/selectIndex 9/14 1.0/ 1.0 Points 0.0/ 1.0 Points The following data show the height (inches) of a sample of students. See Attached Excel for Data. The 1st quartile of heights of these students is 62.25 inches. Using the information in the chart, fill in the blank below. Round to two decimal places. Answer Key: 62.75 Feedback: Use =QUARTILE.INC( , 1) in Excel. Question 14 of 20 The difference between the first and third quartile is called the A. unimodal range B. interquartile range C. mid range D. interdependent range Answer Key: B Feedback: IQR is the InterQuartile Range Part 6 of 8 - Ogives, Pareto and Pie Chart Knowledge Check Homework 1.0/ 2.0 Points Question 15 of 20 The following data represents the percent change in tuition levels at public, four-year colleges (inflation adjusted) from 2008 to 2013 (Weissmann, 2013). Below is the frequency distribution and ogive. 1/19/2020 APUS CLE : MATH302 B006 Win 20 : Tests & Quizzes https://edge.apus.edu/portal/site/422034/tool/ec9eb4e9-baa8-99da-e8ce-8a6172704380/jsf/select/selectIndex 10/14 Class Limits Cumulative Frequency 2.2 – 11.7 6 11.8 – 21.3 26 21.4 – 30.9 37 31.0 – 40.5 41 40.6 – 50.1 43 50.2 – 59.7 45 59.8 – 69.3 48 1/19/2020 APUS CLE : MATH302 B006 Win 20 : Tests & Quizzes https://edge.apus.edu/portal/site/422034/tool/ec9eb4e9-baa8-99da-e8ce-8a6172704380/jsf/select/selectIndex 11/14 1.0/ 1.0 Points 69.4 – 78.9 50 Based on the information, how many colleges had a percent change in tuition below 50.2%? A. 45 B. 37 C. 43 D. 80 Answer Key: C Feedback: The Class Limit of 40.6 - 50.1 has a cumulative frequency value of 43. The next class limit starts at 50.2. Question 16 of 20 The following graph represents a random sample of car models driven by college students. What percent of college students drove a Nissan? A. 24% B. 20% 1/19/2020 APUS CLE : MATH302 B006 Win 20 : Tests & Quizzes https://edge.apus.edu/portal/site/422034/tool/ec9eb4e9-baa8-99da-e8ce-8a6172704380/jsf/select/selectIndex 12/14 1.0/ 1.0 Points C. 10% D. 40% E. 12% Answer Key: B Part 7 of 8 - Scatter Plots Knowledge Check Homework 1.0/ 2.0 Points Question 17 of 20 A survey by the Pew Research Center, conducted in 16 countries among 20,132 respondents from April 4 to May 29, 2016, before the United Kingdom's so-called Brexit referendum to exit the EU. The following is a time series graph for the proportion of survey respondents by country that responded that the current economic situation is their country was good. Which country had the least favorable outlook of their country's economic situation in 2016? Graph source:http://www.pewglobal.org/2016/08/09/views-on-national-economies-mixed-as-many-countries-continue-tostruggle/ A. Greece B. UK C. Spain D. Italy E. Poland F. France G. Germany 1/19/2020 APUS CLE : MATH302 B006 Win 20 : Tests & Quizzes https://edge.apus.edu/portal/site/422034/tool/ec9eb4e9-baa8-99da-e8ce-8a6172704380/jsf/select/selectIndex 13/14 0.0/ 1.0 Points 0.0/ 1.0 Points 0.0/ 1.0 Points Answer Key: A Feedback: In 2016 Greece has the lowest peak Question 18 of 20 A scatterplot allows one to see: A. whether there is any relationship between two variables B. what type of relationship there is between two variables C. Both (a) and (b) are correct D. Neither (a) nor (b) is correct Answer Key: C Part 8 of 8 - Stem and Leaf Knowledge Check Practice 0.0/ 2.0 Points Question 19 of 20 The following data show the amount (in ounces) of beverage in randomly selected 16-ounce beverage cans. Create a Stem-Leaf plot for these data. 15.8 16.1 15.2 14.8 15.8 15.9 16.0 15.5 16.1 15.7 Fill in the blanks of table below to complete the Stem-Leaf plot for these data. The key is 15|2 = 15.2. Sort the values for Stem and do not keep spaces or commas between leaves. Stem Leaf 15.5 8 257889 011 Answer Key: 14, 15, 16 Question 20 of 20 The following data show the amount (in ounces) of beverage in randomly selected 16-ounce beverage cans. Create a Stem-Leaf plot for these data. The key is 15|2 = 15.2. 15.8 16.1 15.2 14.8 15.8 15.9 16.0 15.5 16.1 15.7 1/19/2020 APUS CLE : MATH302 B006 Win 20 : Tests & Quizzes https://edge.apus.edu/portal/site/422034/tool/ec9eb4e9-baa8-99da-e8ce-8a6172704380/jsf/select/selectIndex 14/14 Using information from the plot you’ve developed, answer the following two questions. If rounding is necessary, round to one decimal place. 1. What is the minimum observed amount (in ounces) of beverage in a can? 2. In your Stem-Leaf plot, what is the maximum Stem data value? Answer Key: 14.8, 16|16.1 Powered by Sakai Copyright 2003-2020 The Apereo Foundation. All rights reserved. Portions of Sakai are copyrighted by other parties as described in the Acknowledgments screen. [Show More]
Last updated: 1 year ago
Preview 1 out of 14 pages
Buy this document to get the full access instantly
Instant Download Access after purchase
Add to cartInstant download
We Accept:

Reviews( 0 )
$15.00
Document information
Connected school, study & course
About the document
Uploaded On
Aug 12, 2021
Number of pages
14
Written in

Additional information
This document has been written for:
Uploaded
Aug 12, 2021
Downloads
0
Views
40
.png)