Marketing > STUDY GUIDE > University of Phoenix QNT 561QNT 561 - Signature Assignment (All)
University of Phoenix QNT 561QNT 561 - Signature Assignment
Document Content and Description Below
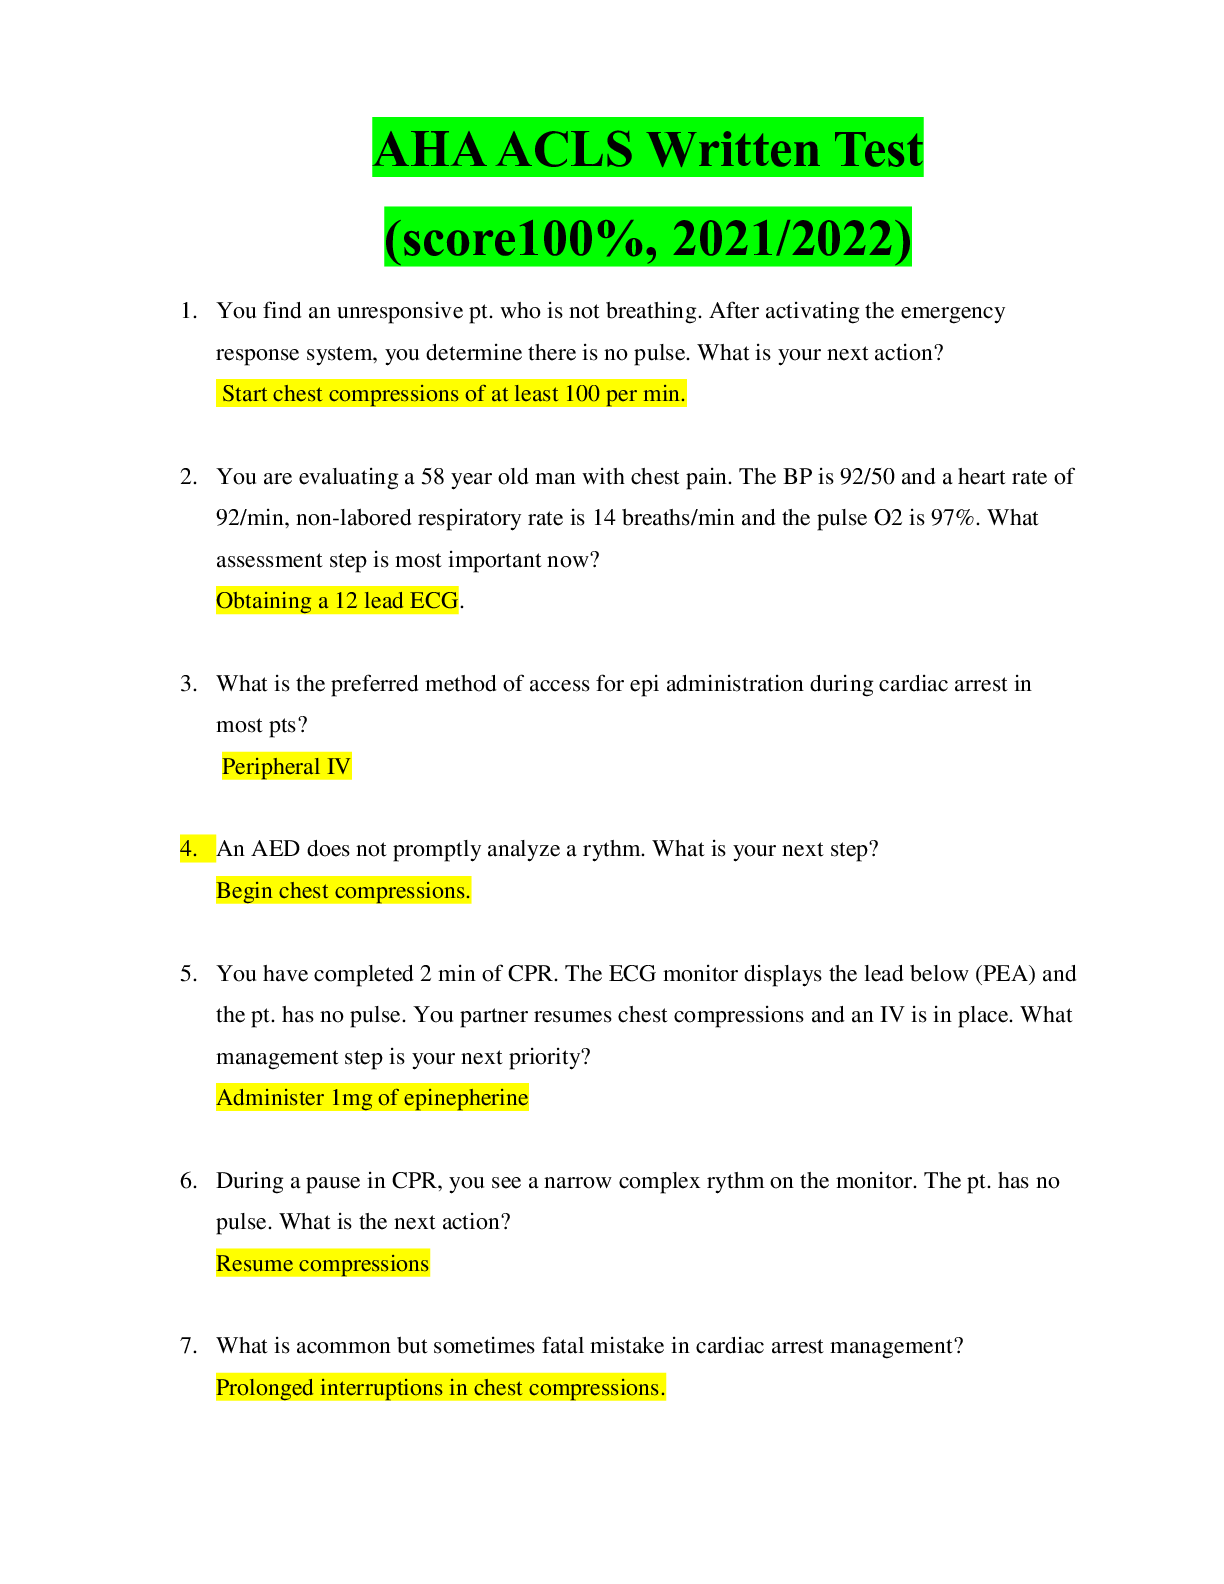
Part 1: Preliminary Analysis This purpose of this study is to determine the average census for hospitals in the US, as well as to determine the types of hospital ownership, proportions of general me... dical and psychiatric hospitals and to determine the number of births and average number of employed personnel in an average hospital in the US. The following questions addressed in this study are as follows: • What is the average census for an average hospital in the US? • What are the main types of hospital ownerships in the US? • What are the proportions of general medical and psychiatric hospital? • What is the average number of births in an average hospital in the US? • What is the average number of personnel employed by an average hospital in the US? The population in the study includes all general medical and psychiatric hospitals from (7) seven selected areas in the United States. The (7) seven areas are California, South, Southeast, Northeast, Northwest, Midwest, and Rocky Mountain. The sample of the study comprises of a total of 200 hospitals chosen at random from the above seven regions/areas. The geographical region of the hospital represents a qualitative data. Control also represents a qualitative data as it shows the type of ownership for each hospital. Likewise, service is a qualitative data. It shows the type of the hospital, general medical or psychiatric. Census, births and personnel all represent quantitative data as they involve numerical numbers. 3 RUNNING HEAD: SIGNATURE ASSIGNMENT Geographical region, control and service data all are in the nominal level measurement. This is because they are simply names with no particular order. Census, births and personnel are all in the ratio level of measurement. They all have a meaningful zero. (Hardy & Bryman, 2009). Part 2: Descriptive Statistics From the data on geographical region, the distribution of the hospitals in the seven areas is as follows; South- 56, Northwest- 30, Midwest- 60, Southwest- 3, Rocky Mountain- 20, California- 19 and Northwest-12. From the data on control, the ownership of the hospitals in the study is as follows; government, nonfederal- 51, non-government, not-for-profit- 86, for profit45 and federal government- 18. From the service data, 168 hospitals in the sample were general medical hospitals and 32 were psychiatric hospitals. Microsoft Excel was used in the descriptive statistics for the corresponding census, births and personnel were determined. For the data set census; Mean= 144.095, Median= 102.5, mode= 28, range= 1104, standard deviation= 149.566, variance= 22370.036 and Coefficient of Variance= 1.038. The five-number summary for census is thus {min=2, first quartile= 47.75, median= 102.5, third quartile= 181.75, max= 1106}. For births; mean= 874.045, median= 480, mode= 0, range= 5699, standard deviation= 1063.666, variance= 1131384.556, coefficient of variance= 1.217. The five-number summary for births is thus {min= 0, first quartile= 0, median= 480, third quartile= 1309.25, max= 5699}. For personnel; Mean = 861.5, median= 589.5, mode= 328, range= 4037, standard deviation= 821.597, variance= 675021.618, coefficient of variance= 0.954. The five-number 4 RUNNING HEAD: SIGNATURE ASSIGNMENT summary for personnel is thus {min= 50, first quartile= 314, median= 589.5, third quartile= 1095.25, max= 4087}. (Shi, & McLarty, January 01, 2009). Outliers in the data are identified by first determining the Inter-Quartile Range (IQR). This is given by the difference between the third quartile and the first quartile. The IQR is then used to define the lower bound and the upper bound. The lower bound is determined by subtracting 1.5 of the IQR from the first quartile. To find the upper bound, 1.5 of the IQR is added to the third quartile. Any value of the data that lies below the lower bound or above the upper bound is considered an outlier. (MacRae, Welford & MacRae, 2011). From the census data, IQR= 181.75-47.75 = 134, 1.5×IQR=201 Lower bound = 47.75-201 = -153.25, Upper boun [Show More]
Last updated: 1 year ago
Preview 1 out of 12 pages
.png)
Buy this document to get the full access instantly
Instant Download Access after purchase
Add to cartInstant download
We Accept:

Reviews( 0 )
$6.50
Document information
Connected school, study & course
About the document
Uploaded On
Aug 14, 2021
Number of pages
12
Written in

Additional information
This document has been written for:
Uploaded
Aug 14, 2021
Downloads
0
Views
37
.png)
.png)