Economics > QUESTIONS & ANSWERS > Pennsylvania State University - ECON 102 Quiz 05 Version 2. All Correct answers Reviewed and indicat (All)
Pennsylvania State University - ECON 102 Quiz 05 Version 2. All Correct answers Reviewed and indicated. 100% Score
Document Content and Description Below
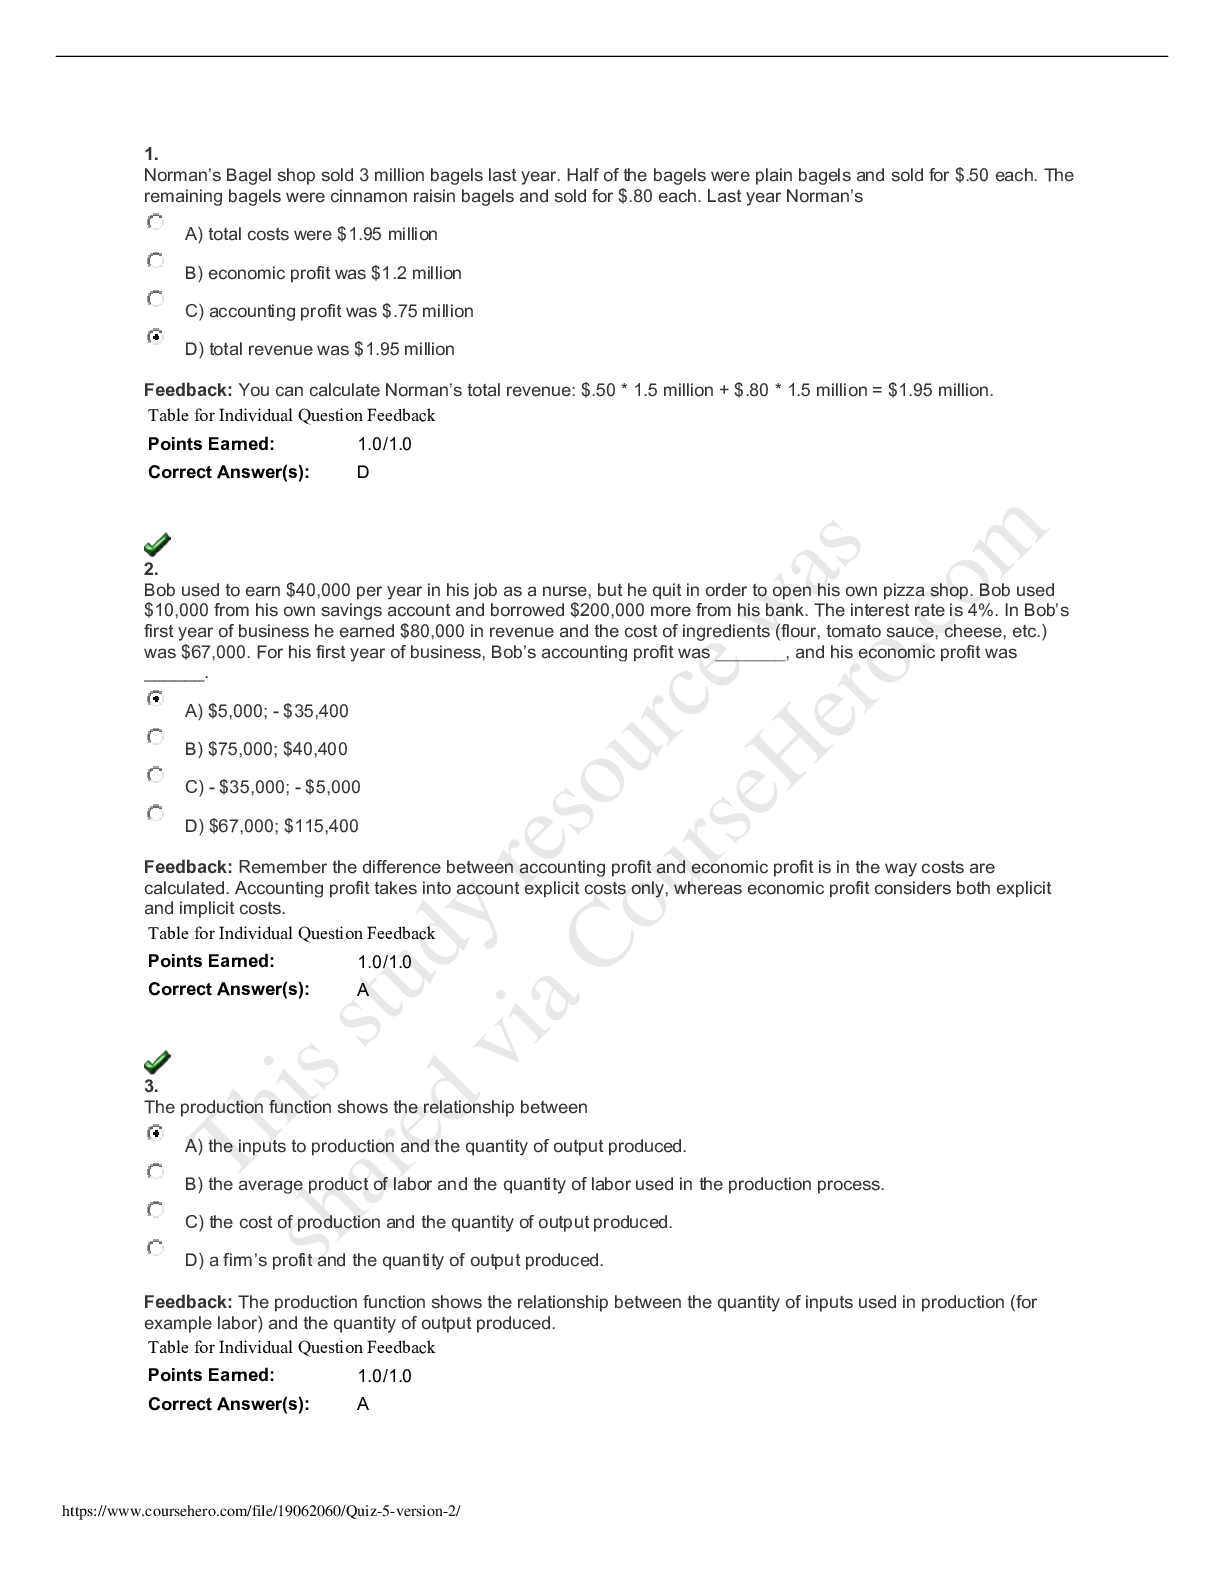
1. Norman’s Bagel shop sold 3 million bagels last year. Half of the bagels were plain bagels and sold for $.50 each. The remaining bagels were cinnamon raisin bagels and sold for $.80 each. Last y... ear Norman’s A) total costs were $1.95 million B) economic profit was $1.2 million C) accounting profit was $.75 million D) total revenue was $1.95 million Feedback: You can calculate Norman’s total revenue: $.50 * 1.5 million + $.80 * 1.5 million = $1.95 million. Table for Individual Question Feedback Points Earned: 1.0/1.0 Correct Answer(s): D 2. Bob used to earn $40,000 per year in his job as a nurse, but he quit in order to open his own pizza shop. Bob used $10,000 from his own savings account and borrowed $200,000 more from his bank. The interest rate is 4%. In Bob’s first year of business he earned $80,000 in revenue and the cost of ingredients (flour, tomato sauce, cheese, etc.) was $67,000. For his first year of business, Bob’s accounting profit was _______, and his economic profit was ______. A) $5,000; - $35,400 B) $75,000; $40,400 C) - $35,000; - $5,000 D) $67,000; $115,400 Feedback: Remember the difference between accounting profit and economic profit is in the way costs are calculated. Accounting profit takes into account explicit costs only, whereas economic profit considers both explicit and implicit costs. Table for Individual Question Feedback Points Earned: 1.0/1.0 Correct Answer(s): A 3. The production function shows the relationship between A) the inputs to production and the quantity of output produced. B) the average product of labor and the quantity of labor used in the production process. C) the cost of production and the quantity of output produced. D) a firm’s profit and the quantity of output produced. Feedback: The production function shows the relationship between the quantity of inputs used in production (for example labor) and the quantity of output produced. Table for Individual Question Feedback Points Earned: 1.0/1.0 Correct Answer(s): A / This study resource was shared via CourseHero.com4. Labor Output 1 0 2 8 3 14 4 18 5 20 Consider the table above. What is the average product when 4 workers are hired? A) 20 B) 4.5 C) 2 D) 80 Feedback: The average product of labor is calculated as Q/L. Table for Individual Question Feedback Points Earned: 1.0/1.0 Correct Answer(s): B 5. Bob’s Bakery can produce 35 loaves of bread per day when 5 workers are hired. When 6 workers are hired, 46 loaves of bread are produced per day, ceteris paribus. Bob pays his workers $10 per day. What is the marginal product of the sixth worker? A) 46 loaves of bread B) $460 C) 11 loaves of bread D) $110 Feedback: The marginal product of labor is the extra output associated with the last worker hired. Table for Individual Question Feedback Points Earned: 1.0/1.0 Correct Answer(s): C 6. This study resource was shared via CourseHero.comWhich of the graphs above show the law of diminishing marginal productivity? A) all of them B) (a) C) (b) D) (d) E) (c) Feedback: Remember the slope of the production function is marginal product and the slope of the total cost curve is marginal cost. When marginal product declines, marginal cost is rising. Table for Individual Question Feedback Points Earned: 0.0/1.0 Correct Answer(s): A 7. Consider the figure above. Which statement below is true? A) Total cost is equal to variable cost. B) Fixed cost is greater than zero. C) Marginal costs first fall and then rise as output increases. This study resource was shared via CourseHero.comD) Marginal costs decrease as output increases. Feedback: Remember that total cost is the sum of fixed cost and variable cost. The vertical intercept on the total cost graph represents fixed cost. Table for Individual Question Feedback Points Earned: 1.0/1.0 Correct Answer(s): B 8. Consider the graph above. This firm is experiencing falling marginal product when A) curve B begins to rise. B) curve A begins to rise. C) curve A intersects curve D. D) curve C begins to rise. Feedback: When Marginal cost begins to rise, the law of diminishing marginal productivity has set in. Table for Individual Question Feedback Points Earned: 0.0/1.0 Correct Answer(s): B 9. Labor Output Variable Cost Fixed Cost Total Consider the table above. At what level of output does ATC reach its minimum? A) 1.13 B) 3 C) 27 https://www.coursehero.com/file/19062060/Quiz-5-version-2/ This study resource was shared via CourseHero.comD) 24 Feedback: ATC = TC/Q. At Q=24, ATC = 27/24. Table for Individual Question Feedback Points Earned: 0.0/1.0 Correct Answer(s): D 10. Diseconomies of scale occur A) when long run ATC is constant as output is varied. B) when long run ATC decreases as output expands. C) when long run ATC increases as output expands. D) when short run ATC decreases as output expands. Feedback: Diseconomies of scale refer to the situation where LRATC slopes upward as Q increases. Table for Individual Question Feedback Points Earned: 1.0/1.0 Correct Answer(s): C [Show More]
Last updated: 1 year ago
Preview 1 out of 5 pages
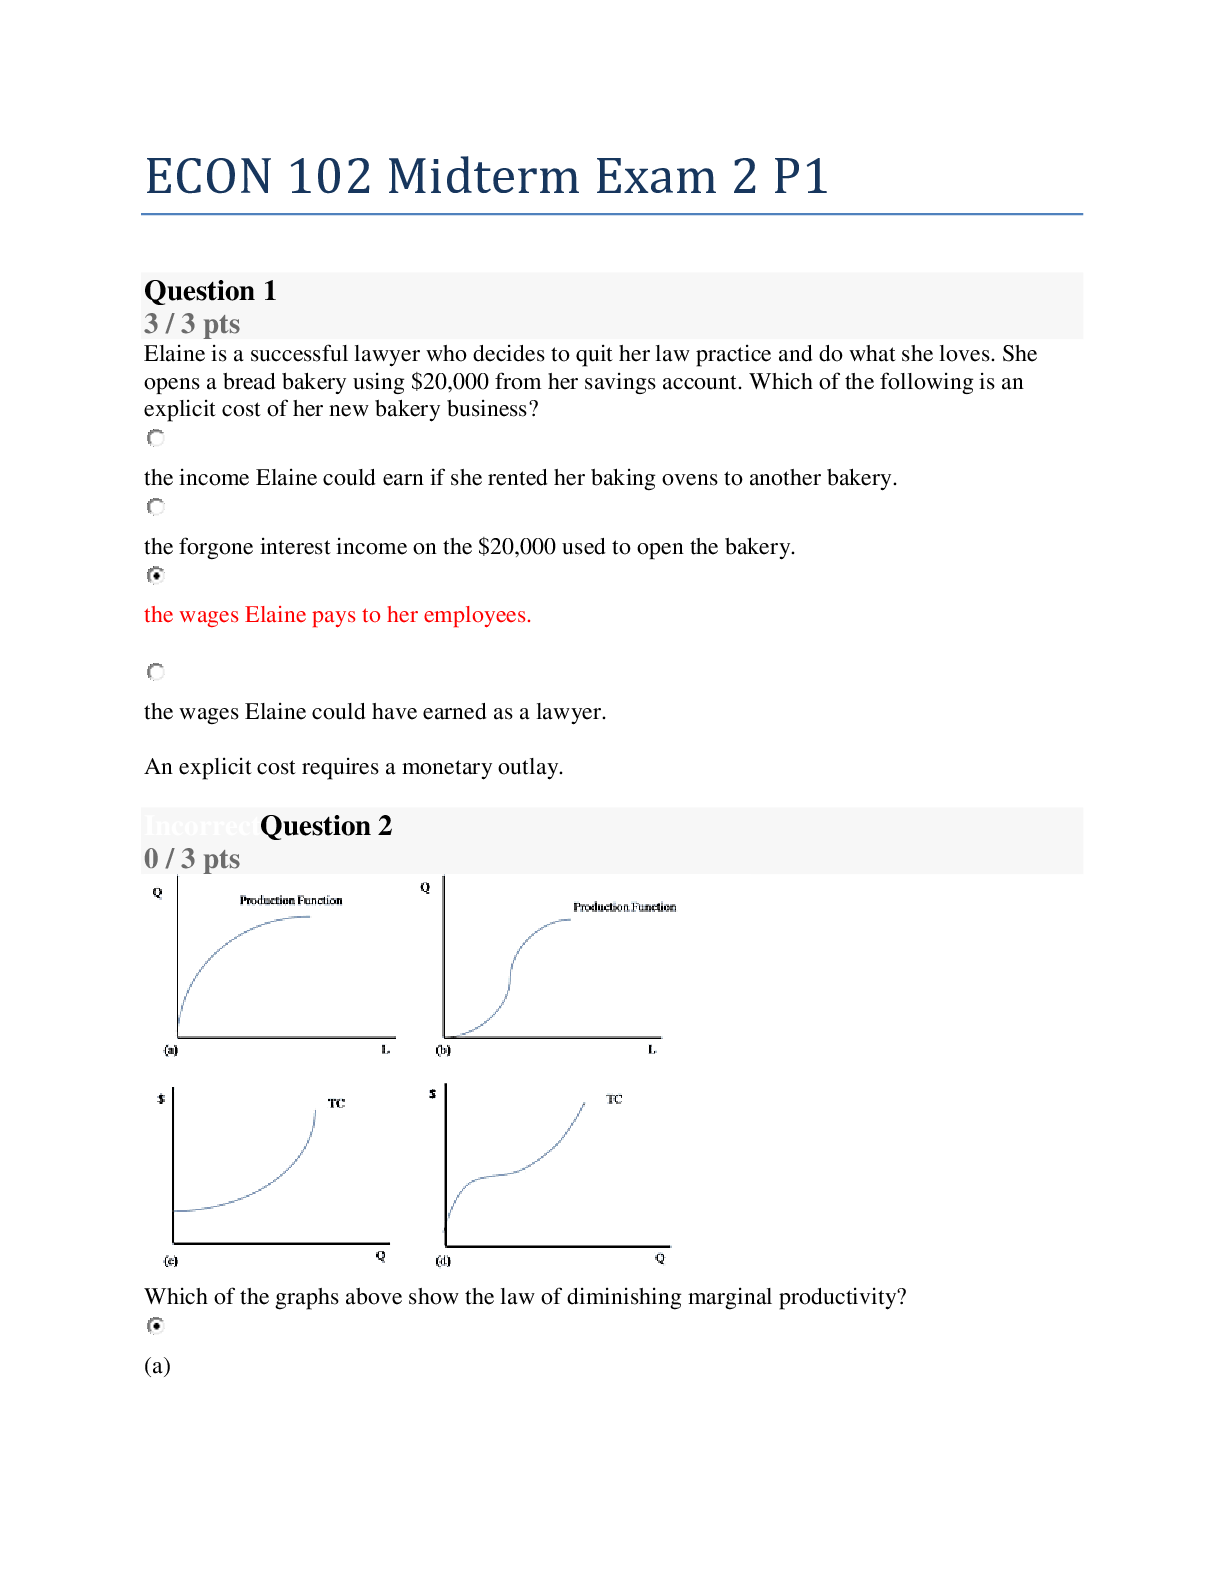
Buy this document to get the full access instantly
Instant Download Access after purchase
Add to cartInstant download
We Accept:

Reviews( 0 )
$9.00
Document information
Connected school, study & course
About the document
Uploaded On
Oct 04, 2020
Number of pages
5
Written in

Additional information
This document has been written for:
Uploaded
Oct 04, 2020
Downloads
0
Views
60