Mathematics > QUESTIONS & ANSWERS > MATH 302 final exam possible questions with answers solution 2020 (All)
MATH 302 final exam possible questions with answers solution 2020
Document Content and Description Below
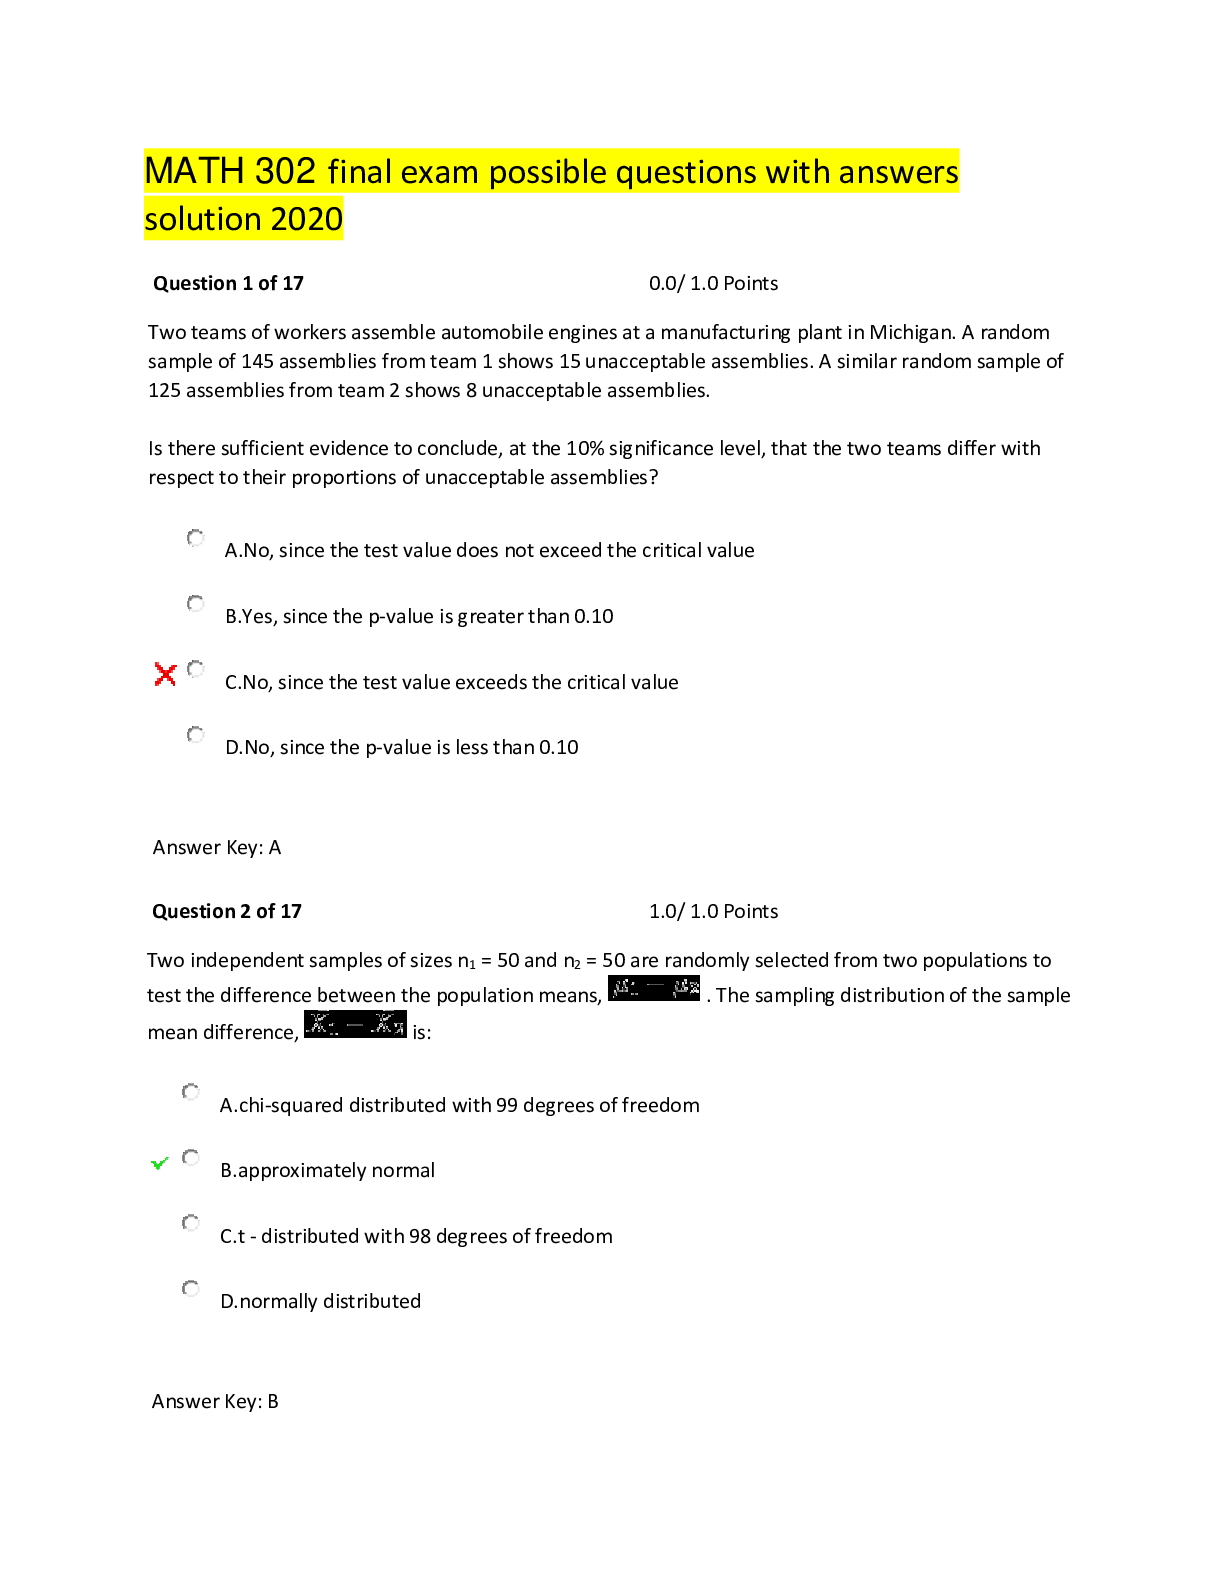
MATH 302 final exam possible questions with answers solution 2020 Question 1 of 17 0.0/ 1.0 Points Two teams of workers assemble automobile engines at a manufacturing plant in Michigan. A random s... ample of 145 assemblies from team 1 shows 15 unacceptable assemblies. A similar random sample of 125 assemblies from team 2 shows 8 unacceptable assemblies. Is there sufficient evidence to conclude, at the 10% significance level, that the two teams differ with respect to their proportions of unacceptable assemblies? A.No, since the test value does not exceed the critical value B.Yes, since the p-value is greater than 0.10 C.No, since the test value exceeds the critical value D.No, since the p-value is less than 0.10 Question 2 of 17 1.0/ 1.0 Points Two independent samples of sizes n1 = 50 and n2 = 50 are randomly selected from two populations to test the difference between the population means, . The sampling distribution of the sample mean difference, is: A.chi-squared distributed with 99 degrees of freedom B.approximately normal C.t - distributed with 98 degrees of freedom D.normally distributed Question 3 of 17 0.0/ 1.0 Points Multiple myeloma or blood plasma cancer is characterized by increased blood vessel formulation in the bone marrow that is a prognostic factor in survival. One treatment approach used for multiple myeloma is stem cell transplantation with the patient’s own stem cells. The following data represent the bone marrow microvessel density for a sample of 7 patients who had a complete response to a stem cell transplant as measured by blood and urine tests. Two measurements were taken: the first immediately prior to the stem cell transplant, and the second at the time of the complete response. Patient 1 2 3 4 5 6 7 Before 158 189 202 353 416 426 441 After 284 214 101 227 290 176 290 Suppose you wanted to conduct a test of hypothesis to determine if there is sufficient evidence to conclude that the mean bone marrow microvessel density is higher before the stem cell transplant than after the stem cell transplant? What is the p-value associated with the test of hypothesis you would conduct? A.p = .114986 B.p = .057493 C.p = .942597 D.p = .885014 Part 2 of 8 - 3.0/ 5.0 Points Question 4 of 17 1.0/ 1.0 Points In a simple linear regression analysis, the following sum of squares are produced: = 400 = 80 = 320 The proportion of the variation in Y that is explained by the variation in X is: A.25% B.80% C.20% D.50% Question 5 of 17 0.0/ 1.0 Points The marketing manager of a large supermarket chain would like to use shelf space to predict the sales of pet food. For a random sample of 12 similar stores, she gathered the following information regarding the shelf space, in feet, devoted to pet food and the weekly sales in hundreds of dollars. . Store 1 2 3 4 5 6 Shelf Space 5 5 5 10 10 10 Weekly Sales 1.6 2.2 1.4 1.9 2.4 2.6 Store 7 8 9 10 11 12 Shelf Space 15 15 15 20 20 20 Weekly Sales 2.3 2.7 2.8 2.6 2.9 3.1 Is the correlation between weekly sales and shelf space significant at the .01 level of significance? A. Yes, the computed t-test statistic is less than the critical value. B.No, the sample correlation coefficient does not exceed the critical value. C.Yes, the value of the test statistic does not exceed the critical value. D.Yes, the p-value of the test for significance is less than .01. Question 6 of 17 1.0/ 1.0 Points The correlation value ranges from A.–2 to +2 B.-3 to +3 C.0 to +1 D.–1 to +1 Question 7 of 17 1.0/ 1.0 Points In choosing the “best-fitting” line through a set of points in linear regression, we choose the one with the: A.smallest number of outliers B.largest sum of squared residuals C.largest number of points on the line D.smallest sum of squared residuals Question 8 of 17 0.0/ 1.0 Points A single variable X can explain a large percentage of the variation in some other variable Y when the two Part 3 of 8 - 1.0/ 2.0 Points Question 9 of 17 1.0/ 2.0 Points Accepted characters: numbers, decimal point markers (period or comma), sign indicators (-), spaces (e.g., as thousands separator, 5 000), "E" or "e" (used in scientific notation). NOTE: For scientific notation, a period MUST be used as the decimal point marker. Complex numbers should be in the form (a + bi) where "a" and "b" need to have explicitly stated values. For example: {1+1i} is valid whereas {1+i} is not. {0+9i} is valid whereas {9i} is not. A field researcher is gathering data on the trunk diameters of mature pine and spruce trees in a certain area. The following are the results of his random sampling. Can he conclude, at the 0.10 level of significance, that the average trunk diameter of a pine tree is greater than the average diameter of a spruce tree? Pine trees Spruce trees Sample size 25 35 Mean trunk diameter (cm) 55 48 Sample variance 100 140 What is the test value for this hypothesis test? Test value: 2Round your answer to three decimal places. What is the critical value? Critical value: Round your answer to three decimal places. Feedback: This is a t-test of independent samples. Use the formula for the t test value on page 480: Using Table F (df = 24, alpha = 0.10, one-tail test) the critical t-value is 1.318. Part 4 of 8 - 2.0/ 2.0 Points Question 10 of 17 1.0/ 1.0 Points Accepted characters: numbers, decimal point markers (period or comma), sign indicators (-), spaces (e.g., as thousands separator, 5 000), "E" or "e" (used in scientific notation). NOTE: For scientific notation, a period MUST be used as the decimal point marker. Complex numbers should be in the form (a + bi) where "a" and "b" need to have explicitly stated values. For example: {1+1i} is valid whereas {1+i} is not. {0+9i} is valid whereas {9i} is not. The marketing manager of a large supermarket chain would like to determine the effect of shelf space (in feet) on the weekly sales of international food (in hundreds of dollars). A random sample of 12 equal –sized stores is selected, with the following results: Store Shelf Space(X) Weekly Sales(Y) 1 10 2.0 2 10 2.6 3 10 1.8 4 15 2.3 5 15 2.8 6 15 3.0 7 20 2.7 8 20 3.1 9 20 3.2 10 25 3.0 11 25 3.3 12 25 3.5 Find the equation of the regression line for these data. What is the value of the standard error of the estimate? Place your answer, rounded to 3 decimal places, in the blank. Do not use a dollar sign. For example, 0.345 would be a legitimate entry. Question 11 of 17 1.0/ 1.0 Points Accepted characters: numbers, decimal point markers (period or comma), sign indicators (-), spaces (e.g., as thousands separator, 5 000), "E" or "e" (used in scientific notation). NOTE: For scientific notation, a period MUST be used as the decimal point marker. Complex numbers should be in the form (a + bi) where "a" and "b" need to have explicitly stated values. For example: {1+1i} is valid whereas {1+i} is not. {0+9i} is valid whereas {9i} is not. A company has observed that there is a linear relationship between indirect labor expense (ILE) , in dollars, and direct labor hours (DLH). Data for direct labor hours and indirect labor expense for 18 months are given in the file ILE_and_DLH.xlsx Treating ILE as the response variable, use regression to fit a straight line to all 18 data points. Using your estimated regression output, predict the indirect labor expenses for a month in which the company has 31 direct labor hours. Place your answer, rounded to 1 decimal place, in the blank. Do not use any stray punctuation marks or a dollar sign. For example, 458.9 would be a legitimate entry. Part 5 of 8 - 0.0/ 2.0 Points Question 12 of 17 0.0/ 1.0 Points Accepted characters: numbers, decimal point markers (period or comma), sign indicators (-), spaces (e.g., as thousands separator, 5 000), "E" or "e" (used in scientific notation). NOTE: For scientific notation, a period MUST be used as the decimal point marker. Complex numbers should be in the form (a + bi) where "a" and "b" need to have explicitly stated values. For example: {1+1i} is valid whereas {1+i} is not. {0+9i} is valid whereas {9i} is not. Are America's top chief executive officers (CEOs) really worth all that money? One way to answer this question is to look at the annual company percentage increase in revenue versus the CEO's annual percentage salary increase in that same company. Suppose that a random sample of companies yielded the following data: percent change for corporation 15 12 3 12 28 6 8 2 percent change for CEO 6 17 -4 12 32 -1 7 2 Do these data indicate that the population mean percentage increase in corporate revenue is greater than the population mean percentage increase in CEO salary? Use a 5% level of significance. What is the test value that you would use to conduct this test of hypothesis? Place your answer, rounded to 3 decimal places, in the blank. For example, 2.345 would be a legitimate entry. Question 13 of 17 0.0/ 1.0 Points Accepted characters: numbers, decimal point markers (period or comma), sign indicators (-), spaces (e.g., as thousands separator, 5 000), "E" or "e" (used in scientific notation). NOTE: For scientific notation, a period MUST be used as the decimal point marker. Complex numbers should be in the form (a + bi) where "a" and "b" need to have explicitly stated values. For example: {1+1i} is valid whereas {1+i} is not. {0+9i} is valid whereas {9i} is not. An investor wants to compare the risks associated with two different stocks. One way to measure the risk of a given stock is to measure the variation in the stock’s daily price changes. In an effort to test the claim that the variance in the daily stock price changes for stock 1 is different from the variance in the daily stock price changes for stock 2, the investor obtains a random sample of 21 daily price changes for stock 1 and 21 daily price changes for stock 2. The summary statistics associated with these samples are: n1 = 21, s1 = .849, n2 = 21, s2 = .529. If you follow Bluman's advice and place the larger variance in the numerator, what is the test value associated with this test of hypothesis? Place your answer, rounded to 3 decimal places, in the blank. For example, 3.456 would be a legitimate entry. Part 6 of 8 - 2.0/ 3.0 Points Question 14 of 17 2.0/ 3.0 Points Accepted characters: numbers, decimal point markers (period or comma), sign indicators (-), spaces (e.g., as thousands separator, 5 000), "E" or "e" (used in scientific notation). NOTE: For scientific notation, a period MUST be used as the decimal point marker. Complex numbers should be in the form (a + bi) where "a" and "b" need to have explicitly stated values. For example: {1+1i} is valid whereas {1+i} is not. {0+9i} is valid whereas {9i} is not. A professor gives an exam for which there are two versions, A and B. Each student in the class is given one randomly selected version of the exam. After the exam, the professor wishes to determine if there is a difference in the level of difficulty of the two versions by determining if there is a significant difference in the mean scores. Assume α = 0.05. Version A Version B Sample size 45 65 Mean score 8.8 8.2 Sample variance 2.6 2.4 What is the test value for this hypothesis test? What is/are the critical value(s) for this hypothesis test? If there are two critical values, give only the positive value. What is the conclusion for this hypothesis test? Choose one. 1. There is not sufficient evidence to show that one version of the exam is more difficult than the other. 2. There is sufficient evidence to show that one version of the exam is more difficult than the other. Answer: 1 Enter only a 1 or 2 for your answer. . Part 7 of 8 - 1.0/ 1.0 Points Question 15 of 17 1.0/ 1.0 Points In conducting hypothesis testing for difference between two means when samples are dependent (paired samples), the variable under consideration is ; the sample mean difference between the pairs. True False Part 8 of 8 - 1.0/ 2.0 Points Question 16 of 17 0.0/ 1.0 Points When the actual values y of a response variable and the corresponding predicted values y' are the same, the standard error of the estimate will be zero. True False Question 17 of 17 1.0/ 1.0 Points A negative relationship between an explanatory variable X and a response variable Y means that as X increases, Y decreases, and vice versa. True False [Show More]
Last updated: 1 year ago
Preview 1 out of 11 pages
Instant download
Buy this document to get the full access instantly
Instant Download Access after purchase
Add to cartInstant download
Reviews( 0 )
Document information
Connected school, study & course
About the document
Uploaded On
Nov 09, 2020
Number of pages
11
Written in

Additional information
This document has been written for:
Uploaded
Nov 09, 2020
Downloads
0
Views
52