Financial Accounting > TEST BANK > Data Analytics for Accounting, 3rd E Vernon Richardson Test Bank (All)
Data Analytics for Accounting, 3rd E Vernon Richardson Test Bank
Document Content and Description Below
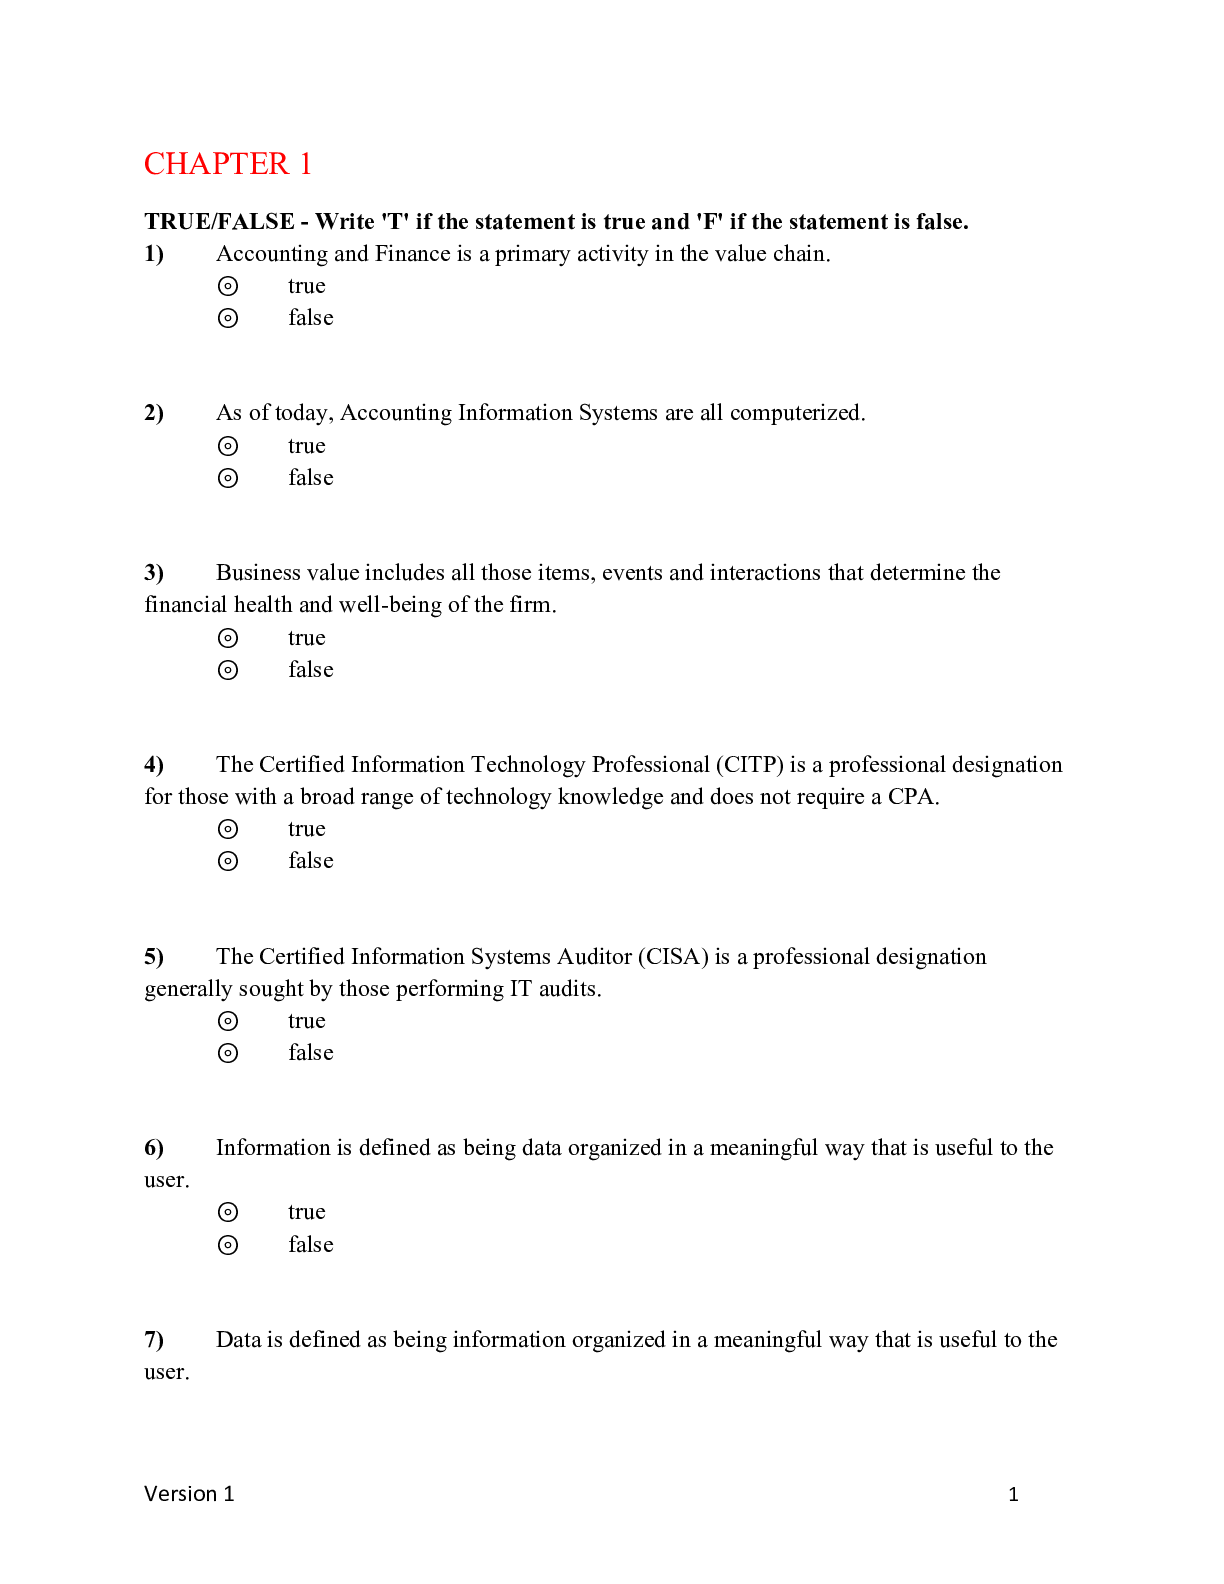
Test Bank for Data Analytics for Accounting, 3rd e by Vernon Richardson and Katie Terrell and Ryan Teeter TEST BANK ISBN-13: 9781264444908 Full chapters included Chapter 1: Data Analytics for A... ccounting and Identifying the Questions Data Analytics How Data Analytics Affects Business How Data Analytics Affects Accounting Auditing Management Accounting Financial Reporting and Financial Statement Analysis Tax The Data Analytics Process Using the IMPACT Cycle Step 1: Identify the Questions (Chapter 1) Step 2: Master the Data (Chapter 2) Step 3: Perform Test Plan (Chapter 3) Step 4: Address and Refine Results (Chapter 3) Steps 5 and 6: Communicate Insights and Track Outcomes (Chapter 4 and each chapter thereafter) Back to Step 1 Data Analytic Skills and Tools Needed by Analytic-Minded Accountants Choose the Right Data Analytics Tools Hands-On Example of the IMPACT Model Identify the Questions Master the Data Perform Test Plan Address and Refine Results Communicate Insights Track Outcomes Summary Key Words Answers to Progress Checks Multiple Choice Questions Discussion and Analysis Problems Lab 1-0 How to Complete Labs Lab 1-1 Data Analytics Questions in Financial Accounting Lab 1-2 Data Analytics Questions in Managerial Accounting Lab 1-3 Data Analytics Questions in Auditing Lab 1-4 Comprehensive Case: Questions about Dillard’s Store Data Lab 1-5 Comprehensive Case: Connect to Dillard’s Store Data Chapter 2: Mastering the Data How Data Are Used and Stored in the Accounting Cycle Internal and External Data Sources Accounting Data and Accounting Information Systems Data and Relationships in a Relational Database Columns in a Table: Primary Keys, Foreign Keys, and Descriptive Attributes Data Dictionaries Extract, Transform, and Load (ETL) the Data Extract Transform Load Ethical Considerations of Data Collection and Use Summary Key Words Answers to Progress Checks Multiple Choice Questions Discussion and Analysis Problems Lab 2-1 Request Data from IT—Sláinte Lab 2-2 Prepare Data for Analysis—Sláinte Lab 2-3 Resolve Common Data Problems—LendingClub Lab 2-4 Generate Summary Statistics—LendingClub Lab 2-5 Validate and Transform Data—College Scorecard Lab 2-6 Comprehensive Case: Build Relationships among Database Tables—Dillard’s Lab 2-7 Comprehensive Case: Preview Data from Tables—Dillard’s Lab 2-8 Comprehensive Case: Preview a Subset of Data in Excel, Tableau Using a SQL Query—Dillard’s Chapter 3: Performing the Test Plan and Analyzing the Results Performing the Test Plan Descriptive Analytics Summary Statistics Data Reduction Diagnostic Analytics Standardizing Data for Comparison (Z-score) Profiling Cluster Analysis Hypothesis Testing for Differences in Groups Predictive Analytics Regression Classification p-Values versus Effect Size Prescriptive Analytics Decision Support Systems Machine Learning and Artificial Intelligence Summary Key Words Answers to Progress Checks Multiple Choice Questions Discussion and Analysis Problems Chapter 3 Appendix: Setting Up a Classification Analysis Lab 3-1 Descriptive Analytics: Filter and Reduce Data—Sláinte Lab 3-2 Diagnostic Analytics: Identify Data Clusters—LendingClub Lab 3-3 Perform a Linear Regression Analysis—College Scorecard Lab 3-4 Comprehensive Case: Descriptive Analytics: Generate Summary Statistics—Dillard’s Lab 3-5 Comprehensive Case: Diagnostic Analytics: Compare Distributions—Dillard’s Lab 3-6 Comprehensive Case: Create a Data Abstract and Perform Regression Analysis—Dillard’s Chapter 4: Communicating Results and Visualizations Communicating Results Differentiating between Statistics and Visualizations Visualizations Increasingly Preferred over Text Determine the Purpose of Your Data Visualization Quadrants 1 and 3 versus Quadrants 2 and 4: Qualitative versus Quantitative A Special Case of Quantitative Data: The Normal Distribution Quadrants 1 and 2 versus Quadrants 3 and 4: Declarative versus Exploratory Choosing the Right Chart Charts Appropriate for Qualitative Data Charts Appropriate for Quantitative Data Learning to Create a Good Chart by (Bad) Example Further Refining Your Chart to Communicate Better Data Scale and Increments Color Communication: More Than Visuals—Using Words to Provide Insights Content and Organization Audience and Tone Revising Summary Key Words Answers to Progress Checks Multiple Choice Questions Discussion and Analysis Problems Lab 4-1 Visualize Declarative Data—Sláinte Lab 4-2 Perform Exploratory Analysis and Create Dashboards—Sláinte Lab 4-3 Create Dashboards—LendingClub Lab 4-4 Comprehensive Case: Visualize Declarative Data—Dillard’s Lab 4-5 Comprehensive Case: Visualize Exploratory Data—Dillard’s Chapter 5: The Modern Accounting Environment The Modern Data Environment The Increasing Importance of the Internal Audit Enterprise Data Common Data Models Automating Data Analytics Continuous Monitoring Techniques Alarms and Exceptions Working Papers and Audit Workflow Electronic Working Papers and Remote Audit Work Summary Key Words Answers to Progress Checks Multiple Choice Questions Discussion and Analysis Problems Lab 5-1 Create a Common Data Model—Oklahoma Lab 5-2 Create a Dashboard Based on a Common Data Model—Oklahoma Lab 5-3 Set Up a Cloud Folder and Review Changes—Sláinte Lab 5-4 Identify Audit Data Requirements—Sláinte Lab 5-5 Comprehensive Case: Setting Scope—Dillard’s Chapter 6: Audit Data Analytics When to Use Audit Data Analytics Identify the Questions Master the Data Perform Test Plan Address and Refine Results Communicate Insights Track Outcomes Descriptive Analytics Aging of Accounts Receivable Sorting Summary Statistics Sampling Diagnostic Analytics Box Plots and Quartiles Z-Score t-Tests Benford’s Law Drill-Down Exact and Fuzzy Matching Sequence Check Stratification and Clustering Advanced Predictive and Prescriptive Analytics in Auditing Regression Classification Probability Sentiment Analysis Applied Statistics Artificial Intelligence Additional Analyses Summary Key Words Answers to Progress Checks Multiple Choice Questions Discussion and Analysis Problems Lab 6-1 Evaluate Trends and Outliers—Oklahoma Lab 6-2 Diagnostic Analytics Using Benford’s Law—Oklahoma Lab 6-3 Finding Duplicate Payments—Sláinte Lab 6-4 Comprehensive Case: Sampling—Dillard’s Lab 6-5 Comprehensive Case: Outlier Detection—Dillard’s Chapter 7: Managerial Analytics Application of the IMPACT Model to Management Accounting Questions Identify the Questions Master the Data Perform Test Plan Address and Refine Results Communicate Insights and Track Outcomes Identifying Management Accounting Questions Relevant Costs Key Performance Indicators and Variance Analysis Cost Behavior Balanced Scorecard and Key Performance Indicators Master the Data and Perform the Test Plan Address and Refine Results Summary Key Words Answers to Progress Checks Multiple Choice Questions Discussion and Analysis Problems Lab 7-1 Evaluate Job Costs—Sláinte Lab 7-2 Create a Balanced Scorecard Dashboard—Sláinte Lab 7-3 Comprehensive Case: Analyze Time Series Data—Dillard’s Lab 7-4 Comprehensive Case: Comparing Results to a Prior Period—Dillard’s Lab 7-5 Comprehensive Case: Advanced Performance Models—Dillard’s Chapter 8: Financial Statement Analytics Financial Statement Analysis Descriptive Financial Analytics Vertical and Horizontal Analysis Ratio Analysis Diagnostic Financial Analytics Predictive Financial Analytics Prescriptive Financial Analytics Visualizing Financial Data Showing Trends Relative Size of Accounts Using Heat Maps Visualizing Hierarchy Text Mining and Sentiment Analysis XBRL and Financial Data Quality XBRL Data Quality XBRL, XBRL-GL, and Real-Time Financial Reporting Examples of Financial Statement Analytics Using XBRL Summary Key Words Answers to Progress Checks Multiple Choice Questions Discussion and Analysis Problems Lab 8-1 Create a Horizontal and Vertical Analysis Using XBRL Data—S&P100 Lab 8-2 Create Dynamic Common Size Financial Statements—S&P100 Lab 8-3 Analyze Financial Statement Ratios—S&P100 Lab 8-4 Analyze Financial Sentiment—S&P100 Chapter 9: Tax Analytics Tax Analytics Identify the Questions Master the Data Perform Test Plan Address and Refine Results Communicate Insights and Track Outcomes Mastering the Data through Tax Data Management Tax Data in the Tax Department Tax Data at Accounting Firms Tax Data at the IRS Tax Data Analytics Visualizations Tax Data Analytics Visualizations and Tax Compliance Evaluating Sales Tax Liability Evaluating Income Tax Liability Tax Data Analytics for Tax Planning What-If Scenarios What-If Scenarios for Potential Legislation, Deductions, and Credits Summary Key Words Answers to Progress Checks Multiple Choice Questions Discussion and Analysis Problems Lab 9-1 Descriptive Analytics: State Sales Tax Rates Lab 9-2 Comprehensive Case: Calculate Estimated State Sales Tax Owed—Dillard’s Lab 9-3 Comprehensive Case: Calculate Total Sales Tax Paid—Dillard’s Lab 9-4 Comprehensive Case: Estimate Sales Tax Owed by Zip Code—Dillard’s and Avalara Lab 9-5 Comprehensive Case: Online Sales Taxes Analysis—Dillard’s and Avalara Chapter 10: Project Chapter (Basic) Evaluating Business Processes Question Set 1: Order-to-Cash QS1 Part 1 Financial: What Is the Total Revenue and Balance in Accounts Receivable? QS1 Part 2 Managerial: How Efficiently Is the Company Collecting Cash? QS1 Part 3 Audit: Is the Delivery Process Following the Expected Procedure? QS1 Part 4 What Else Can You Determine about the O2C Process? Question Set 2: Procure-to-Pay QS2 Part 1 Financial: Is the Company Missing Out on Discounts by Paying Late? QS2 Part 2 Managerial: How Long Is the Company Taking to Pay Invoices? QS2 Part 3 Audit: Are There Any Erroneous Payments? QS2 Part 4 What Else Can You Determine about the P2P Process? Chapter 11: Project Chapter (Advanced): Analyzing Dillard’s Data to Predict Sales Returns Estimating Sales Returns Question Set 1: Descriptive and Exploratory Analysis QS1 Part 1 Compare the Percentage of Returned Sales across Months, States, and Online versus In-Person Transactions QS1 Part 2 What Else Can You Determine about the Percentage of Returned Sales through Descriptive Analysis? Question Set 2: Diagnostic Analytics—Hypothesis Testing QS2 Part 1 Is the Percentage of Sales Returned Significantly Higher in January after the Holiday Season? QS2 Part 2 How Do the Percentages of Returned Sales for Holiday/Non-Holiday Differ for Online Transactions and across Different States? QS2 Part 3 What Else Can You Determine about the Percentage of Returned Sales through Diagnostic Analysis? Question Set 3: Predictive Analytics QS3 Part 1 By Looking at Line Charts for 2014 and 2015, Does the Average Percentage of Sales Returned in 2014 Seem to Be Predictive of Returns in 2015? QS3 Part 2 Using Regression, Can We Predict Future Returns as a Percentage of Sales Based on Historical Transactions? QS3 Part 3 What Else Can You Determine about the Percentage of Returned Sales through Pr [Show More]
Last updated: 1 year ago
Preview 1 out of 169 pages
Instant download
Buy this document to get the full access instantly
Instant Download Access after purchase
Add to cartInstant download
Reviews( 0 )
Document information
Connected school, study & course
About the document
Uploaded On
Jul 28, 2022
Number of pages
169
Written in
Additional information
This document has been written for:
Uploaded
Jul 28, 2022
Downloads
0
Views
406




.png)

