Mathematics > QUESTIONS & ANSWERS > Questions and Answers > Kaplan University MATH 451X UNIT 4. Assignment Model/ Transportation Model (All)
Questions and Answers > Kaplan University MATH 451X UNIT 4. Assignment Model/ Transportation Model
Document Content and Description Below
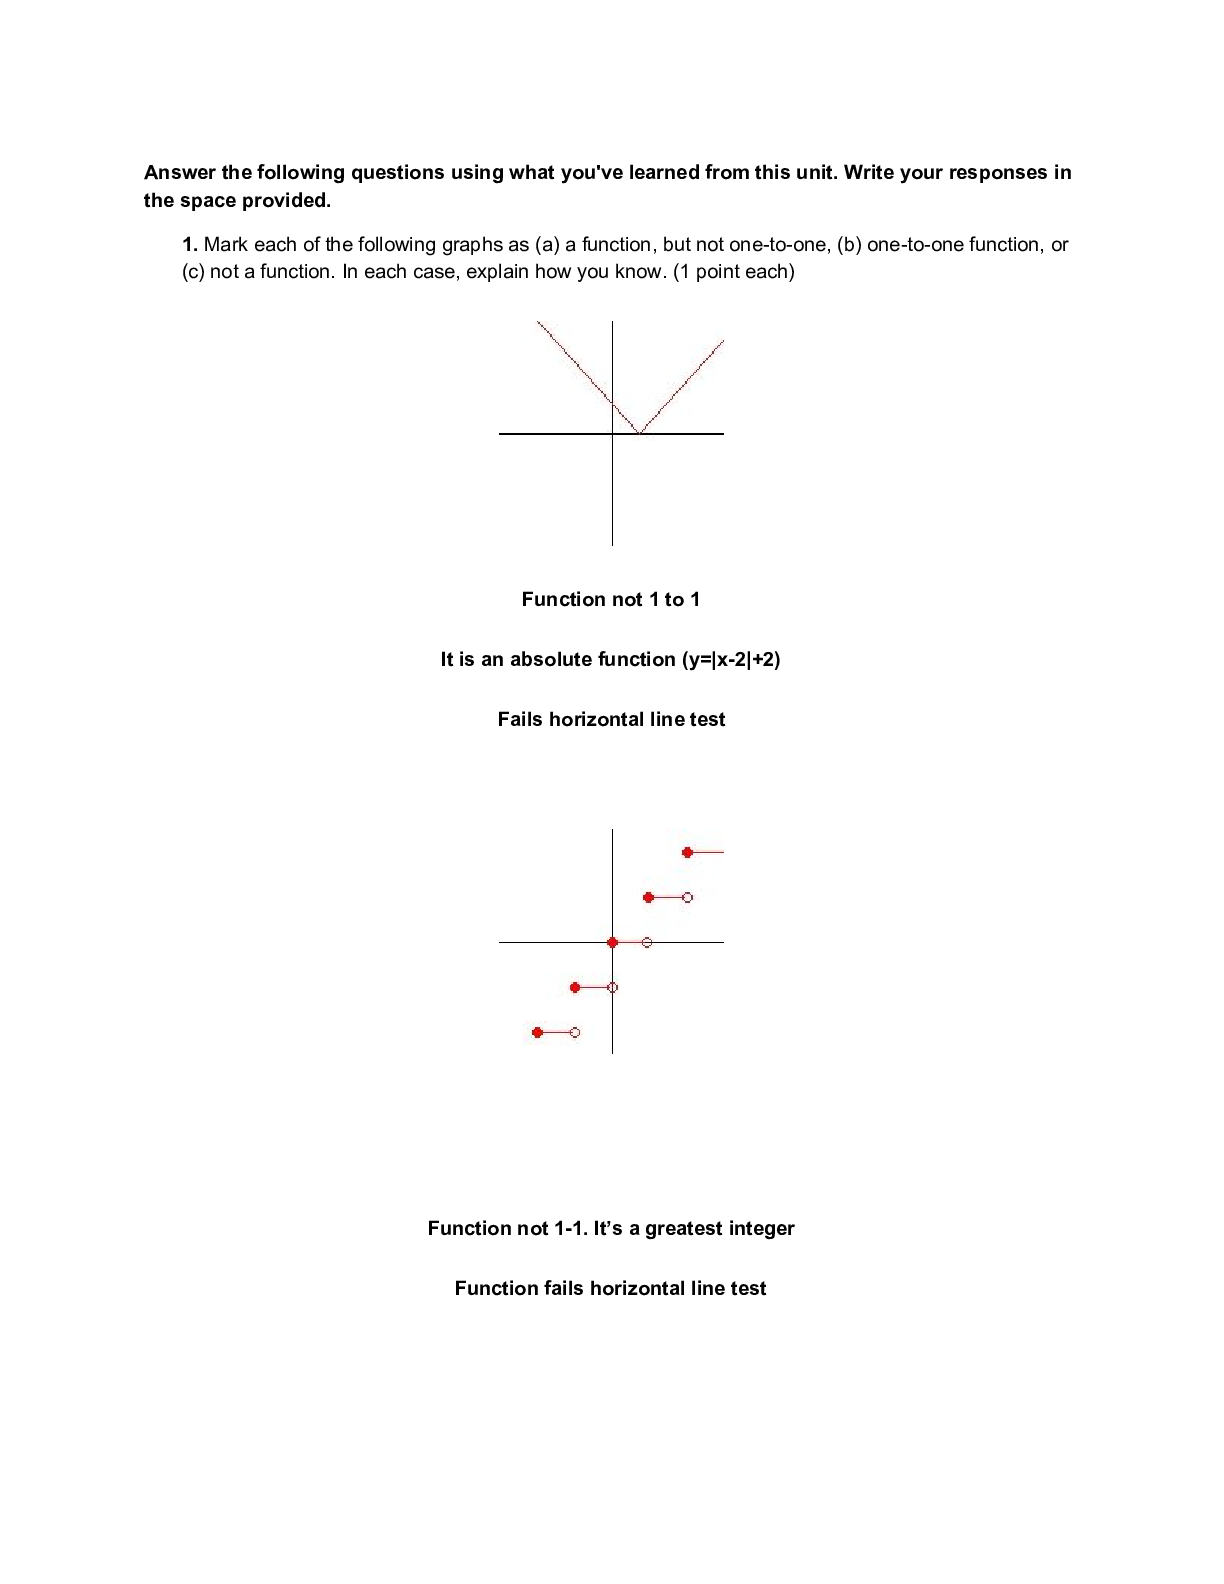
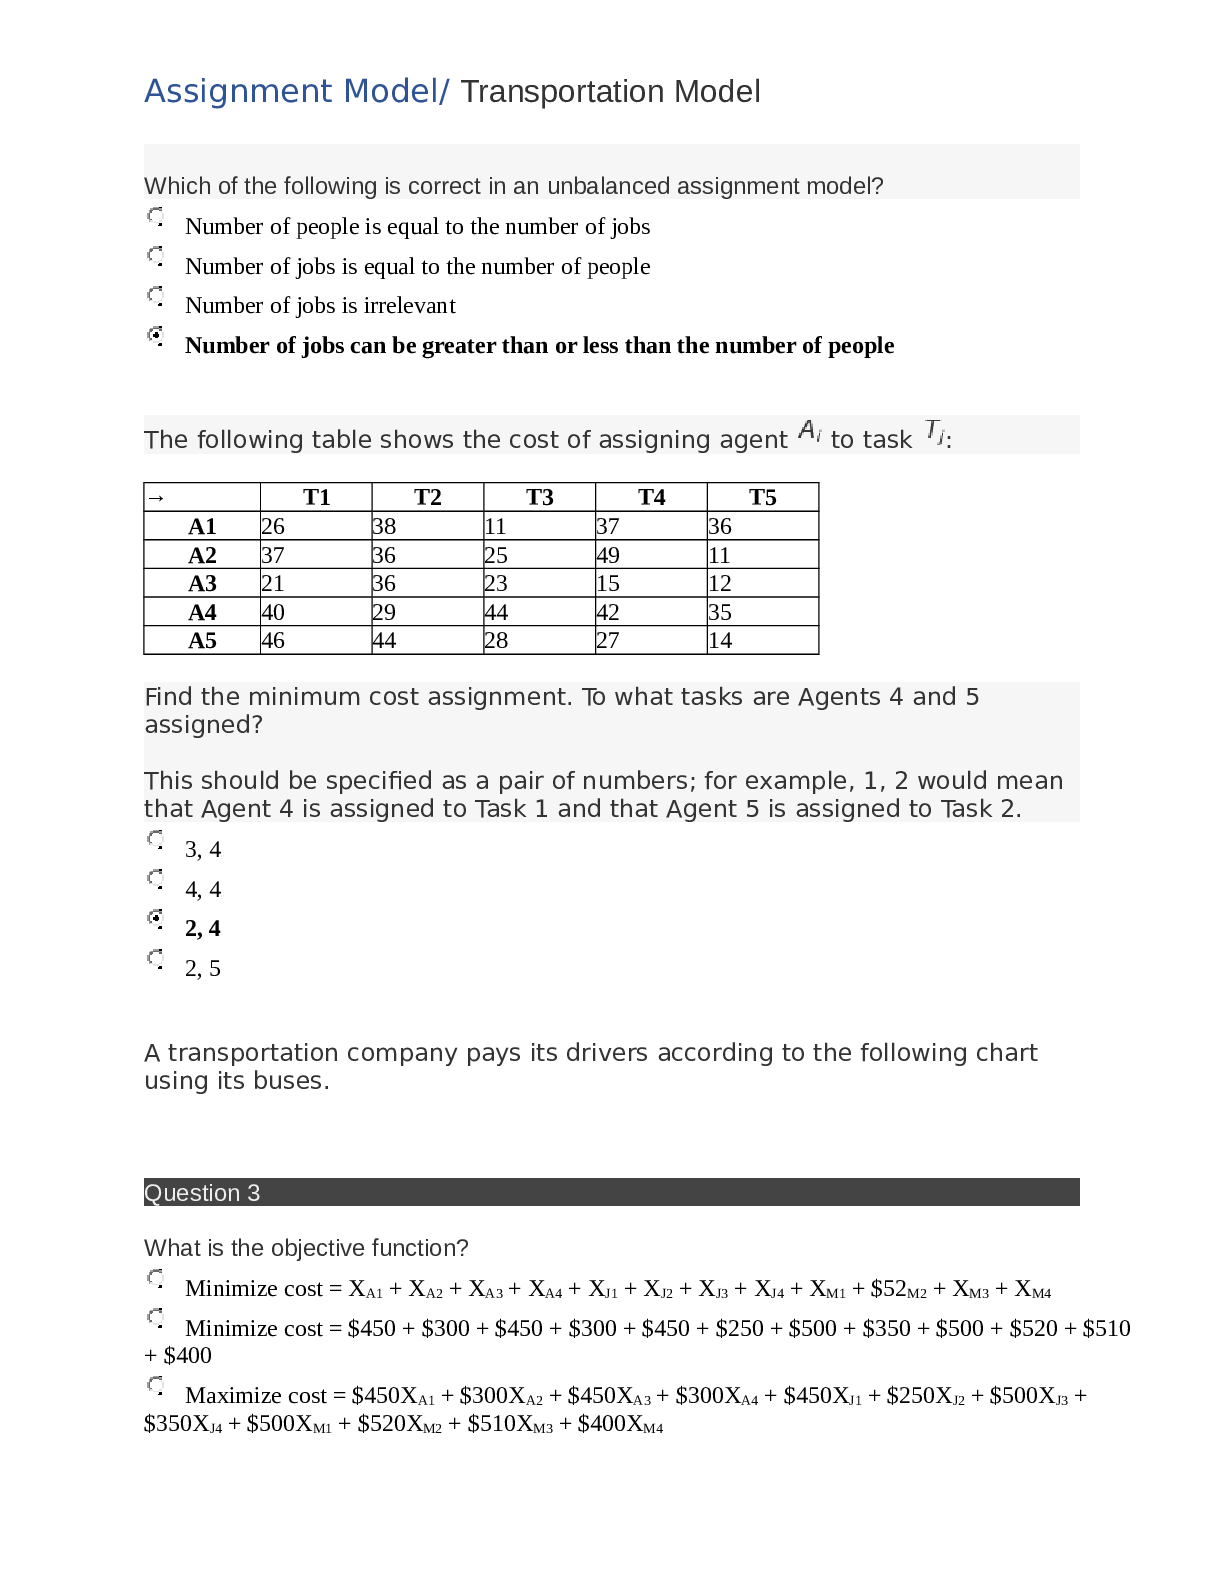
Kaplan University MATH 451X MATH451X UNIT 4 Assignment Model/ Transportation Model Which of the following is correct in an unbalanced assignment model? Number of people is equal to the number of ... jobs Number of jobs is equal to the number of people Number of jobs is irrelevant Number of jobs can be greater than or less than the number of people The following table shows the cost of assigning agent to task : → | T1 | T2 | T3 | T4 | T5 A1 | 26 | 38 | 11 | 37 | 36 A2 | 37 | 36 | 25 | 49 | 11 A3 | 21 | 36 | 23 | 15 | 12 A4 | 40 | 29 | 44 | 42 | 35 A5 | 46 | 44 | 28 | 27 | 14Find the minimum cost assignment. To what tasks are Agents 4 and 5 assigned? This should be specified as a pair of numbers; for example, 1, 2 would mean that Agent 4 is assigned to Task 1 and that Agent 5 is assigned to Task 2. 3, 4 4, 4 2, 4 2, 5 A transportation company pays its drivers according to the following chart using its buses. Question 3 What is the objective function? Minimize cost = XA1 + XA2 + XA3 + XA4 + XJ1 + XJ2 + XJ3 + XJ4 + XM1 + $52M2 + XM3 + XM4 Minimize cost = $450 + $300 + $450 + $300 + $450 + $250 + $500 + $350 + $500 + $520 + $510 + $400 Maximize cost = $450XA1 + $300XA2 + $450XA3 + $300XA4 + $450XJ1 + $250XJ2 + $500XJ3 + $350XJ4 + $500XM1 + $520XM2 + $510XM3 + $400XM4 Assignment Model/ Transportation Model Minimize cost = $450XA1 + $300XA2 + $450XA3 + $300XA4 + $450XJ1 + $250XJ2 + $500XJ3 + $350XJ4 + $500XM1 + $520XM2 + $510XM3 + $400XM4 A new agent has been added, so you have a total of six agents and five tasks. The costs are listed in the following: Costs | T1 | T2 | T3 | T4 | T5 A1 | 0.39 | -0.065 | -0.066 | -0.417 | 0.308 A2 | -0.736 | -0.089 | 0.978 | 0.641 | -0.822 A3 | 0.549 | 0.052 | -0.83 | -0.141 | 0.118 A4 | 0.415 | -0.339 | -0.369 | -0.531 | -0.488 A5 | -0.669 | 0.329 | 0.718 | 0.707 | -0.55 A6 | 0.751 | -0.002 | 0.016 | -0.996 | 0.859If the optimal assignment is made to reduce the total cost, what is the total cost? -9.968 -3.656 9.968 -2.415 The following table shows the cost of assigning agent to task : → | T1 | T2 | T3 | T4 | T5 A1 | 26 | 38 | 11 | 37 | 36 A2 | 37 | 36 | 25 | 49 | 11 A3 | 21 | 36 | 23 | 15 | 12 A4 | 40 | 29 | 44 | 42 | 35 A5 | 46 | 44 | 28 | 27 | 14It has been discovered that these are actually the profits that were made from each possible assignment. Compute the assignment that maximizes the profits. What is the maximum profit? 211 154 191 179 A new agent has been added, so you have a total of six agents and five tasks. The costs are listed in the following: Assignment Model/ Transportation Model Costs | T1 | T2 | T3 | T4 | T5 A1 | 0.39 | -0.065 | -0.066 | -0.417 | 0.308 A2 | -0.736 | -0.089 | 0.978 | 0.641 | -0.822 A3 | 0.549 | 0.052 | -0.83 | -0.141 | 0.118 A4 | 0.415 | -0.339 | -0.369 | -0.531 | -0.488 A5 | -0.669 | 0.329 | 0.718 | 0.707 | -0.55 A6 | 0.751 | -0.002 | 0.016 | -0.996 | 0.859If the optimal assignment is made to reduce the total cost, what is the total cost? -3.656 -2.604 3.656 -2.415 What is the value assigned to each node in an assignment mode? 1 0 2 Any number A new agent has been added, so you have a total of six agents and five tasks. The costs are listed in the following: Costs | T1 | T2 | T3 | T4 | T5 A1 | 0.39 | -0.065 | -0.066 | -0.417 | 0.308 A2 | -0.736 | -0.089 | 0.978 | 0.641 | -0.822 A3 | 0.549 | 0.052 | -0.83 | -0.141 | 0.118 A4 | 0.415 | -0.339 | -0.369 | -0.531 | -0.488 A5 | -0.669 | 0.329 | 0.718 | 0.707 | -0.55 A6 | 0.751 | -0.002 | 0.016 | -0.996 | 0.859There are several ways to block the assignment of Agent A5 to Task T1, as follows: i. Add a constraint that the cell that represents the assignment of A5 to T1 is set to 0. ii. | Do not include the cell that represents the assignment of A5 to T1 in the decision variables. iii. Change the cost to something large. iv. | Run the solver, and if A5 is not assigned to T1, you are done. Assignment Model/ Transportation Model Which of the following statements accurately describes the advantages and disadvantages of the methods? Method i that adds the constraint that forces a particular decision variable to 0 is inefficient. Method ii may not work because it requires several passes to find a large enough cost. Method iii that runs the computation with an unnecessarily large value may add numerical instability. Method ii is error-prone. Or the method I is easy to understand Which of the following is correct in a balanced assignment model? Number of people is greater than or equal to the number of jobs Number of people is greater than the number of jobs Number of people is same as the number of jobs Number of jobs is greater than the number of people A transportation company pays its drivers according to the following chart using its buses. Question 10 What is the flow balance equation for Mike? $500XM1 + $520XM2 + $510XM3 + $400XM4 = 1 XM1 + XM2 + XM3 + XM4 ≥ 1 XM1 + XM2 + XM3 + XM4 = 1 XM1 + XM2 + XM3 + XM4 ≤ 1 A transportation company pays its drivers according to the following chart using its buses. Question 11 Assignment Model/ Transportation Model How many possible solutions does the transportation company need to consider if it had 6 drivers? 720 30 61 6 A new agent has been added, so you have a total of six agents and five tasks. The costs are listed in the following: Costs | T1 | T2 | T3 | T4 | T5 A1 | 0.39 | -0.065 | -0.066 | -0.417 | 0.308 A2 | -0.736 | -0.089 | 0.978 | 0.641 | -0.822 A3 | 0.549 | 0.052 | -0.83 | -0.141 | 0.118 A4 | 0.415 | -0.339 | -0.369 | -0.531 | -0.488 A5 | -0.669 | 0.329 | 0.718 | 0.707 | -0.55 A6 | 0.751 | -0.002 | 0.016 | -0.996 | 0.859If the optimal assignment is made to reduce the total cost, which of the following agents is not assigned? A4 A1 The problem cannot be solved with the data given. A6 Which of the following is correct in an assignment model? A person is assigned to a job A job is assigned to several people Several people are assigned to a job Several jobs are assigned to several people working as a group Which driver was assigned to route 1? Joe Allen No one was assigned to route 1 Assignment Model/ Transportation Model Mike What is the numerical value of the objective function? $1,930 $1,500 $1,050 $1,550 The following table shows the cost of assigning agent to task : → | T1 | T2 | T3 | T4 | T5 A1 | 26 | 38 | 11 | 37 | 36 A2 | 37 | 36 | 25 | 49 | 11 A3 | 21 | 36 | 23 | 15 | 12 A4 | 40 | 29 | 44 | 42 | 35 A5 | 46 | 44 | 28 | 27 | 14 99Find the minimum cost assignment. The total cost is . The following table shows the cost of assigning agent to task : → | T1 | T2 | T3 | T4 | T5 A1 | 26 | 38 | 11 | 37 | 36 A2 | 37 | 36 | 25 | 49 | 11 A3 | 21 | 36 | 23 | 15 | 12 A4 | 40 | 29 | 44 | 42 | 35 A5 | 46 | 44 | 28 | 27 | 14Suppose that it turns out that Agent 3 cannot be assigned to either T1 or T2. How would you change the spreadsheet to represent this constraint? Add two dummy agents, and force them to be assigned to tasks T1 and T2, respectively. Add a dummy task, and force A3 to be assigned to it. Remove the assignment A3→T1 or A3→T2 as decision variables. Or Raise the cost of assigning Agent 3 to T1 or T2 to some very high value. Add an additional constraint saying that the assignment A3→T1 or A3→T2 had to be 1. A new agent has been added, so you have a total of six agents and five tasks. The costs are listed in the following: Assignment Model/ Transportation Model Costs | T1 | T2 | T3 | T4 | T5 A1 | 0.39 | -0.065 | -0.066 | -0.417 | 0.308 A2 | -0.736 | -0.089 | 0.978 | 0.641 | -0.822 A3 | 0.549 | 0.052 | -0.83 | -0.141 | 0.118 A4 | 0.415 | -0.339 | -0.369 | -0.531 | -0.488 A5 | -0.669 | 0.329 | 0.718 | 0.707 | -0.55 A6 | 0.751 | -0.002 | 0.016 | -0.996 | 0.859It turns out that your researcher was confused, and the data refer to profit, not cost. If the assignment is made to maximize profit, which tasks are agents A1 and A2 assigned to? The answer will be a pair of numbers. For example 7, 9 would indicate that Agent 1 is assigned to Task 7 and that Agent 2 assigned to Task 9. 2, 3 3, 5 5, 2 4, 5 Which driver was assigned to route 3? Mike Allen Joe The road assignment was not covered for route 3 Suppose that you have three supply nodes S1–S3 and four demand nodes D1–D4 with the following costs of shipping from S_i to D_j: D1 | D2 | D3 | D4 S1 | 13 | 7 | 5 | 6 S2 | 12 | 10 | 4 | 11 S3 | 4 | 14 | 8 | 9The demand node requirements are as follows: Node | D1 | D2 | D3 | D4 Required | 100 | 120 | 160 | 280The supply capacities are as follows: Assignment Model/ Transportation Model Node | S1 | S2 | S3 Capacity | 300 | 150 | 200Use Solver to compute the solution in Excel. How many units are shipped from S1 to D2? 150 The problem does not have a feasible solution. 0 180 A transportation company delivers chairs made by a furniture department from their factories to their warehouses according to the following chart. The supply and the demand of chairs are provided in the chart as well. How many chairs are delivered from Charlotte to Houston? 200 400 0 250 A transportation company delivers chairs made by a furniture department from their factories to their warehouses according to the following chart. The supply and the demand of chairs are provided in the chart as well. Assignment Model/ Transportation Model What is the numerical value for the objective function? $16,200 $23,750 $305 $24,750 A transportation company delivers chairs made by a furniture department from their factories to their warehouses according to the following chart. The supply and the demand of chairs are provided in the chart as well. What is the balance constraint for New York? XNA + XNH + XND + XNL = 150 XNA + XNH + XND + XNL ≤ 200 XNA + XNH + XND + XNL ≥ 200 $25XNA + $20XNH + $25XND + $45XNL ≤ 200 A transportation company delivers chairs made by a furniture department from their factories to their warehouses according to the following chart. Also the supply and the demand of chairs are provided in the chart as well. Assignment Model/ Transportation Model What is the balance constraint for Houston? XNH + XKH + XCH ≤ 250 XNH + XKH + XCH ≥ 250 $20XNH + $20XKH + $20XCH = 250 XNH + XKH + XCH = 250 Transportation Example Demand | Total Supply at Node S_i D1 | D2 | D3 | D4 Sources | S1 | 13 | 7 | 5 | 6 | 300 S2 | 12 | 10 | 4 | 11 | 150 S3 | 4 | 14 | 8 | 9 | 200 Total demand at node D_i | 90 | 120 | 150 | 280In the given table, the cell where row S3 and column D3 intersect contains a value of 8. What does this mean? Shipping one unit from S3 to D3 costs 8. Or If four units are shipped from S3 to D3, it will cost 32. The maximum number of units that can be shipped from S3 to D3 is 8. This is the smallest number of units that can be shipped from S3 to D3. The cell contains a value of 4, so the question is meaningless. Suppose that you have a transportation problem where the minimum demand exceeds the available supply. Solver will report that there is no feasible solution. One way to get Assignment Model/ Transportation Model around this is to create a dummy node with sufficient supply to make the problem feasible. How would you reflect the costs of undersupplying the demand nodes? Make manual adjustments after Solver has found a solution. The cost of shipping from the dummy node is the cost of undersupply. Add the costs of undersupply to the costs of shipping to each demand node. Add a dummy demand node to capture the costs of undersupply. A transportation company delivers chairs made by a furniture department from their factories to their warehouses according to the following chart. The supply and the demand of chairs are provided in the chart as well. How much is the total shipping cost from Kansas City? $9,200 $40, $20, $12, and $28 $22,198 $100 A transportation company delivers chairs made by a furniture department from their factories to their warehouses according to the following chart. The supply and the demand of chairs are provided in the chart as well. Assignment Model/ Transportation Model How much is the total shipping cost for Charlotte to Denver? 0 $25 $2,500 $22,198 A transportation company delivers chairs made by a furniture department from their factories to their warehouses according to the following chart. The supply and the demand of chairs are provided in the chart as well. How many chairs are delivered from Charlotte to Houston? 0 Assignment Model/ Transportation Model 400 250 200 Let be the cost of shipping a unit from to , let be the quantity shipped from to , let be the demand at sink i, and let be the supply at source j. What is the object function? A transportation company delivers chairs made by a furniture department from their factories to their warehouses according to the following chart. The supply and the demand of chairs are provided in the chart as well. What is the objective function? Minimize shipping cost = XNA + XNH + XND + XNL + XKA + XKH + XKD + XKL + XCA+ XCH + XCD + XCL Minimizing shipping cost = $25 + $20 + $25 + $45 + $40 + $20 + $12 + $28 + $15 + $20 + $25 + $30 Maximizing shipping cost = $25XNA + $20XNH + $25XND + $45XNL + $40XKA + $20XKH + $12XKD + $28XKL + Assignment Model/ Transportation Model $15XCA + $20XCH + $25XCD + $30XCL Minimizing shipping cost = $25XNA + $20XNH + $25XND + $45XNL + $40XKA + $20XKH + $12XKD + $28XKL + $15XCA + $20XCH + $25XCD + $30XCL A transportation company delivers chairs made by a furniture department from their factories to their warehouses according to the following chart. The supply and the demand of chairs are provided in the chart as well. How many chairs are left at the supply node after delivery? 50 0 800 You have shortage of chairs The following figure shows a possible layout of a transportation problem. The light green area has the costs and constraints. The light gray area shows the decision variables. Assignment Model/ Transportation Model Figure 1: Transportation Problem Example The given figure shows an example of a transportation problem. Why is it important to clearly label it? Because it is an opportunity for you to demonstrate your creativity Because you will not remember what the numbers mean when you look at it later Because labeling is required for the scenario manager Because labeling is part of the ISO 8002 standard Transportation Example Demand | Total Supply at Node S_i D1 | D2 | D3 | D4 Sources | S1 | 13 | 7 | 5 | 6 | 300 S2 | 12 | 10 | 4 | 11 | 150 S3 | 4 | 14 | 8 | 9 | 200 Total demand at node D_i | 90 | 120 | 150 | 280Table 1: Costs and Constraints In the given table, you see the costs and the supply and demand constraints. What is the required supply at node D2? 90 Assignment Model/ Transportation Model 150 Transportation Example Demand | Total Supply at Node S_i D1 | D2 | D3 | D4 Sources | S1 | 13 | 7 | 5 | 6 | 300 S2 | 12 | 10 | 4 | 11 | 150 S3 | 4 | 14 | 8 | 9 | 200 Total demand at node D_i | 90 | 120 | 150 | 280Based on the given table, how much can S2 supply? No more than 300 At least 150 A transportation company delivers chairs made by a furniture department from their factories to their warehouses according to the following chart. The supply and the demand of chairs are provided in the chart as well. To what capacity can Kansas City plant lower its production to fully deliver all required chairs and have no left over at any supply node? 350 0 Assignment Model/ Transportation Model 50 800 Let be the cost of shipping a unit from to , let be the quantity shipped from to , let be the demand at sink i, and let be the supply at source j. Which of the following is a valid constraint? A transportation company delivers chairs made by a furniture department from their factories to their warehouses according to the following chart. The supply and the demand of chairs are provided in the chart as well. Which one of the supply nodes runs out of chairs first? New York Kansas City and New York Charlotte Kansas City Assignment Model/ Transportation Model Suppose that there are M demand nodes and N supply nodes. Let | be the demand at node | , and let | be the supply at | . For Solver to be able to find a solution, which ofthe following must be true? .(Thismeansthat for alli, the demand at nodeiis less than the supply at nodei.) . . . Let from | be the cost of shipping a unit from | to | , let to | , let | be the demand at sink i, and let be the quantity shipped be the supply at source j. Which of the following is a valid constraint? [Show More]
Last updated: 1 year ago
Preview 1 out of 18 pages
Buy this document to get the full access instantly
Instant Download Access after purchase
Add to cartInstant download
We Accept:

Reviews( 0 )
$7.00
Document information
Connected school, study & course
About the document
Uploaded On
Aug 02, 2022
Number of pages
18
Written in

Additional information
This document has been written for:
Uploaded
Aug 02, 2022
Downloads
0
Views
74