Mathematics > EXAM > MATH 225 Week 8 Correlation and Causation Exam (All)
MATH 225 Week 8 Correlation and Causation Exam
Document Content and Description Below
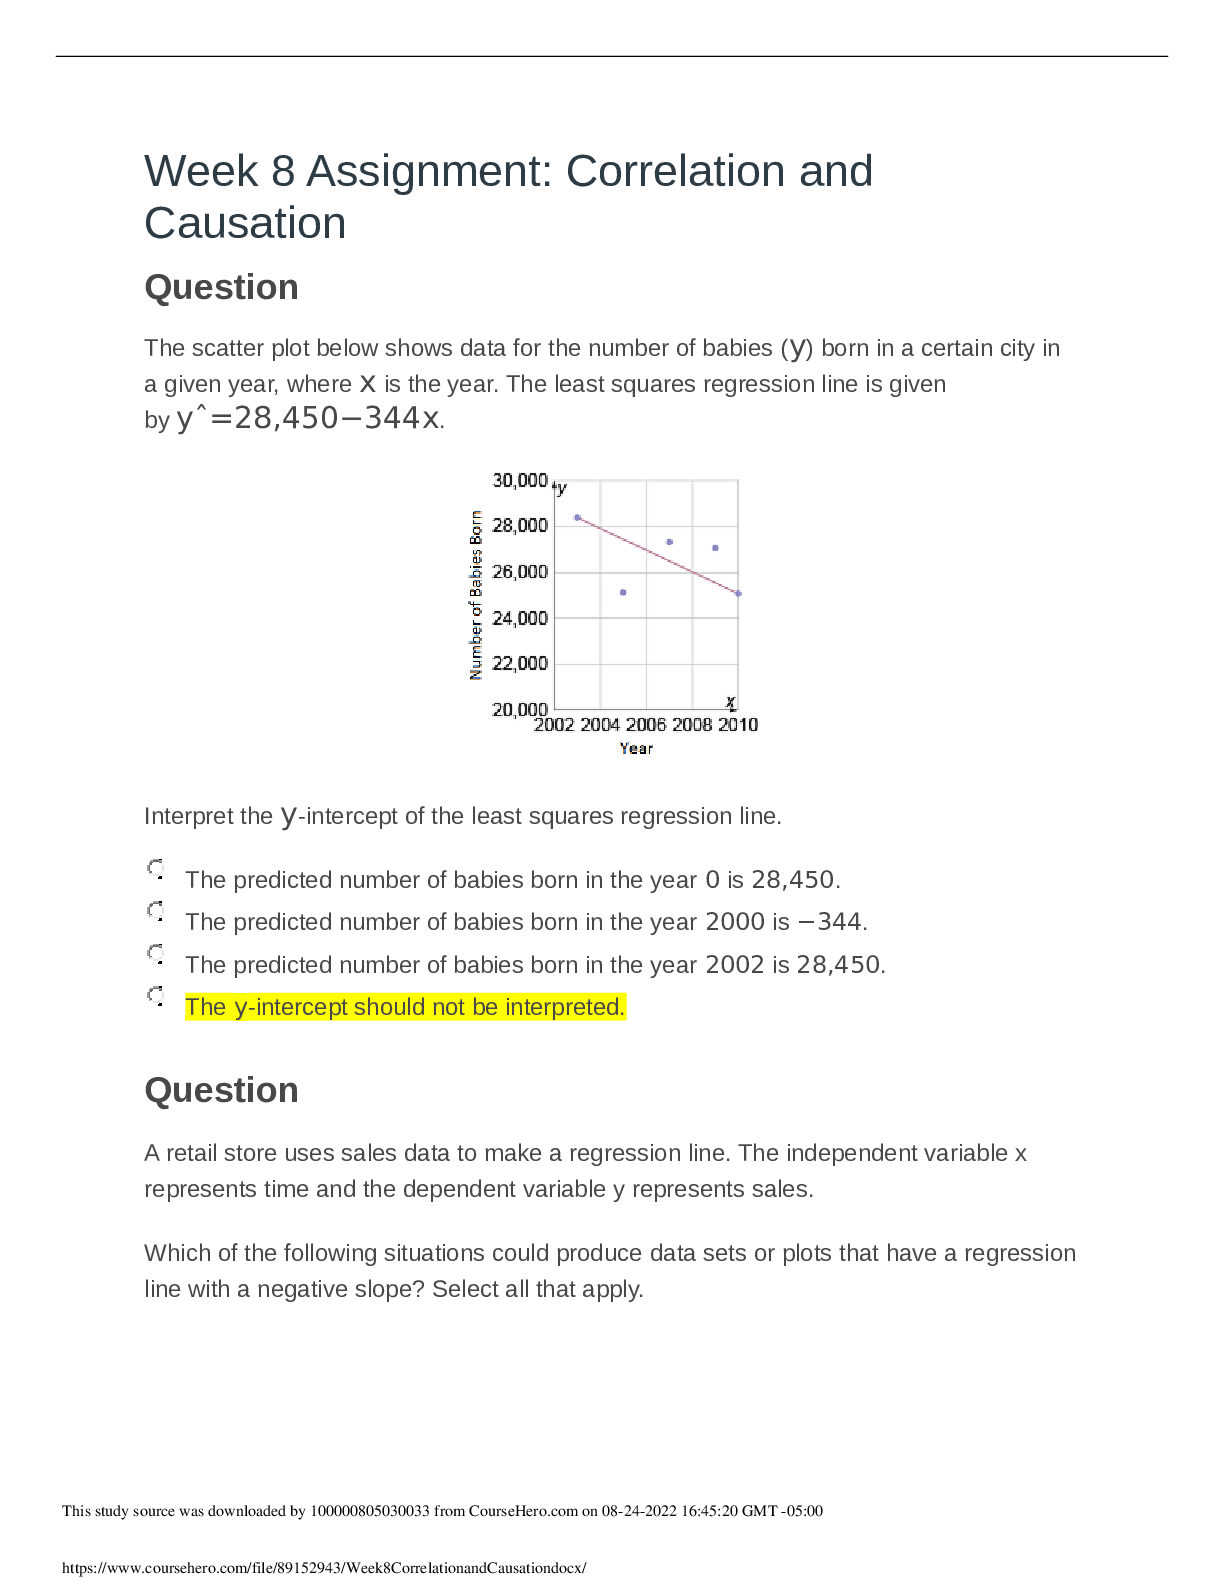
MATH 225 Week 8 Correlation and Causation Exam Question The scatter plot below shows data for the number of babies (y) born in a certain city in a given year, where x is the year. The least squares... regression line is given by yˆ=28,450−344x. Interpret the y-intercept of the least squares regression line. [Show More]
Last updated: 1 year ago
Preview 1 out of 5 pages
Add to cart
Instant download
Buy this document to get the full access instantly
Instant Download Access after purchase
Add to cartInstant download
Reviews( 0 )
Document information
Connected school, study & course
About the document
Uploaded On
Aug 25, 2022
Number of pages
5
Written in

Additional information
This document has been written for:
Uploaded
Aug 25, 2022
Downloads
0
Views
26


.png)