Health Care > QUESTIONS & ANSWERS > Liberty University - HLTH 501 Final Bio. WIth 20 Questions and Answers. (All)
Liberty University - HLTH 501 Final Bio. WIth 20 Questions and Answers.
Document Content and Description Below
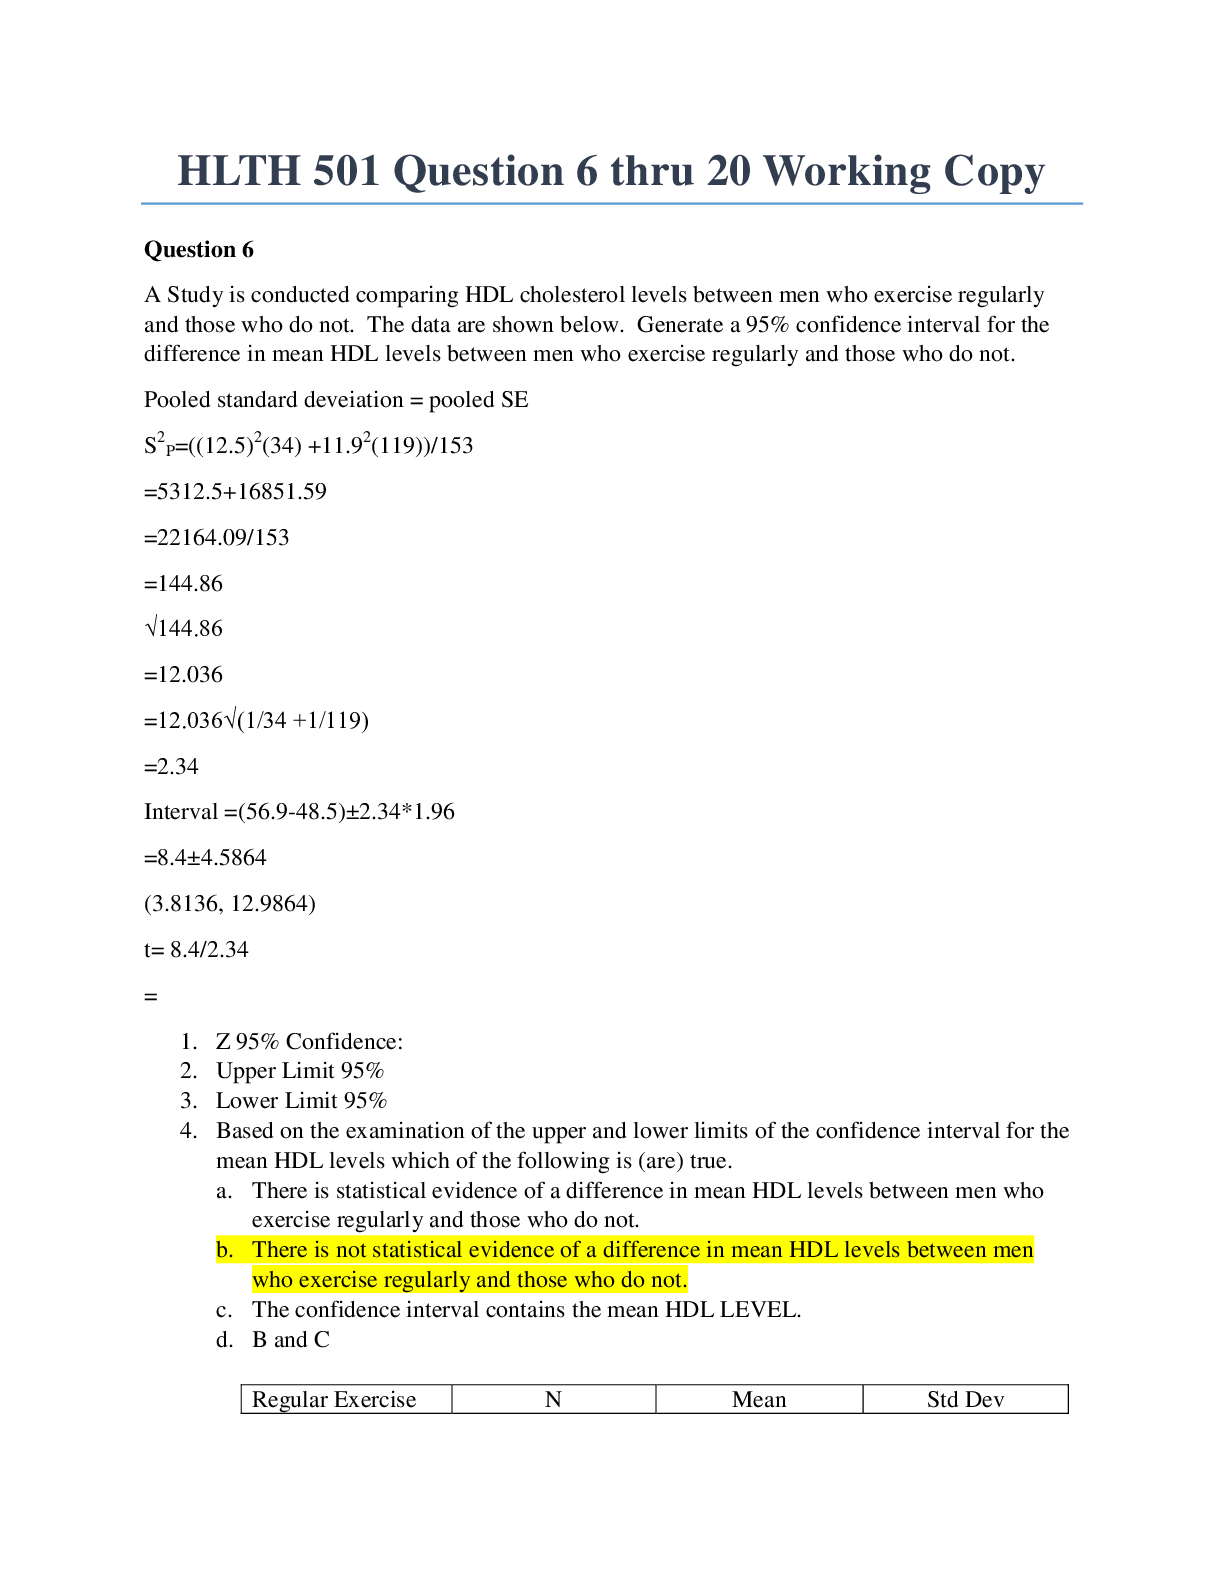
Liberty University - HLTH 501 Final Bio o Question 1 Selected Match Prognostic Factor D. Strongly associated with outcome Prospective G. Study looking forward in time Quasi-experimental A. ... No random assignment Retrospective B. Study looking backward in time Stratification E. Subjects assigned to non overlapping groups Case control study F. Subjects identified based on outcome status Missclassification bias C. Outcome or exposure classification error RCT J. Subject randomly assigned to treatment groups Crossover Trial H. Subjects receive two or more treatments. Washout period I. Time when no treatment occurs o • Question 2 10 out of 10 points An investigator wants to assess whether the use of a specific medication given to infants born prematurely is associated with developmental delay. Fifty infants who were given the medication and fifty comparison infants who were also born prematurely but not given the medication will be selected for the analysis. Each infant will undergo extensive testing at age 2 for various aspects of development. Identify the type of study proposed and indicate its specific strengths and weaknesses. Type of study: (3.3 points) Strengths: (3.3 points) Weaknessess: (3.3 points) • Question 3 10 out of 10 points A study is performed to assess whether there is an association between exposure to second hand cigarette smoke in infancy and delayed development. Fifty children with delayed development and fifty with normal development are selected for investigation. Parents are asked whether their children were exposed to second hand cigarette smoke in infancy or not. This study is an example of a: • Question 4 An investigator conducts a study to investigate whether there is a difference in mean PEF in children with chronic bronchitis as compared to those without. Data on PEF are collected and summarized below. Based on the data, is there statistical evidence of a lower mean PEF in children with chronic bronchitis as compared to those without? Apply the appropriate test at alpha=0.05. 1. Critical t value: (2 points) 2. Computed t: (2 points) 3. Based on comparing the critical t value to the computed t value which of the following is (are) true? (6 points) a. There is statistical evidence of a lower mean PEF in children with chronic bronchitis as compared to those without. b. There is not statistical evidence of a lower mean PEF in children with chronic bronchitis as compared to those without. c. There are not enough data points to reach a conclusion. d. b and c. Question 5 10 out of 10 points Peak expiratory flow (PEF) is a measure of a patient’s ability to expel air from the lungs. Patients with asthma or other respiratory conditions often have restricted PEF. The mean PEF for children free of asthma is 306. An investigator wants to test whether children with chronic bronchitis have restricted PEF. A sample of 40 children with chronic bronchitis are studied and their mean PEF is 279 with a standard deviation of 71. Is there statistical evidence of a lower mean PEF in children with chronic bronchitis? Apply the appropriate test at alpha=0.05. Critical z value: (2 points) Computed z: (2 points) Based on comparing the critical z value to the computed z value which of the following is (are) true? (6 points) a. There is statistically significant evidence at alpha=0.05 to show a lower mean PEF in children with chronic bronchitis?. b. There is not statistically significant evidence at alpha=0.05 to show a lower mean PEF in children with chronic bronchitis?. c. There are not enough data points to reach a conclusion. d. b and c. • Question 7 A study is conducted comparing HDL cholesterol levels between men who exercise regularly and those who do not. The data are shown below. Generate a 95% confidence interval for the difference in mean HDL levels between men who exercise regularly and those who do not. 1. Z 95% Confidence: (2 points) 2. Upper Limit 95% CI: (2 points) 3. Lower Limit 95% CI: (2 points) 4. Based on examination of the upper and lower limits of the confidence interval for the mean HDL levels which of the following is (are) true. (4 points) a. There is statistical evidence of a difference in mean HDL levels between men who exercise regularly and those who do not. b. There is not statistical evidence of a difference in mean HDL levels between men who exercise regularly and those who do not. c. The confidence interval contains the mean HDL level. d. b and c. • Question 8 A randomized controlled trial is run to evaluate the effectiveness of a new drug for asthma in children. A total of 250 children are randomized to either the new drug or placebo (125 per group). There are 63 boys assigned to the new drug group and 58 boys assigned to the placebo. Is there a statistically significant difference in the proportions of boys assigned to the treatments? Apply the appropriate test at a 5% level of significance. 1. Critical value= +/- (2 points) 2. Computed statistics= (2 points) 3. Based on comparing the computed statistic to the critical value which of the following is (are) true? (6 points) a. There is significant evidence, alpha=0.05, that there is a difference in the proportions of boys assigned to the treatments. b. There is not significant evidence, alpha=0.05, that there is a difference in the proportions of boys assigned to the treatments. c. Statistically speaking the difference in the proportions of boys assigned to the treatments is 0. d. b and c. • Question 9 The table below summarizes baseline characteristics on patients participating in a clinical trial. 1. Which, if any, baseline characteristics are significantly different (at the 0.05 level of significance) between treatment groups? (10 points) a. Age b. Total Cholesterol c. Diabetes d. % Female e. a and b f. c and d • Question 10 8 out of 10 points A clinical trial is conducted to investigate the effectiveness of an experimental drug in reducing preterm delivery to a drug considered standard care and to placebo. Pregnant women are enrolled and randomly assigned to receive either the experimental drug, the standard drug or placebo. Women are followed through delivery and classified as delivering preterm (< 37 weeks) or not. The data are shown below. Is there a statistically significant difference in the proportions of women delivering preterm among the three treatment groups? Apply the test at a 5% level of significance. 1.df: (2 points) 2.Critical value: (2 points) 3.Computed value: (2 points) 4.Based on comparing the computed Chi Square value with the critical value for Chi Square which if the following is (are) true? (4 points) a. There is statistically significant difference in the proportions of women delivering preterm among the three treatment groups. b. There is not statistically significant difference in the proportions of women delivering preterm among the three treatment groups. c. The proportions are statistically the same d. a and c. • Question 11 A study is designed to investigate whether there is a difference in response to various treatments in patients with rheumatoid arthritis. The outcome is patient’s self-reported effect of treatment. The data are shown below. Is there a statistically significant difference in the proportions of patients who show improvement between treatments 1 and 2. Apply the test at a 5% level of significance. 1. Critical value: (2 points) 2. Computed statistic: (2 points) 3. Based on comparing the computed statistics to the critical value which of the following is (are) true? (6 points) a. There is significant evidence, alpha=0.05, to show that there is a difference in the proportions of patients who show improvement between treatments 1 and 2. b. There is not significant evidence, alpha=0.05, to show that there is a difference in the proportions of patients who show improvement between treatments 1 and 2. c. There is significant evidence, alpha=0.05, to show that there is a no difference in the proportions of patients who show improvement between treatments 1 and 2. d. a and c. • Question 12 10 out of 10 points The following data were collected in a clinical trial to compare a new drug to a placebo for its effectiveness in lowering total serum cholesterol. Generate a 95% confidence interval for the difference in mean total cholesterol levels between treatments. 1. Upper limit of CI: (2 points) 2. Lower limit of CI: (2 points) 3. Based on the confidence interval which of the following is (are) true? (4 points) a. There is significant evidence, alpha=0.05, to show that there is a difference in Total Serum Cholesterol between treatments New Drug and Placebo. b. There is not significant evidence, alpha=0.05, to show that there is a difference in Total Serum Cholesterol between treatments New Drug and Placebo. c. The difference between Total Serum Cholesterol between treatments New Drug and Placebo is essentially 0. d. b and c. • Question 13 A randomized controlled trial is run to evaluate the effectiveness of a new drug for asthma in children. A total of 250 children are randomized to either the new drug or placebo (125 per group). The mean age of children assigned to the new drug is 12.4 with a standard deviation of 3.6 years. The mean age of children assigned to the placebo is 13.0 with a standard deviation of 4.0 years. Is there a statistically significant difference in ages of children assigned to the treatments? Apply the two sample z test at a 5% level of significance. 1. Critical z value = +/- (2 points) 2. Computed statistic= (2 points) 3. Based on comparing the computed statistic to the critical value which of the following is (are) true? (6 points) a. There is significant evidence, alpha=0.05, that there is a difference in ages of children assigned to the treatments. b. There is not significant evidence, alpha=0.05, that there is a difference in ages of children assigned to the treatments. c. Statistically speaking the difference in initial weights and weights after 6 weeks is 0. d. b and c. • Question 14 An observational study is conducted to investigate the association between age and total serum cholesterol. The correlation is estimated at r = 0.35. The study involves n=125 participants and the mean (std dev) age is 44.3 (10.0) years with an age range of 35 to 55 years, and mean (std dev) total cholesterol is 202.8 (38.4). The regression equation is below. Estimate the total serum cholesterol for a 50-year old person. 1. Total serum cholesterol= (10 points) • Question 15 10 out of 10 points The line of best fit can be defined as: ( 10 points) • Question 16 The graph below shows what kind of relationship between the independent and dependent variables: (10 points) • Question 17 A randomized trial is conducted to evaluate the efficacy of a new cholesterol lowering medication. The primary outcome is incident coronary artery disease. Participants are free of coronary artery disease at the start of the study and randomized to receive either the new medication or a placebo. Participants are followed for a maximum of 10 years for the development of coronary artery disease. The following data are observed. 1. Compute the relative risk of coronary artery disease in patients receiving the new medication as compared to placebo. Relative Risk = (5 points) 2. Compute the odds ratio of coronary artery disease in patients receiving the new medication as compared to placebo. Odds Ratio = (5 points) • Question 18 5 out of 10 points A total of 300 participants are selected for a study of risk factors for cardiovascular disease. At baseline (study start), 48 are classified as hypertensive. At one year, an additional 24 have developed hypertension and at 2 years another 16 have developed hypertension. What is the prevalence of hypertension at 2 years in the study? 1. Prevalence 2 Years = (5 points) 2. Consider the study described in problem 8, what is the 2-year cumulative incidence of hypertension? Cumulative Incidence 2 Years = (5 points) • Question 19 10 out of 10 points The following data were collected in a study relating hypertensive status measured at baseline to incident stroke over 5 years. 1. Compute the cumulative incidence of stroke in the study. Cumulative Incidence = (1.6 points) 2. Compute the cumulative incidence of stroke in patients classified as hypertensive at baseline. Cumulative Incidence Hypertensive = (1.6 points) 3. Compute the cumulative incidence of stroke in patients free of hypertension at baseline. Cumulative Incidence Not Hypertensive = (1.6 points) 4. Compute the risk difference of stroke in patients with hypertension as compared to patients free of hypertension. Risk Difference = (1.6 points) 5. Compute the relative risk of stroke in patients with hypertension as compared to patients free of hypertension. Relative Risk = (1.6 points) 6. Compute the population attributable risk of stroke due to hypertension. PAR = (1.7 points) • Question 20 10 out of 10 points Which of the following is true? (10 points) [Show More]
Last updated: 1 year ago
Preview 1 out of 10 pages

Buy this document to get the full access instantly
Instant Download Access after purchase
Add to cartInstant download
We Accept:

Reviews( 0 )
$14.00
Document information
Connected school, study & course
About the document
Uploaded On
Jan 12, 2021
Number of pages
10
Written in

Additional information
This document has been written for:
Uploaded
Jan 12, 2021
Downloads
0
Views
41


.png)