Statistics > TEST BANK > Statistics for Managers Using Microsoft Excel, 9th edition By David M. Levine, David F. Stephan , Ka (All)
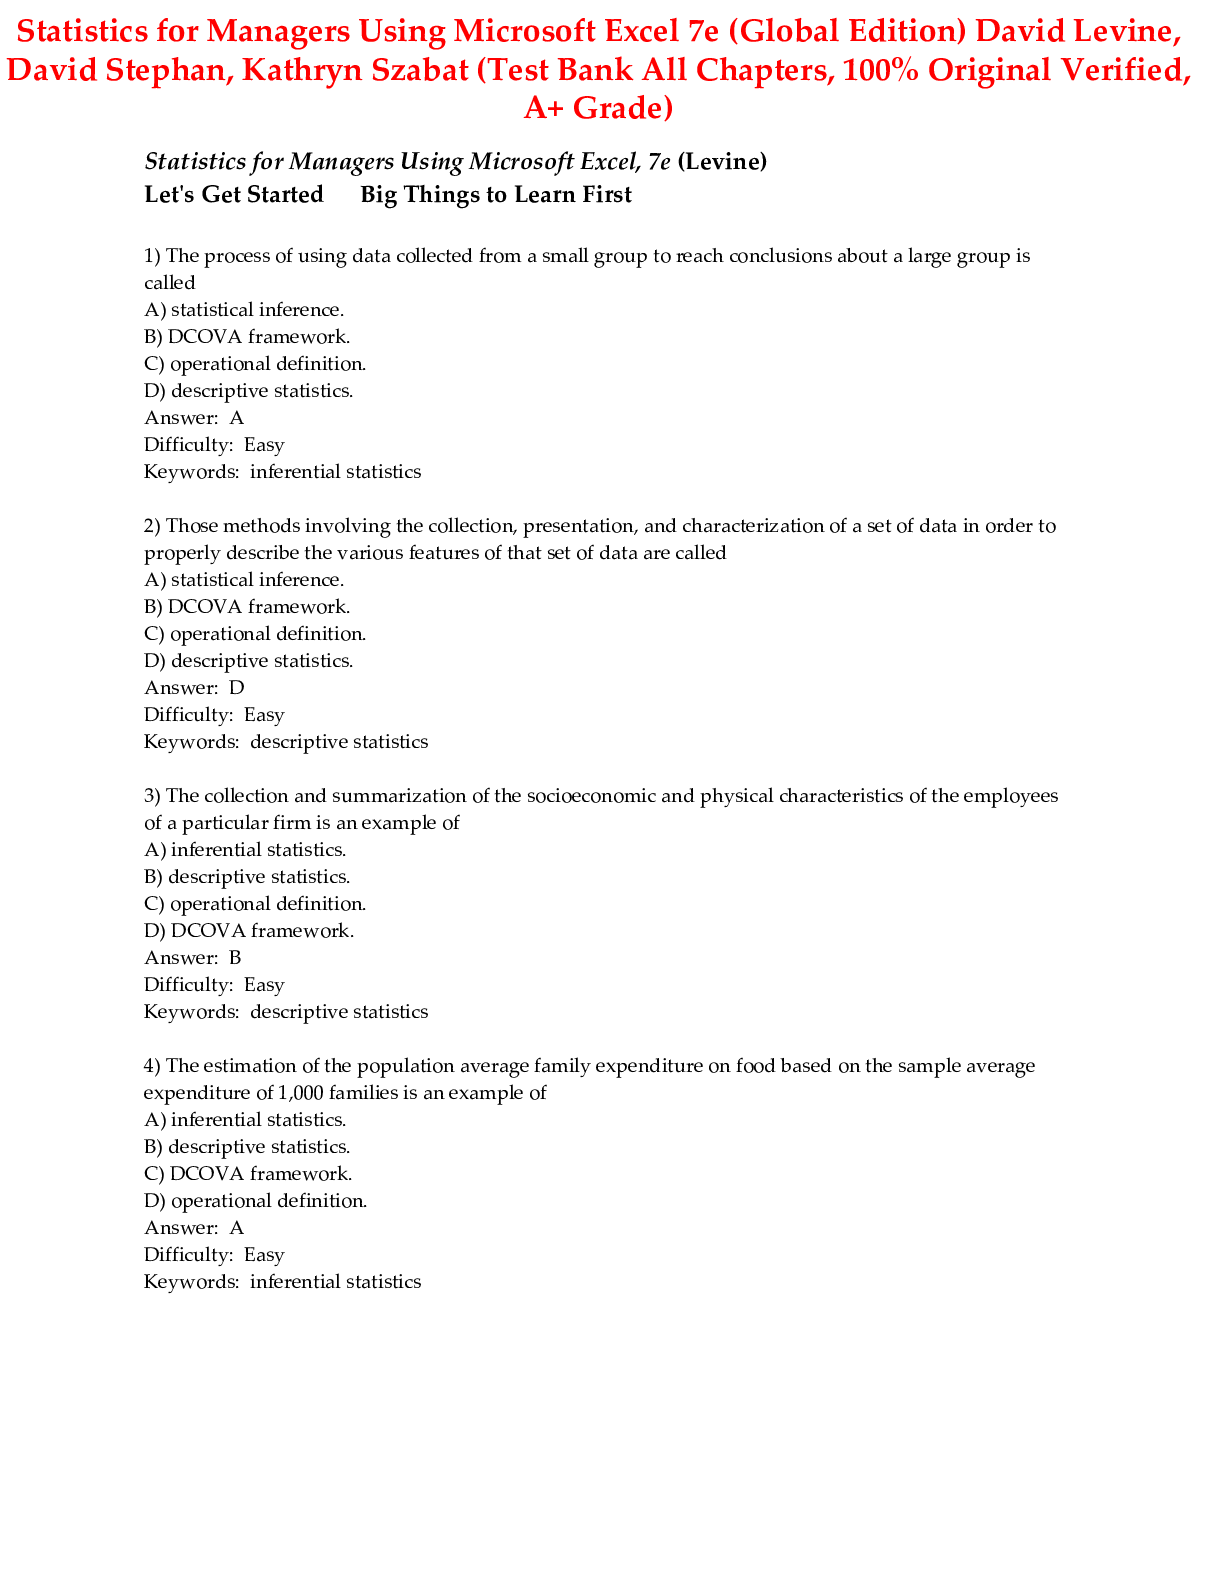
Statistics for Managers Using Microsoft Excel, 9th edition By David M. Levine, David F. Stephan , Kathryn Szabat (Test Bank)
Document Content and Description Below
Table of Contents Preface First Things First FTF.1 Think Differently About Statistics FTF.2 Business Analytics: The Changing Face of Statistics FTF.3 Starting Point for Learning Statistics FTF.4... Starting Point for Using Software FTF.5 Starting Point for Using Microsoft Excel Defining and Collecting Data 1.1 Defining Variables 1.2 Collecting Data 1.3 Types of Sampling Methods 1.4 Data Cleaning 1.5 Other Data Preprocessing Tasks 1.6 Types of Survey Errors Organizing and Visualizing Variables 2.1 Organizing Categorical Variables 2.2 Organizing Numerical Variables 2.3 Visualizing Categorical Variables 2.4 Visualizing Numerical Variables 2.5 Visualizing Two Numerical Variables 2.6 Organizing a Mix of Variables 2.7 Visualizing a Mix of Variables 2.8 Filtering and Querying Data 73 2.9 Pitfalls in Organizing and Visualizing Variables Numerical Descriptive Measures 3.1 Measures of Central Tendency 3.2 Measures of Variation and Shape 3.3 Exploring Numerical Variables 3.4 Numerical Descriptive Measures for a Population 3.5 The Covariance and the Coefficient of Correlation 3.6 Descriptive Statistics: Pitfalls and Ethical Issues Basic Probability 4.1 Basic Probability Concepts 4.2 Conditional Probability 4.3 Ethical Issues and Probability 4.4 Bayes’ Theorem 4.5 Counting Rules Discrete Probability Distributions 5.1 The Probability Distribution for a Discrete Variable 5.2 Binomial Distribution 5.3 Poisson Distribution 5.4 Covariance of a Probability Distribution and Its Application in Finance 5.5 Hypergeometric Distribution The Normal Distribution and Other Continuous Distributions 6.1 Continuous Probability Distributions 6.2 The Normal Distribution 6.3 Evaluating Normality 6.4 The Uniform Distribution 6.5 The Exponential Distribution 6.6 The Normal Approximation to the Binomial Distribution Sampling Distributions 7.1 Sampling Distributions 7.2 Sampling Distribution of the Mean 7.3 Sampling Distribution of the Proportion 7.4 Sampling from Finite Populations Confidence Interval Estimation 8.1 Confidence Interval Estimate for the Mean (σ Known) 8.2 Confidence Interval Estimate for the Mean (σ Unknown) 8.3 Confidence Interval Estimate for the Proportion 8.4 Determining Sample Size 8.5 Confidence Interval Estimation and Ethical Issues 8.6 Application of Confidence Interval Estimation in Auditing 8.7 Estimation and Sample Size Determination for Finite Populations 8.8 Bootstrapping Fundamentals of Hypothesis Testing: One-Sample Tests 9.1 Fundamentals of Hypothesis Testing 9.2 t Test of Hypothesis for the Mean (σ Unknown) 9.3 One-Tail Tests 9.4 Z Test of Hypothesis for the Proportion 9.5 Potential Hypothesis-Testing Pitfalls and Ethical Issues 9.6 Power of the Test Two-Sample Tests 10.1 Comparing the Means of Two Independent Populations 10.2 Comparing the Means of Two Related Populations 10.3 Comparing the Proportions of Two Independent Populations 10.4 F Test for the Ratio of Two Variances 10.5 Effect Size Analysis of Variance 11.1 One-Way ANOVA 11.2 Two-Way ANOVA 11.3 The Randomized Block Design 11.4 Fixed Effects, Random Effects, and Mixed Effects Models Chi-Square and Nonparametric Tests 12.1 Chi-Square Test for the Difference Between Two Proportions 12.2 Chi-Square Test for Differences Among More Than Two Proportions 12.3 Chi-Square Test of Independence 12.4 Wilcoxon Rank Sum Test for Two Independent Populations 12.5 Kruskal-Wallis Rank Test for the One-Way ANOVA 12.6 McNemar Test for the Difference Between Two Proportions (Related Samples) 12.7 Chi-Square Test for the Variance or Standard Deviation 12.8 Wilcoxon Signed Ranks Test for Two Related Populations Simple Linear Regression 13.1 Simple Linear Regression Models 13.2 Determining the Simple Linear Regression Equation 13.3 Measures of Variation 13.4 Assumptions of Regression 13.5 Residual Analysis 13.6 Measuring Autocorrelation: The Durbin-Watson Statistic 13.7 Inferences About the Slope and Correlation Coefficient 13.8 Estimation of Mean Values and Prediction of Individual Values 13.9 Potential Pitfalls in Regression Introduction to Multiple Regression 14.1 Developing a Multiple Regression Model 14.2 Evaluating Multiple Regression Models 14.3 Multiple Regression Residual Analysis 14.4 Inferences About the Population Regression Coefficients 14.5 Testing Portions of the Multiple Regression Model 14.6 Using Dummy Variables and Interaction Terms 14.7 Logistic Regression 14.8 Cross-Validation Multiple Regression Model Building 15.1 The Quadratic Regression Model 15.2 Using Transformations in Regression Models 15.3 Collinearity 15.4 Model Building 15.5 Pitfalls in Multiple Regression and Ethical Issues Time-Series Forecasting 16.1 Time-Series Component Factors 16.2 Smoothing an Annual Time Series 16.3 Least-Squares Trend Fitting and Forecasting 16.4 Autoregressive Modeling for Trend Fitting and Forecasting 16.5 Choosing an Appropriate Forecasting Model 16.6 Time-Series Forecasting of Seasonal Data 16.7 Index Numbers Business Analytics 17.1 Business Analytics Overview 17.2 Descriptive Analytics 17.3 Decision Trees 17.4 Clustering 17.5 Association Analysis 17.6 Text Analytics 17.7 Prescriptive Analytics Getting Ready to Analyze Data in the Future 18.1 Analyzing Numerical Variables 18.2 Analyzing Categorical Variables Statistical Applications in Quality Management (online) 19.1 The Theory of Control Charts 19.2 Control Chart for the Proportion: The p Chart 19.3 The Red Bead Experiment: Understanding Process Variability 19.4 Control Chart for an Area of Opportunity: The c Chart 19.5 Control Charts for the Range and the Mean 19.6 Process Capability 19.7 Total Quality Management 19.8 Six Sigma Decision Making 20.1 Payoff Tables and Decision Trees 20.2 Criteria for Decision Making 20.3 Decision Making with Sample Information 20.4 Utility Appendices [Show More]
Last updated: 1 year ago
Preview 1 out of 437 pages
Reviews( 0 )
Document information
Connected school, study & course
About the document
Uploaded On
Oct 28, 2022
Number of pages
437
Written in

Additional information
This document has been written for:
Uploaded
Oct 28, 2022
Downloads
0
Views
225