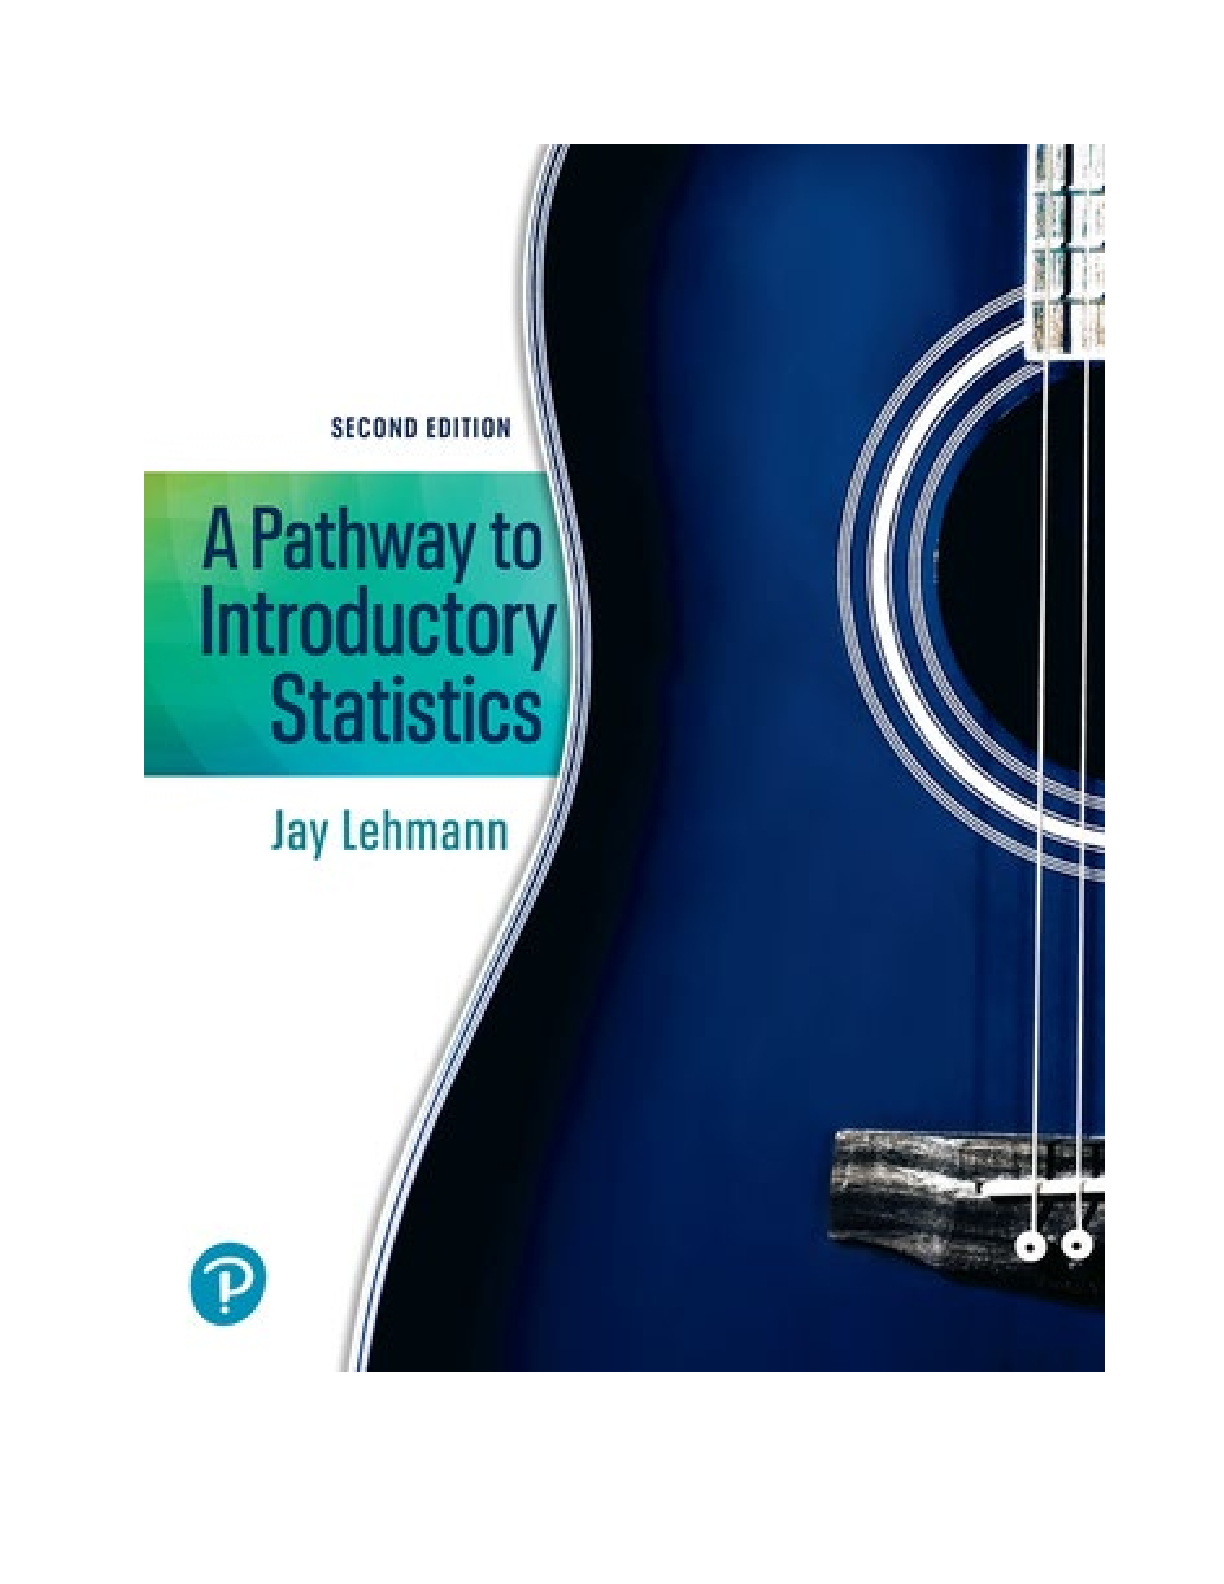
Statistics > TEST BANK > A Pathway to Introductory Statistics, 2nd edition By Jay Lehmann (Test Bank) (All)
A Pathway to Introductory Statistics, 2nd edition By Jay Lehmann (Test Bank)
Document Content and Description Below
Performing Operations and Evaluating Expressions 1.1 Variables, Constants, Plotting Points, and Inequalities 1.2 Expressions 1.3 Operations with Fractions and Proportions; Converting Units 1.4 Abs... olute Value and Adding Real Numbers 1.5 Change in a Quantity and Subtracting Real Numbers 1.6 Ratios, Percents, and Multiplying and Dividing Real Numbers 1.7 Exponents, Square Roots, Order of Operations, and Scientific Notation Hands-On Projects: Stocks Project Designing Observational Studies and Experiments 2.1 Simple Random Sampling 2.2 Systematic, Stratified, and Cluster Sampling 2.3 Observational Studies and Experiments Hands-On Projects: Survey about Proportions Project; Online Report Project Constructing Graphical and Tabular Displays of Data 3.1 Frequency Tables, Relative Frequency Tables, and Bar Graphs 3.2 Pie Charts and Two-Way Tables 3.3 Dotplots, Stemplots, and Time-Series Plots 3.4 Histograms 3.5 Misleading Graphical Displays of Data Hands-On Projects: Critical-Thinking Project Summarizing Data Numerically 4.1 Measures of Center 4.2 Measures of Spread 4.3 Boxplots Hands-On Projects: Comparison Shopping of Cars Project Computing Probabilities 5.1 Meaning of Probability 5.2 Complement and Addition Rules 5.3 Conditional Probability and the Multiplication Rule for Independent Events 5.4 Discrete Random Variables 5.5 Finding Probabilities for a Normal Distribution 5.6 Finding Values of Variables for Normal Distributions Hands-On Projects: Heights of Adults Project Constructing Scatterplots and Drawing Linear Models 6.1 Scatterplots 6.2 Determining the Four Characteristics of an Association 6.3 Modeling Linear Associations Hands-On Projects: Climate Change Project Linear Sketch Project: Topic of Your Choice Graphing Equations of Lines and Linear Models; Rate of Change 7.1 Graphing Equations of Lines and Linear Models 7.2 Rate of Change and Slope of a Line 7.3 Using Slope to Graph Equations of Lines and Linear Models 7.4 Functions Hands-On Projects: Climate Change Project; Workout Project Solving Linear Equations and Inequalities to Make Predictions 8.1 Simplifying Expressions 8.2 Solving Linear Equations in One Variable 8.3 Solving Linear Equations to Make Predictions 8.4 Solving Formulas and Evaluating Summation Notation 8.5 Solving Linear Inequalities to Make Predictions Finding Equations of Linear Models 9.1 Using Two Points to Find an Equation of a Line 9.2 Using Two Points to Find an Equation of a Linear Model 9.3 Linear Regression Model Hands-On Projects: Climate Change Project; Golf Ball Project; Linear Project: Topic of Your Choice Using Exponential Models to Make Predictions 10.1 Integer Exponents 10.2 Rational Exponents 10.3 Graphing Exponential Models 10.4 Using Two Points to Find an Equation of an Exponential Model 10.5 Exponential Regression Model Hands-On Projects: Cooling Water Project Exponential Project: Topic of Your Choice Logarithmic Functions (Online Only) 11.1 Composite Functions 11.2 Inverse Functions 11.3 Logarithmic Functions 11.4 Properties of Logarithms 11.5 Using the Power Property with Exponential Models to Make Predictions 11.6 More Properties of Logarithms 11.7 Natural Logarithms Taking It to the Lab: China and India Populations Lab Folding Paper Lab Exponential/Logarithmic Lab: Topic of Your Choice Systems of Linear Equations and Systems of Linear Inequalities (Online Only) 12.1 Using Graphs and Tables to Solve Systems 12.2 Using Substitution to Solve Systems 12.3 Using Elimination to Solve Systems 12.4 Using Systems to Model Data 12.5 Perimeter, Value, Interest, and Mixture Problems 12.6 Linear Inequalities in Two Variables: Systems of Linear Inequalities in Two Variables: Systems of Linear Inequalities in Two Variables Taking It to the Lab: Climate Change Lab (continued from Chapter 8) Sports Lab Truck Lab Chapter Summary Key Points of Chapter 12 Appendices A: Using A TI-84 Graphing Calculator B: Using StatCrunch C: Standard Normal Distribution Table [Show More]
Last updated: 1 year ago
Preview 1 out of 324 pages
Instant download
Instant download
Reviews( 0 )
Document information
Connected school, study & course
About the document
Uploaded On
Oct 28, 2022
Number of pages
324
Written in
Additional information
This document has been written for:
Uploaded
Oct 28, 2022
Downloads
0
Views
36




.png)








.png)
