Mathematics > QUESTIONS & ANSWERS > Week 6 practice test 4 - American Public University MATH 302 | COMPLETED (All)
Week 6 practice test 4 - American Public University MATH 302 | COMPLETED
Document Content and Description Below
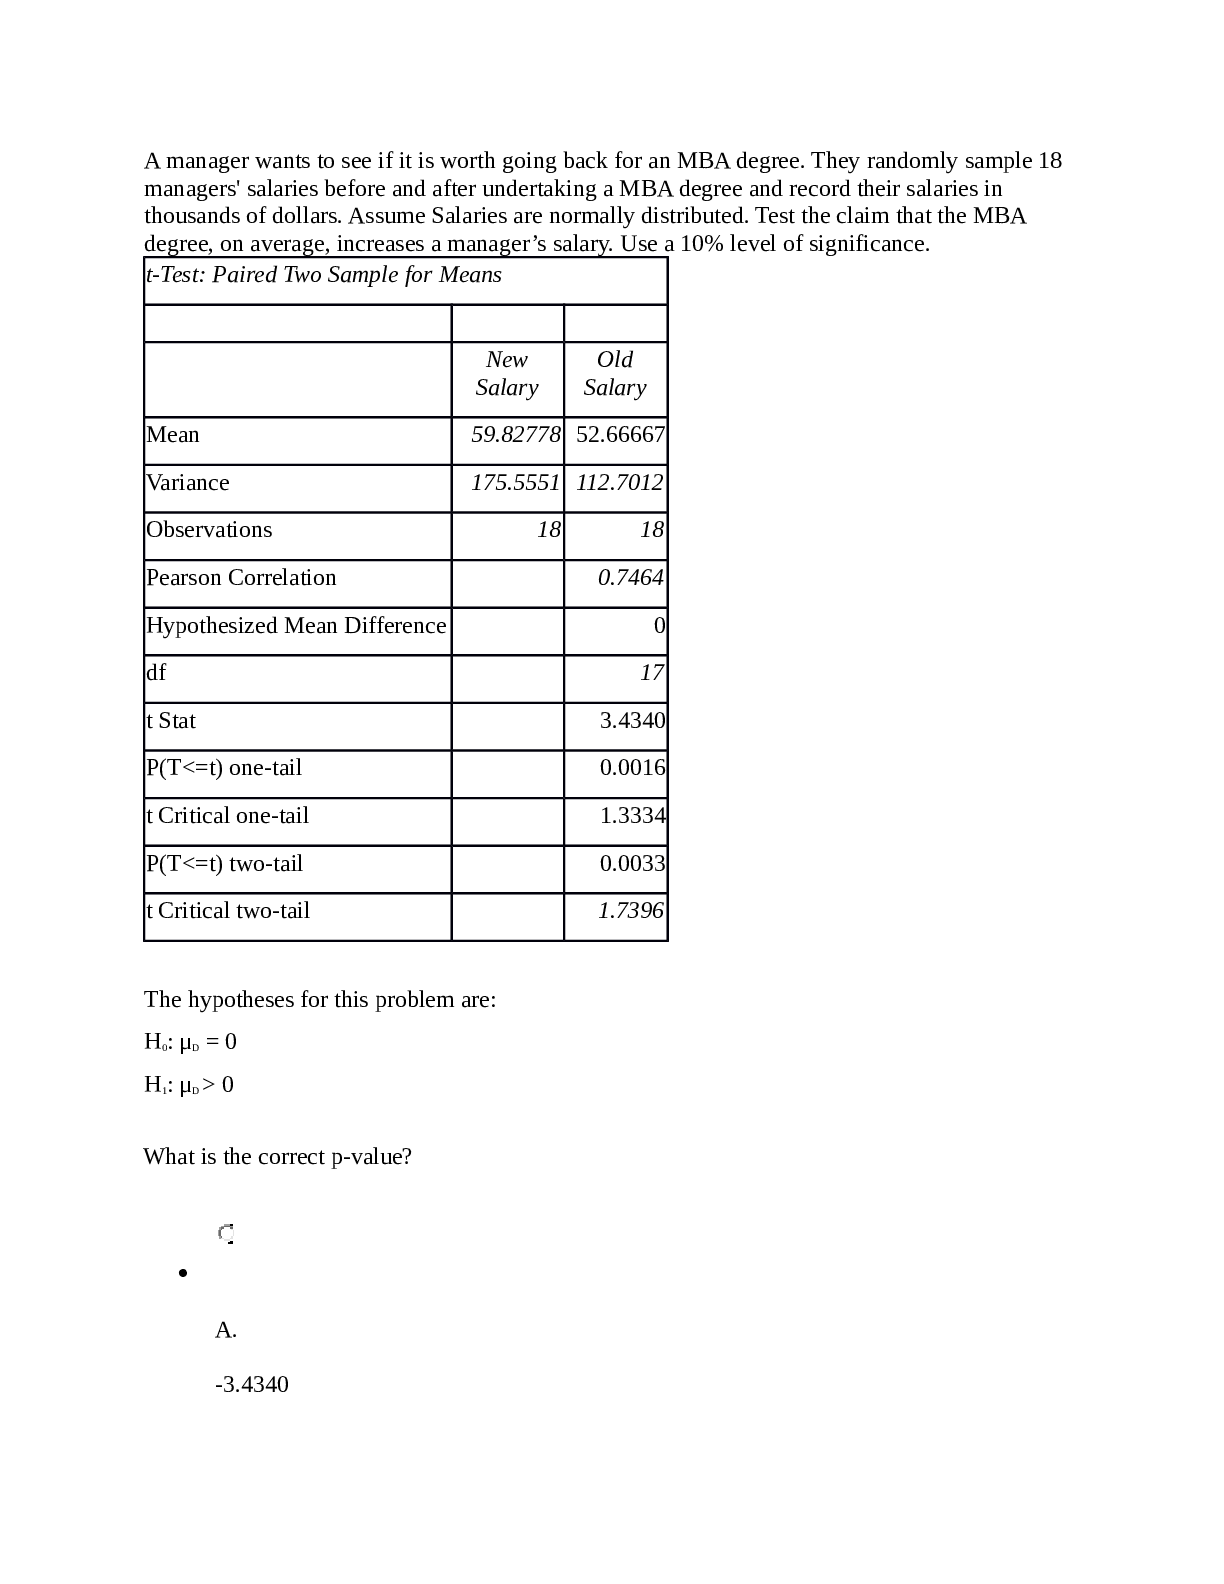
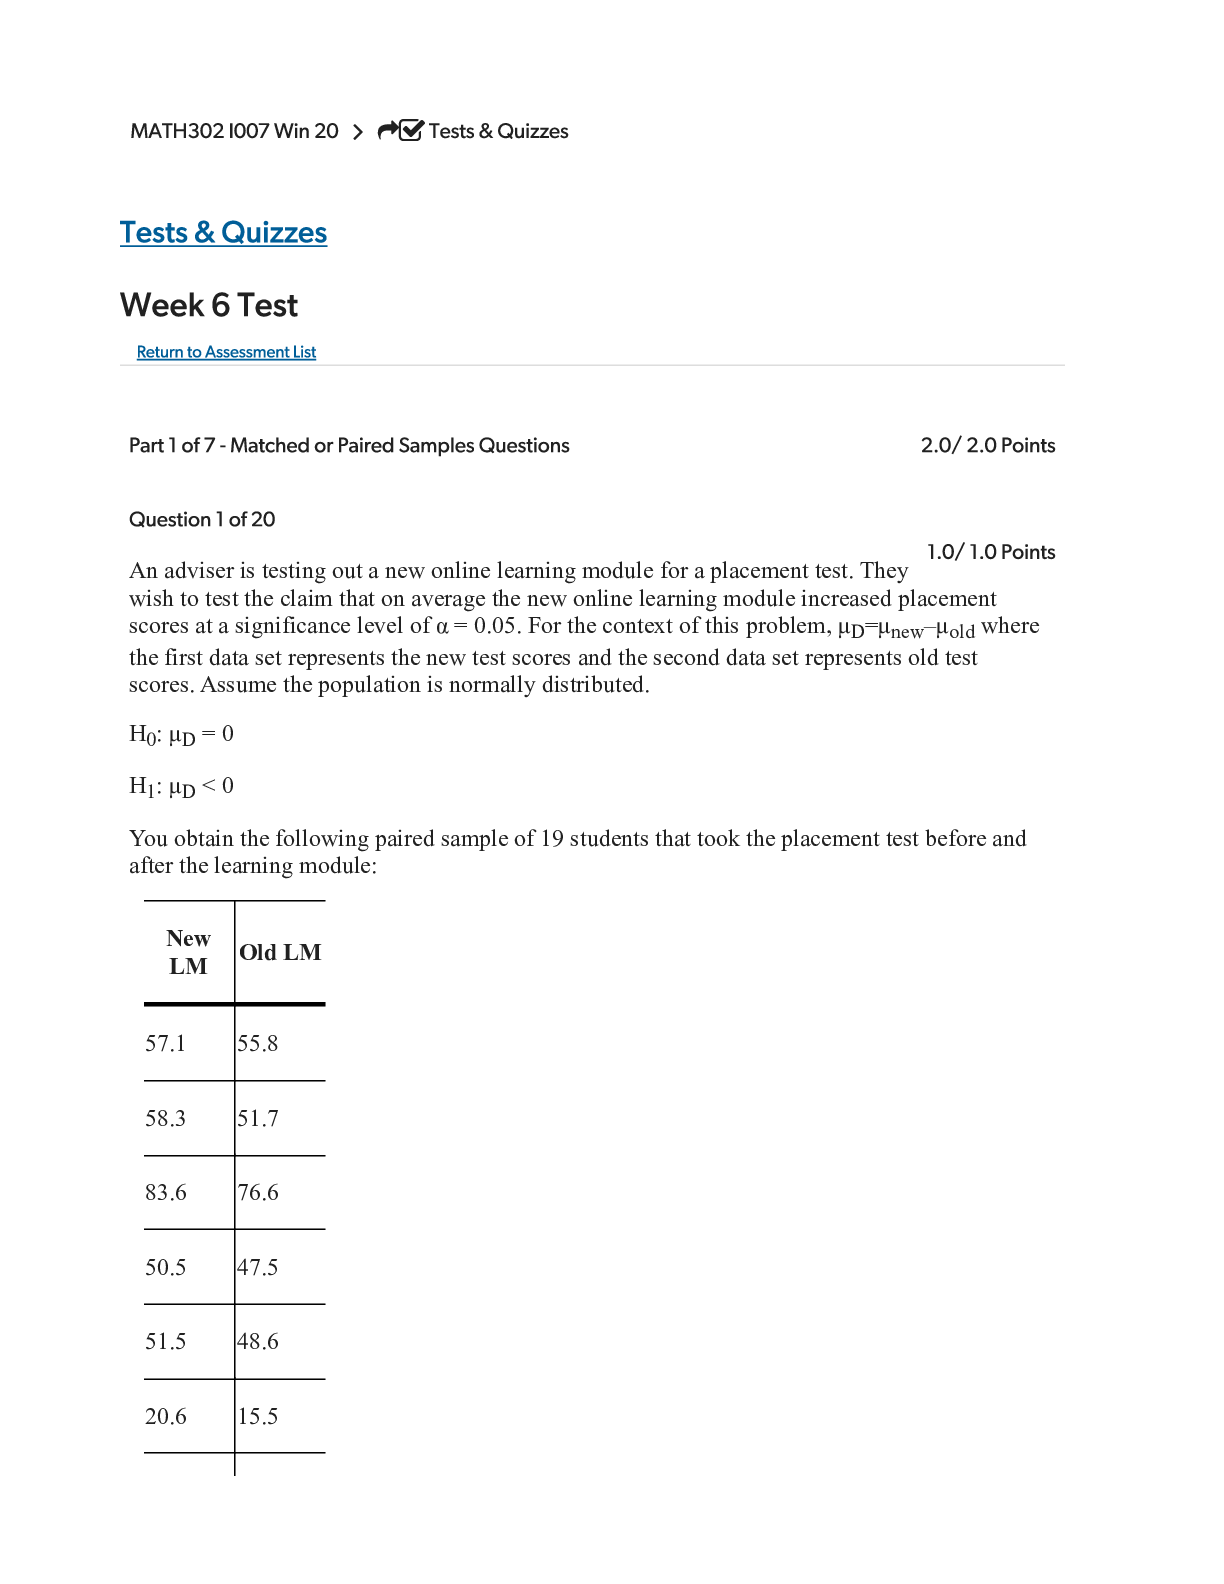
A manager wants to see if it is worth going back for an MBA degree. They randomly sample 18 managers' salaries before and after undertaking a MBA degree and record their salaries in thousands of dol... lars. Assume Salaries are normally distributed. Test the claim that the MBA degree, on average, increases a manager’s salary. Use a 10% level of significance. t-Test: Paired Two Sample for Means New Salary Old Salary Mean 59.82778 52.66667 Variance 175.5551 112.7012 Observations 18 18 Pearson Correlation 0.7464 Hypothesized Mean Difference 0 df 17 t Stat 3.4340 P(T<=t) one-tail 0.0016 t Critical one-tail 1.3334 P(T<=t) two-tail 0.0033 t Critical two-tail 1.7396 The hypotheses for this problem are: H0: μD = 0 H1: μD > 0 What is the correct p-value? A. -3.4340 B. -1.3334 C. 0.0033 D. 0.0016 E. 0.7464 Answer Key:D Feedback: No calculations are needed. The answer is given to you in the output. P(T<=t) one-tail 0.0016 Question 2 of 20 0.0/ 1.0 Points An adviser is testing out a new online learning module for a placement test. They wish to test the claim that on average the new online learning module increased placement scores at a significance level of α = 0.05. For the context of this problem, μD=μnew–μold where the first data set represents the new test scores and the second data set represents old test scores. Assume the population is normally distributed. H0: μD = 0 H1: μD < 0 You obtain the following paired sample of 19 students that took the placement test before and after the learning module: Choose the correct decision and summary and state the p-value. New LM Old LM 58.1 55.8 58.3 53.7 83.6 76.6 49.5 47.5 51.8 48.9 20.6 11.4 35.2 30.6 46.7 54 22.5 21 47.7 58.5 51.5 42.6 76.6 61.2 29.6 26.8 14.5 12.5 43.7 56.3 57 43.1 66.1 72.8 38.1 42.2 42.4 51.3 A. Reject H0, there is not enough evidence to support the claim that on average the new online learning module increased placement scores, the p-value = 0.2266. B. Do not reject H0, there is not enough evidence to support the claim that on average the new online learning module increased placement scores, the p-value = 0.4533. C. Reject H0, there is enough evidence to support the claim that on average the new online learning module increased placement scores, the p-value = 0.4533. D. Do not reject H0, there is not enough evidence to support the claim that on average the new online learning module increased placement scores, the p-value = 0.2266 Answer Key:D Feedback: Copy and paste the data into Excel. Use the Data Analysis Toolpak in Excel. Data - > Data Analysis -> scroll to where is says t:Test: Paired Two Samples for Means -> OK Variable 1 Range: is New LM Variable 2 Range: is Old LM The Hypothesized Mean Difference is 0 and make sure you click Labels in the first row and click OK. You will get an output and this is the p-value you are looking for. P(T<=t) one-tail 0.2266 Part 2 of 7 - Week 6: Comparing Two Independent Population Proportions 2.0/ 3.0 Points Question 3 of 20 0.0/ 1.0 Points Two competing toothpaste brands both claim to produce the best toothpaste for whitening. A dentist randomly samples 48 patients that use Brand A (Group 1) and finds 30 of them are satisfied with the whitening results of the toothpaste. She then randomly samples 45 patients that use Brand B (Group 2) and finds 33 of them are satisfied with the whitening results of the toothpaste. Construct a 99% confidence interval for the difference in proportions and use it to decide if there is a significant difference in the satisfaction level of patients. Enter the confidence interval - round to 3 decimal places. 0.356 < p1 - p2 < 0.319 Answer Key:-0.356|-.356, 0.139|.139 Feedback: Z-Critical Value =NORM.S.INV(.995) = 2.575 LL = (.625-.7333) - 2.575* UL = (.625-.7333) + 2.575* Question 4 of 20 1.0/ 1.0 Points A researcher took a random sample of 200 new mothers in the United States (Group 1) and found that 16% of them experienced some form of postpartum depression. Another random sample of 200 new mothers in France (Group 2), where mothers receive 16 weeks of paid maternity leave, found that 11% experienced some form of postpartum depression. Can it be concluded that the percent of women in the United States experience more postpartum depression than the percent of women in France? Use α=0.05. Select the correct alternative hypothesis and decision . A. H1: p1 ≠ p2; Do not reject the null hypothesis. B. H1: p1 ≠ p2; Reject the null hypothesis. C. H1: p1 > p2; D [Show More]
Last updated: 1 year ago
Preview 1 out of 23 pages
Instant download
Buy this document to get the full access instantly
Instant Download Access after purchase
Add to cartInstant download
Reviews( 0 )
Document information
Connected school, study & course
About the document
Uploaded On
Jan 27, 2023
Number of pages
23
Written in

Additional information
This document has been written for:
Uploaded
Jan 27, 2023
Downloads
0
Views
27
.png)
.png)
.png)


.png)
.png)