Mathematics > QUESTION PAPER (QP) > Pearson Edexcel Level 3 GCE [Mathematics Advanced Subsidiary PAPER 21: Statistics] (All)
Pearson Edexcel Level 3 GCE [Mathematics Advanced Subsidiary PAPER 21: Statistics]
Document Content and Description Below
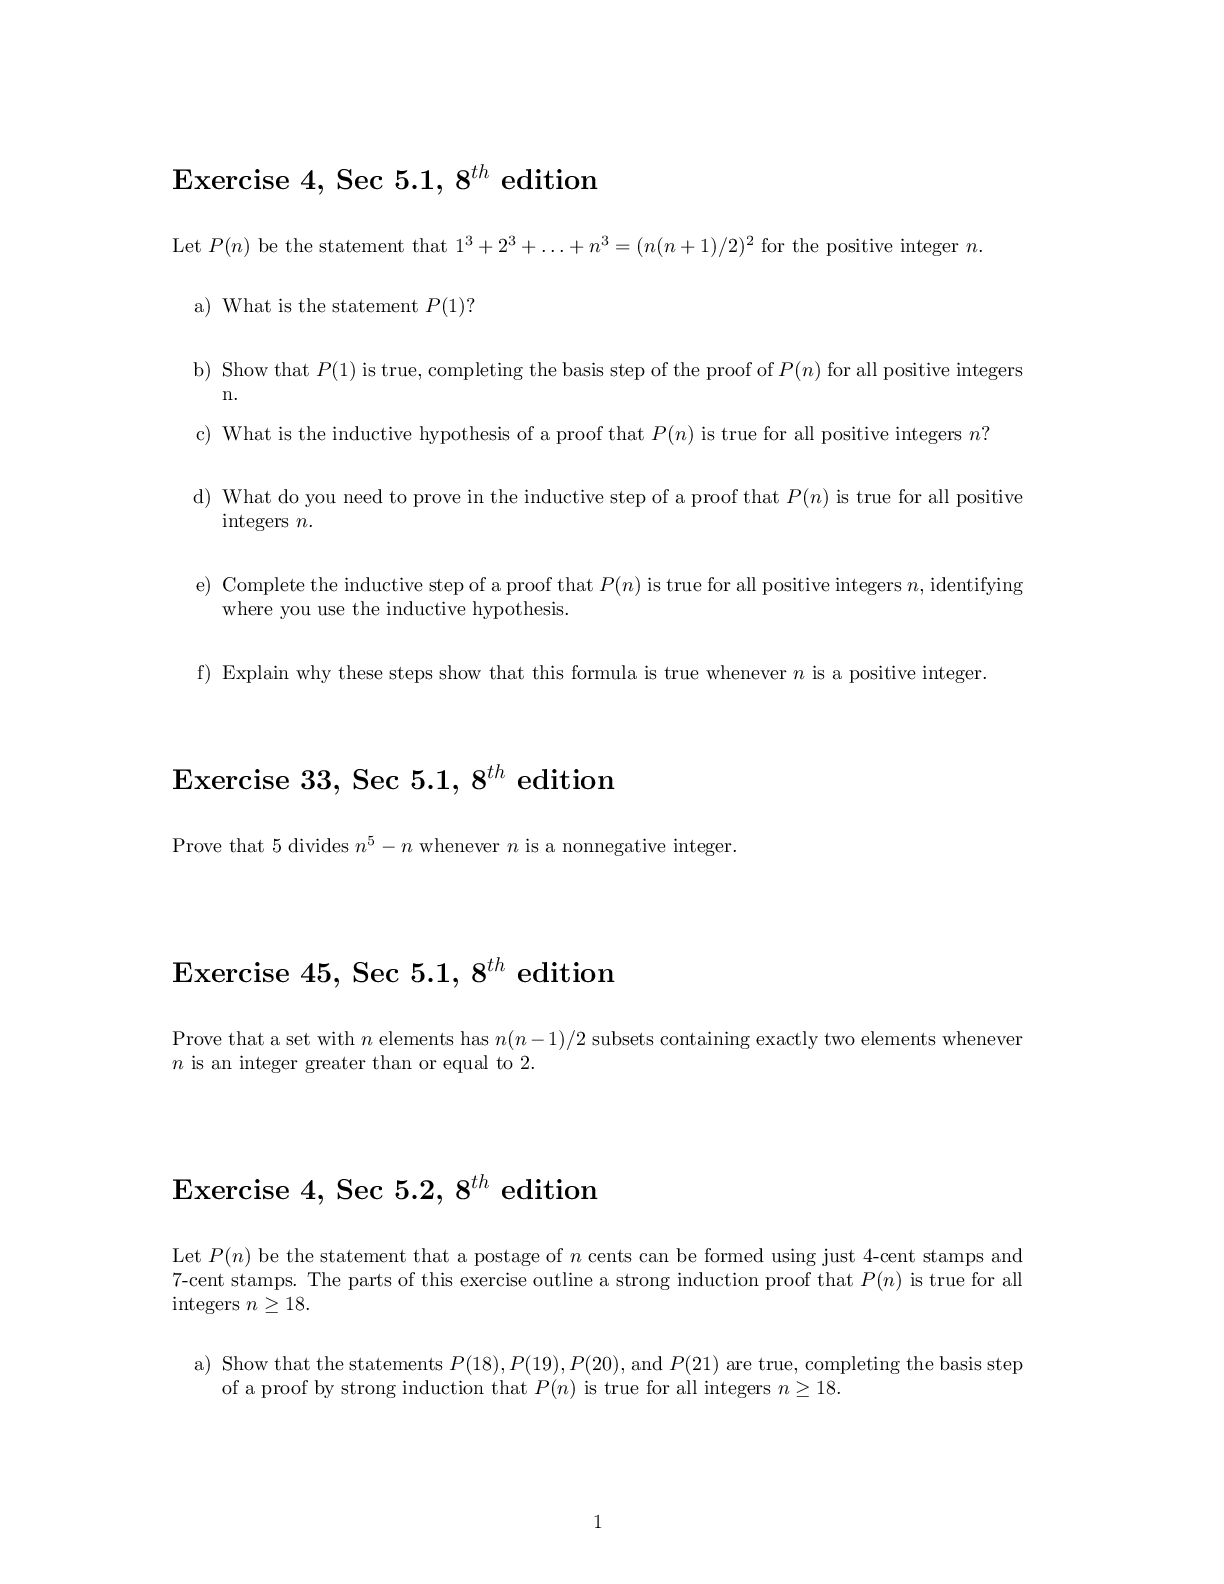
1. The relationship between two variables p and t is modelled by the regression line with equation p = 22 – 1.1 t The model is based on observations of the independent variable, t, between 1 and... 10 (a) Describe the correlation between p and t implied by this model. (1) Given that p is measured in centimetres and t is measured in days, (b) state the units of the gradient of the regression line. (1) Using the model, (c) calculate the change in p over a 3‑day period. (2) Tisam uses this model to estimate the value of p when t = 19 (d) Comment, giving a reason, on the reliability of this estimate. [Show More]
Last updated: 1 year ago
Preview 1 out of 12 pages
Buy this document to get the full access instantly
Instant Download Access after purchase
Add to cartInstant download
We Accept:

Reviews( 0 )
$5.00
Document information
Connected school, study & course
About the document
Uploaded On
Feb 01, 2023
Number of pages
12
Written in

Additional information
This document has been written for:
Uploaded
Feb 01, 2023
Downloads
0
Views
55