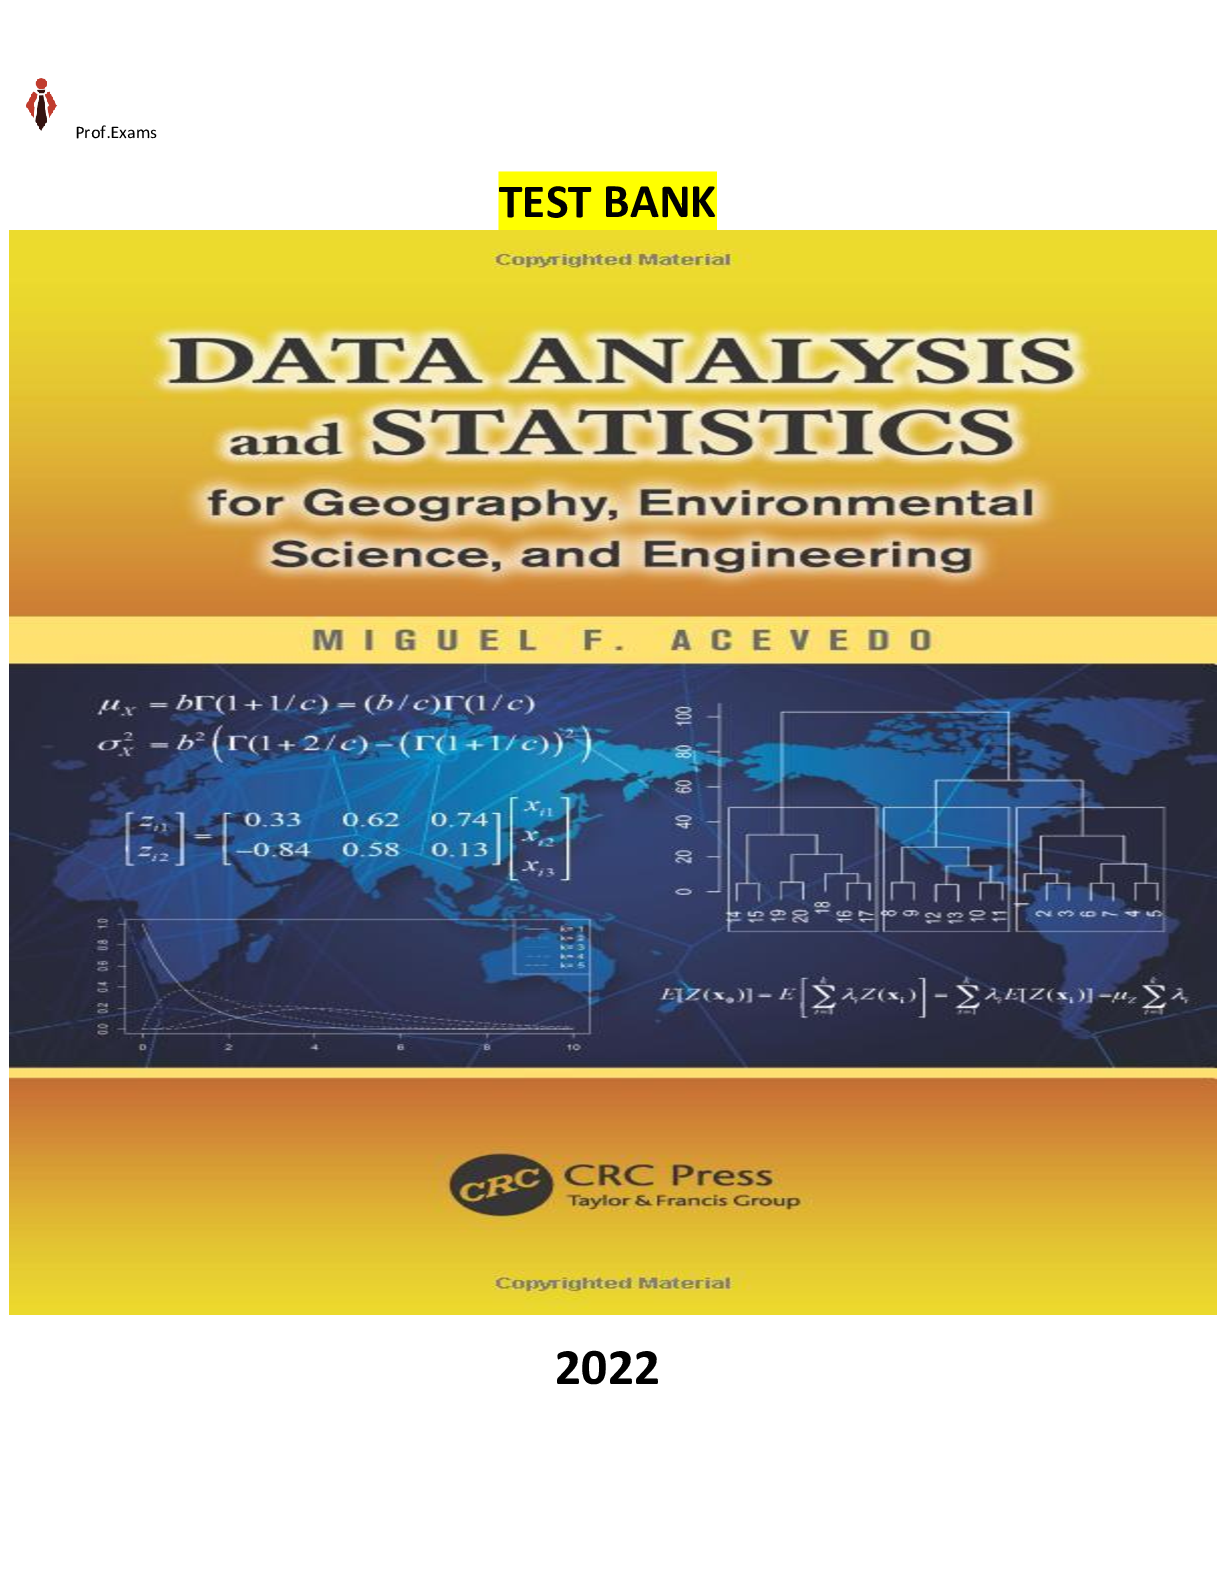
DATA ANALYSIS > TEST BANK > COMPLETE - Elaborated Test Bank for Data Analysis and Statistics for Geography, Environmental Scienc (All)
COMPLETE - Elaborated Test Bank for Data Analysis and Statistics for Geography, Environmental Science, and Engineering 1Ed.by Miguel F. Acevedo.ALL Chapters1-15(220 pages) included and updated for 2023
Document Content and Description Below
COMPLETE - Elaborated Test Bank for Data Analysis and Statistics for Geography, Environmental Science, and Engineering 1Ed.by Miguel F. Acevedo.ALL Chapters1-15(220 pages) included and updated for 20... 23 COMPLETE - Elaborated Test Bank for Data Analysis and Statistics for Geography, Environmental Science, and Engineering 1Ed.by Miguel F. Acevedo.ALL Chapters1-15(220 pages) included and updated for 2023 Data Analysis and Statistics for Geography, Environmental Science, and Engineering 1Ed.by Miguel F. Acevedo Chapter 1 - Introduction Chapter 2 - Probability Theory Chapter 3 - Random Variables, Distributions, Moments, and Statistics Chapter 4 - Exploratory Analysis and Introduction to Inferential Statistics Chapter 5 - More on Inferential Statistics: Goodness of Fit, Contingency Analysis, and Analysis of Variance Chapter 6 - Regression Chapter 7 - Stochastic or Random Processes and Time Series Chapter 8 - Spatial Point Patterns Chapter 9 - Matrices and Linear Algebra Chapter 10 - Multivariate Models Chapter 11 - Dependent Stochastic Processes and Time Series Chapter 12 - Geostatistics: Kriging Chapter 13 - Spatial Auto-Correlation and Auto-Regression Chapter 14 - Multivariate Analysis I: Reducing Dimensionality Chapter 15 - Multivariate Analysis II: Identifying and Developing Relationships among Observations and Variables Chapter 1 Introduction Exercise 1-1 Use a variable X to denote human population on Earth. Explain why it varies in time and space and give examples of a value at a particular location or region and time. Solution: Human population can be considered a variable that takes discrete values and it varies in continuous time due to deaths and births. An example is X(t)=6,23 × 10° people or 6,23 billion people at time t. Exercise 1-2 Suppose you build a model of light transmission through a forest canopy using measured light (treated as dependent variable) at various heights (treated as independent variable) and use it to predict light at those heights where is not measured. Would this be a process-based model or an empirical model? Solution: This will be an empirical model because it relates all pairs of sunlight and height values and using a predictor equation (for example, regression) will develop a prediction of sunlight at each height. Exercise 1-3 Extend exercise 1-2 to use the concept from physics that light is attenuated as it goes through a medium. Propose that attenuation is proportional to the density of foliage at various heights, and then propose a model based on an equation before you collect data. Would this be a process-based model or an empirical model? Solution: To make sure you understand the workspace. Save your workspace .Rdata file. Then close R and start a new R session, Load the workspace, make sure you have the objects created before. Solution: Just proceed as indicated. Exercise 1-5 Use the notepad or Vim to create a simple text file myfile.txt. Type 10 numbers in a row separated by a blank space, trying to type numbers around a value of 10. Save in folder lab1. Now read the file using scan, calculate sample mean, variance, and standard deviation, plot a stem-and-leaf diagram and a histogram and discuss. Solution: The solution details vary according to the numbers created by each student. Suppose one possible solution is x <- scan("lab1/myfile.txt") length(x) stem(x) hist(x) round(mean(x),1) round(var(x),1) round(sd(x),1) On the console obtain > x <- scan("lab1/myfile.txt") Read 10 items > length(x) [1] 10 > stem(x) The decimal point is at the | 9 | 2 9 | 5678 6 10 | 11233 > hist(x) > round(mean(x),1) [1] 9.9 > round(var(x),1) [1] 0.1 > round(sd(x),1) [1] 0.4 > On the graphics window obtain Exercise 1-6 Use file lab1\exercise.csv. Examine the file contents using the notepad or Vim. Read the file, list numbers on the R Console rounding to 2 decimals. Calculate sample mean, variance, and standard deviation, plot a stem-and-leaf diagram and a histogram and discuss. Solution: Histogram of xxFrequency9.29.49.69.810.010.210.40.00.51.01.52.02.53.0 7 Then > x.ex <- scan("lab1/exercise.csv",sep=",") Read 100 items > round(x.ex,2) [1] 0.58 2.30 1.44 0.35 0.04 1.58 0.18 1.08 1.38 2.33 1.41 0.35 0.30 0.11 2.84 [16] 2.79 0.94 0.63 0.21 0.31 2.11 1.25 0.56 0.56 1.41 2.66 0.96 2.70 0.29 0.42 [31] 1.26 0.11 0.45 0.80 0.42 1.04 0.39 0.08 2.52 0.74 2.75 1.45 0.52 1.11 0.51 [46] 0.31 2.96 0.08 0.24 1.01 0.87 3.62 0.03 0.67 1.65 1.12 0.72 0.33 0.38 0.25 [61] 1.30 0.51 0.78 2.56 0.02 0.31 0.14 0.15 0.35 1.72 0.67 0.19 0.84 1.33 3.28 [76] 0.24 0.64 0.52 3.86 0.38 0.35 2.39 2.15 1.25 0.05 1.17 2.10 0.12 1.14 0.31 [91] 1.30 1.31 0.14 0.35 0.56 0.47 0.26 0.88 0.13 1.10 > Now > round(mean(x.ex),2) [1] 1 > round(var(x.ex),2) [1] 0.82 > round(sd(x.ex),2) [1] 0.91 > stem(x.ex) The decimal point is at the | 0 | 0001111111111222222333333333344444444 0 | 5555556666667777888999 1 | 000111112233333344444 1 | 667 2 | 111334 8 2 | 5677888 3 | 03 3 | 69 > Finally hist(x.ex) Exercise 1-7 Separate the first 20 and last 20 elements of salinity x array into two objects. Plot a stem-and-leaf plot and a histogram for each. Solution: > x1<- x[1:20] Histogram of x.exx. [Show More]
Last updated: 1 year ago
Preview 1 out of 220 pages
Reviews( 0 )
Document information
Connected school, study & course
About the document
Uploaded On
Apr 14, 2023
Number of pages
220
Written in
Additional information
This document has been written for:
Uploaded
Apr 14, 2023
Downloads
0
Views
54

