Engineering > QUESTIONS & ANSWERS > Georgia Institute Of Technology ISYE 6501X5282019. Midterm Quiz 1 - Audit Learners _ Midterm Quiz 1_ (All)
Georgia Institute Of Technology ISYE 6501X5282019. Midterm Quiz 1 - Audit Learners _ Midterm Quiz 1_Answers.
Document Content and Description Below
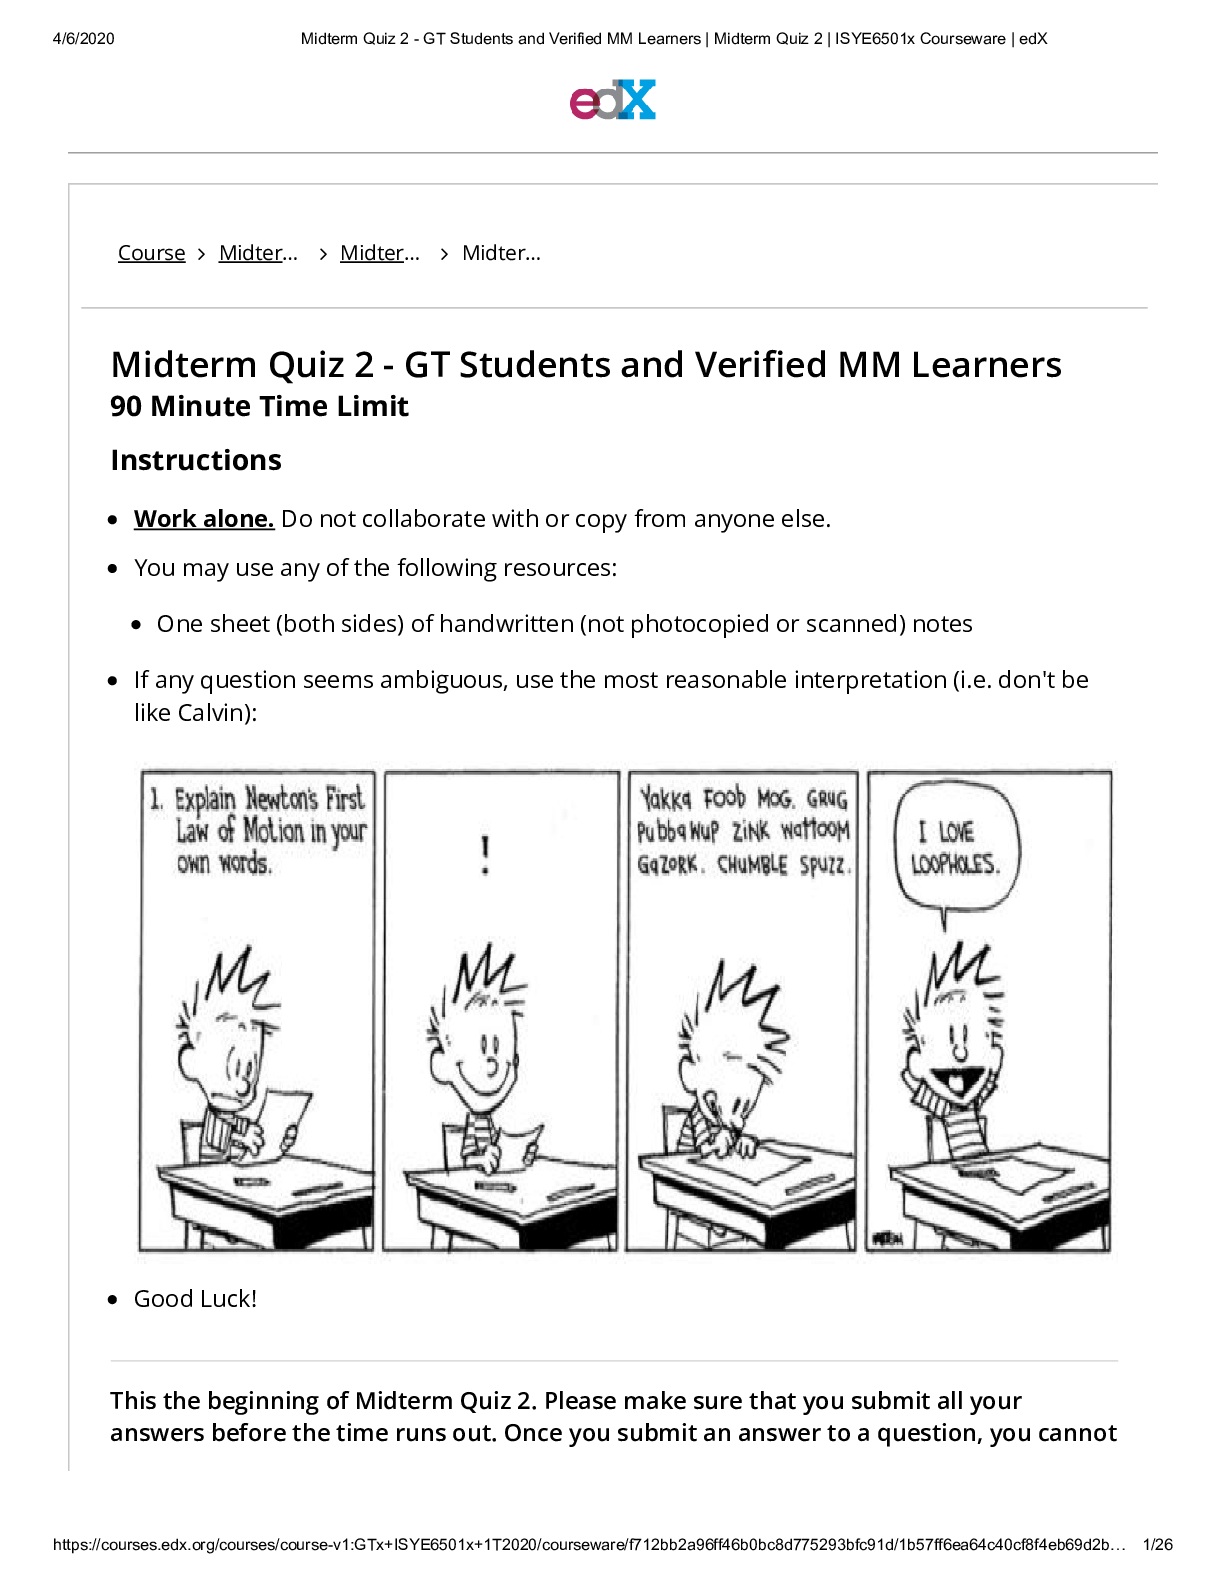
Midterm Quiz 1 - Audit Learners | Midterm Quiz 1 - Audit Learners | ISYE6501x Course Midterm Quiz 1 Midterm Quiz 1 - A… Midterm Quiz 1 - A… Midterm Quiz 1 - Audit Learners 90 Minute Time Limit... Instructions Work alone. Do not collaborate with or copy from anyone else. You may use any of the following resources: One sheet (both sides) of handwritten (not photocopied or scanned) notes If any question seems ambiguous, use the most reasonable interpretation (i.e. don't be like Calvin): 5/28/2019 Midterm Quiz 1 - Audit Learners | Midterm Quiz 1 - Audit Learners | ISYE6501x Courseware | edX Good Luck! Question 1 13 points possible (graded) Keyboard Help Drag each model to a type of question it is commonly used for. For models that have more than one correct answer, choose any one correct answer; for models that have no correct answer listed, do not drag them. ARIMA CART Cross validation CUSUM Exponential smoothing GARCH k-means k-nearest-neighbor Linear regression Logistic regression Principal component analysis5/28/2019 Midterm Quiz 1 - Audit Learners | Midterm Quiz 1 - Audit Learners | ISYE6501x Courseware | edX Submit You have used 0 of 1 attempts. Random forest Support vector machine5/28/2019 Midterm Quiz 1 - Audit Learners | Midterm Quiz 1 - Audit Learners | ISYE6501x Courseware | edX Question 2 points (graded) Select all of the following models that are designed for use with time series data: You have used 0 of 1 attempt FEEDBACK Drag the items onto the image above. Reset Show Answer ARIMA CUSUM Exponential Smoothing GARCH k-nearest-neighbor Submit5/28/2019 Midterm Quiz 1 - Audit Learners | Midterm Quiz 1 - Audit Learners | ISYE6501x Answers are displayed within the problem INFORMATION FOR QUESTIONS 3A, 3C FIGURES A AND B SHOW THE TRAINING DATA FOR A CLASSIFICATION PROBLEM, USING TWO PREDICTORS (X AND X ) TO SEPARATE BETWEEN BLACK AND WHITE POINTS. THE DASHED LINES ARE THE CLASSIFIERS. Figure A Figure B Question 3a points (graded) Figure B shows an SVM classiÕcation using a complex nonlinear kernel. (To get this perfect Õt to the training data, it required 1 25/28/2019 Midterm Quiz 1 - Audit Learners | Midterm Quiz 1 - Audit Learners | ISYE6501x Courseware | edX Answers are displayed within the problem g g p ( g p g , q Õtting 16 parameter values!) Which of the following is true? You have used 0 of 1 attempt INFORMATION FOR QUESTIONS 3B, 3C Figure B is a very good classiÕer, because it correctly classiÕes all of the training data. Figure B is a very good classiÕer, because the model’s complexity shows that it is a deep analysis. Figure B is a bad classiÕer to use, because it is overÕt. Figure B might or might not be a good classiÕer, because it is overÕt. Submit 5/28/2019 Midterm Quiz 1 - Audit Learners | Midterm Quiz 1 - Audit Learners | ISYE6501x FIGURE C Question 3b 3 points possible (graded) Keyboard Help PROBLEM Figure C shows a classiÕcation that was found by a classiÕcation tree model. Drag the components of the classiÕcation tree into their correct places so that your tree gives the same classiÕcation shown in Figure C.5/28/2019 Midterm Quiz 1 - Audit Learners | Midterm Quiz 1 - Audit Learners | ISYE6501x Question 3c FEEDBACK Drag the items onto the image above. Submit You have used 0 of 1 attempts. Reset Show Answer5/28/2019 Midterm Quiz 1 - Audit Learners | Midterm Quiz 1 - Audit Learners | ISYE6501x Courseware | edX Answers are displayed within the problem 0.0/4.0 points (graded) Select all of the following models that would classify the point (3,3) as white: You have used 0 of 1 attempt Question 3d points (graded) Figure A Figure B Figure C k-nearest-neighbor classiÕcation with k=7 Submit 5/28/2019 Midterm Quiz 1 - Audit Learners | Midterm Quiz 1 - Audit Learners | ISYE6501x Answers are displayed within the problem In the soft classiÕcation SVM model where we select coeÞcients ... to minimize if we want to have a larger margin even though it means possibly having more classiÕcation error, the value of should get You have used 0 of 1 attempt INFORMATION FOR QUESTIONS 4A, 4B Seven diàerent regression models have been Õtted, using diàerent sets of variables. The Õgure below shows the resulting adjusted R-squared value for various models, as measured by cross-validation. Larger Smaller It’s irrelevant Submit 5/28/2019 Midterm Quiz 1 - Audit Learners | Midterm Quiz 1 - Audit Learners | ISYE6501x Courseware | edX Question 4a points (graded) Just looking at the Õgure, if you don’t know anything about the predictors, response, etc., which model looks best: 1, 2, 3, 4, 5, 6, or 7? Enter a one-digit answer (1,2,3,4,5,6,or 7)5/28/2019 Midterm Quiz 1 - Audit Learners | Midterm Quiz 1 - Audit Learners | ISYE6501x Courseware | edX Answers are displayed within the problem Answers are displayed within the problem Answer: 2 You have used 0 of 1 attempt Question 4b points (graded) Which model would you suggest if the regression predicts the eàect of sunspots on the earth’s temperature two months in the future, and variable is something that is not known until a month after the sunspots appear? Enter a one-digit answer (1,2,3,4,5,6,or 7) Answer: 1 You have used 0 of 1 attempt INFORMATION FOR QUESTION 4C Submit 6 Submit 5/28/2019 Midterm Quiz 1 - Audit Learners | Midterm Quiz 1 - Audit Learners | ISYE6501x The table below shows the Akaike Information Criterion (AIC), Corrected AIC, and Bayesian Information Criterion (BIC) for each of the models. Model AIC Corrected AIC BIC Question 4c points (graded) Based on the table above, select all of the following statements that are correct. All three metrics (AIC, Corrected AIC, BIC) pick the same model as best. Among models 1 and 2, AIC suggests that model 1 is {(−5.67−(−5.58))/2 = 95.6% as likely as model 2 to be better. 5/28/2019 Midterm Quiz 1 - Audit Learners | Midterm Quiz 1 - Audit Learners | ISYE6501x Courseware | edX Answers are displayed within the problem You have used 0 of 1 attempt INFORMATION FOR ALL PARTS OF QUESTION 5 Atlanta’s main library has collected the following day-by-day data over the past six years (more than 2000 data points): x = Number of books borrowed from the library on that day x = Day of the week x = Temperature x = Amount of rainfall x = Whether the library was closed that day x = Whether public schools were open that day Question 5a 0.0/2.0 points (graded) Select all data that are categorical (including binary data): BIC suggests that model 1 is very likely to be better than model 7. Submit 1 2 3 4 5 6 Number of books borrowed from the library on that day5/28/2019 Midterm Quiz 1 - Audit Learners | Midterm Quiz 1 - Audit Learners | ISYE6501x Courseware | edX Answers are displayed within the problem You have used 0 of 1 attempt INFORMATION FOR QUESTIONS 5B, 5C The library believes that if more books were borrowed yesterday, fewer will be borrowed today (and vice versa), so they add a new predictor: = the number of books borrowed the day before. Question 5b Day of the week Temperature Amount of rainfall Whether the library was closed that day Whether public schools were open that day Submi 75/28/2019 Midterm Quiz 1 - Audit Learners | Midterm Quiz 1 - Audit Learners | ISYE6501x Answers are displayed within the problem 0.0/2.0 points (graded) What is the term for using this type of predictor? You have used 0 of 1 attempt Question 5c 0.0/2.0 points (graded) If the library is correct that on average, if more books were borrowed yesterday, fewer will be borrowed today (and vice versa), what sign (positive or negative) would you expect the new predictor's coeÞcient to have? Autoregressive Heteroscedastic Markovian Quadratic Submit w7 Positive, because higher values of 7 increase the response (books borrowed today)5/28/2019 Midterm Quiz 1 - Audit Learners | Midterm Quiz 1 - Audit Learners | ISYE6501x Courseware | edX Answers are displayed within the problem You have used 0 of 1 attempt Information for Question 5d The library believes that as the temperature gets either too cold or too hot, more people come indoors to the library to borrow books. They have Õt the data to a quadratic function (see the Õgure below). Positive, because the response (books borrowed today) is a positive number Negative, because higher values Submit 5/28/2019 Midterm Quiz 1 - Audit Learners | Midterm Quiz 1 - Audit Learners | ISYE6501x Question 5d 0.0/4.0 points (graded) How would you incorporate the new information above into the library's regression model? Change the model to estimate the square root of the books borrowed, as a function of temperature, day of the week, inches of rainfall, whether the day is a holiday, and whether schools were open. Replace the temperature variable with a (temperature)2 variable in the model. Add a (temperature)2 variable to the model.5/28/2019 Midterm Quiz 1 - Audit Learners | Midterm Quiz 1 - Audit Learners | ISYE6501x Courseware | edX 19/31 You have used 0 of 1 attempt Question 5e (3 parts) 0.0/9.0 points (graded) The library has built a triple exponential smoothing (Holt-Winters) model of the number of books borrowed each day, using a multiplicative weekly cycle of sesaonality (i.e., =7). i. The library is closed every year on July 4, so no books are borrowed that day. The model only has a weekly seasonality, not an annual one. Is the model likely to over-predict or under-predict books borrowed on July 4? ii. Is the model likely to over-predict or under-predict books borrowed on July 5? [Assume the library is open on July 5.] Submit h Over-predict Under-predict Neither Over-predict Under-predict 5/28/2019 Midterm Quiz 1 - Audit Learners | Midterm Quiz 1 - Audit Learners | ISYE6501x Courseware | edX Answers are displayed within the problem iii. Aside from seasonal and trend eàects, the library believes that the random variation in books borrowed each day is small. Should they expect the best value of to be: You have used 0 of 1 attempt INFORMATION FOR QUESTIONS 5F, 5G, 5H The library would like to compare the regression and exponential smoothing models to determine which is a better predictor, using the mean absolute error |(books borrowed) – (model’s estimate)| as a measure of prediction quality. Neither < 0 0 < < 1 2 1 < < 1 2 > 1 Submit 5/28/2019 Midterm Quiz 1 - Audit Learners | Midterm Quiz 1 - Audit Learners | ISYE6501x Courseware | edX Question 5g 4 points possible (graded) Keyboard Help PROBLEM Match each data set with its purpose. Drag the purpose next to the appropriate data set. Submit You have used 0 of 1 attempts. Reset Show Answer Compare all models & select best Estimate quality of selected model Fit parameters of all models5/28/2019 Midterm Quiz 1 - Audit Learners | Midterm Quiz 1 - Audit Learners | ISYE6501x Courseware | edX INFORMATION FOR QUESTION 5H The person who built these models discovered that although the exponential smoothing model performed better on the validation set, the regression model performed better on the test set (see table below). Mean absolute error (validation set) Mean absolute error (test set) Exponential smoothing model 124 139 Regression model 147 126 Question 5h 1 point possible (graded) Which of these is a valid suggestion: FEEDBACK Drag the items onto the image above. Use the exponential smoothing model, and assume its mean absolute error is about 124. Use the exponential smoothing model, and assume its mean absolute error is about 139. Use the regression model, and assume its mean absolute error is about 147.5/28/2019 Midterm Quiz 1 - Audit Learners | Midterm Quiz 1 - Audit Learners | ISYE6501x Courseware | edX Answers are displayed within the problem Question 5i points (graded) The library would like to determine whether there has been a decrease in the amount of borrowing over the past six years. Select all of the approaches that might reasonably be correct. You have used 0 of 1 attempt Use the regression model, and assume its mean absolute error is about 126. Submit CUSUM, using the actual data of books borrowed each day CUSUM, using the baseline o values from an exponential smoothing model Add a “days since start of the data set” predictor to the regression model and see whether it is signiÕcant and has a negative coeÞcient Submit5/28/2019 Midterm Quiz 1 - Audit Learners | Midterm Quiz 1 - Audit Learners | ISYE6501x Courseware | edX Answers are displayed within the problem INFORMATION FOR QUESTIONS 6A, 6B A logistic regression model was built to model the probability that a retailer’s inventory of a popular product will run out before the next delivery from the manufacturer, based on a number of factors (amount of current inventory, past demand, promotions, etc.). If the logistic regression’s output is greater than a threshold value p, the retailer pays an additional amount for a quick delivery to avoid running out. There are three confusion matrices below, for three diàerent threshold values of p: Question 6a 4 points possible (graded) Keyboard Help PROBLEM5/28/2019 Midterm Quiz 1 - Audit Learners | Midterm Quiz 1 - Audit Learners | ISYE6501x Courseware | edX Question 6b 0.0/4.0 points (graded) Let D be the cost of paying for a quick delivery (if the model's output is above p). Let C be the cost of running out of inventory. Drag C and D and 0 to write the expression for the total cost of using threshold value p=0.3. FEEDBACK Drag the items onto the image above. Submit You have used 0 of 1 attempts. Rest Show Answer C D 05/28/2019 Midterm Quiz 1 - Audit Learners | Midterm Quiz 1 - Audit Learners | ISYE6501x Answers are displayed within the problem The retailer’s primary goal right now is to build its market share, so it estimates the cost C of running out to be 10 times worse than the cost D of paying for an early delivery (i.e., C = 10D). Which threshold value of p would you suggest? You have used 0 of 1 attempt p = 0.3 p = 0.5 p = 0.7 Submit Question 7 8 points possible (graded) Keyboard Help The Õgures below each show a data set that will be used in k-means clustering algorithms (where distance between values is important). Each data set has two attributes. For each data set, drag to it the data preparations that are needed for k-means to work well on the data set. Outlier removal Scaling First outlier removal and then scaling First scaling and then outlier removal5/28/2019 Midterm Quiz 1 - Audit Learners | Midterm Quiz 1 - Audit Learners | ISYE6501x Courseware | edX Submit You have used 0 of 1 attempts. Reset Show Answer Neither outlier removal nor scaling5/28/2019 Midterm Quiz 1 - Audit Learners | Midterm Quiz 1 - Audit Learners | ISYE6501x Courseware | edX INFORMATION FOR QUESTIONS 8A, 8B A regression tree approach was used to describe the eàect of 7 diàerent covariates (x1 through x7) on monthly sales. The tree is shown below. In each model, only the signiÕcant covariates are shown. Questions 8a, 8b 0.0/8.0 points (graded) FEEDBACK Drag the items onto the image above.5/28/2019 Midterm Quiz 1 - Audit Learners | Midterm Quiz 1 - Audit Learners | ISYE6501x Courseware | edX a. Select all of the following statements that are true according to this regression tree: b. A random forest model was built for the same purpose, using the same 7 covariates. Which of the following statements are true? You have used 0 of 1 attempt The eàect of 7 is the same regardless of the values of 1 and 2 1 is only important when its value is small (less than 3.5) 2 is irrelevant when predicting monthly sales. 5 is irrelevant when predicting monthly sales. The regression tree can predict monthly sales better for values of above 3.5 than for values of smaller than 3.5. 1 1 The random forest model contains many trees with diàerent branchings. The random forest model uses many trees, but returns a single tree solution that can be analyzed The random forest model can report the relative importance of each variable. Submit5/28/2019 Midterm Quiz 1 - Audit Learners | Midterm Quiz 1 - Audit Learners | ISYE6501x Courseware | edX Answers are displayed within the problem INFORMATION FOR QUESTION 8C A data scientist has run principal component analysis on the 7 covariates, with the following results: Component Eigenvalue 1 2.20 2 0.12 3 0.10 4 0.09 5 0.08 6 0.06 7 0.05 Question 8c 0.0/4.0 points (graded) Because the Õrst eigenvalue is so much larger than the others, the data scientist uses just the Õrst principal component in a regression model. What is the largest number of original 7 covariates that can be represented in that Õrst principal component? 5/28/2019 Midterm Quiz 1 - Audit Learners | Midterm Quiz 1 - Audit Learners | ISYE6501x Courseware | edX © All Rights Reserved Answers are displayed within the problem Answer: 7 Submit You have used 0 of 1 attempt [Show More]
Last updated: 1 year ago
Preview 1 out of 31 pages
Instant download
Buy this document to get the full access instantly
Instant Download Access after purchase
Add to cartInstant download
Reviews( 0 )
Document information
Connected school, study & course
About the document
Uploaded On
Mar 03, 2021
Number of pages
31
Written in

Additional information
This document has been written for:
Uploaded
Mar 03, 2021
Downloads
0
Views
94


.png)
.png)