Mathematics > STUDY GUIDE > MATH225N Statistical Reasoning For The Health Sciences Statistic correlation and Y intercepts Quiz a (All)
MATH225N Statistical Reasoning For The Health Sciences Statistic correlation and Y intercepts Quiz answers, nailed all answers..
Document Content and Description Below
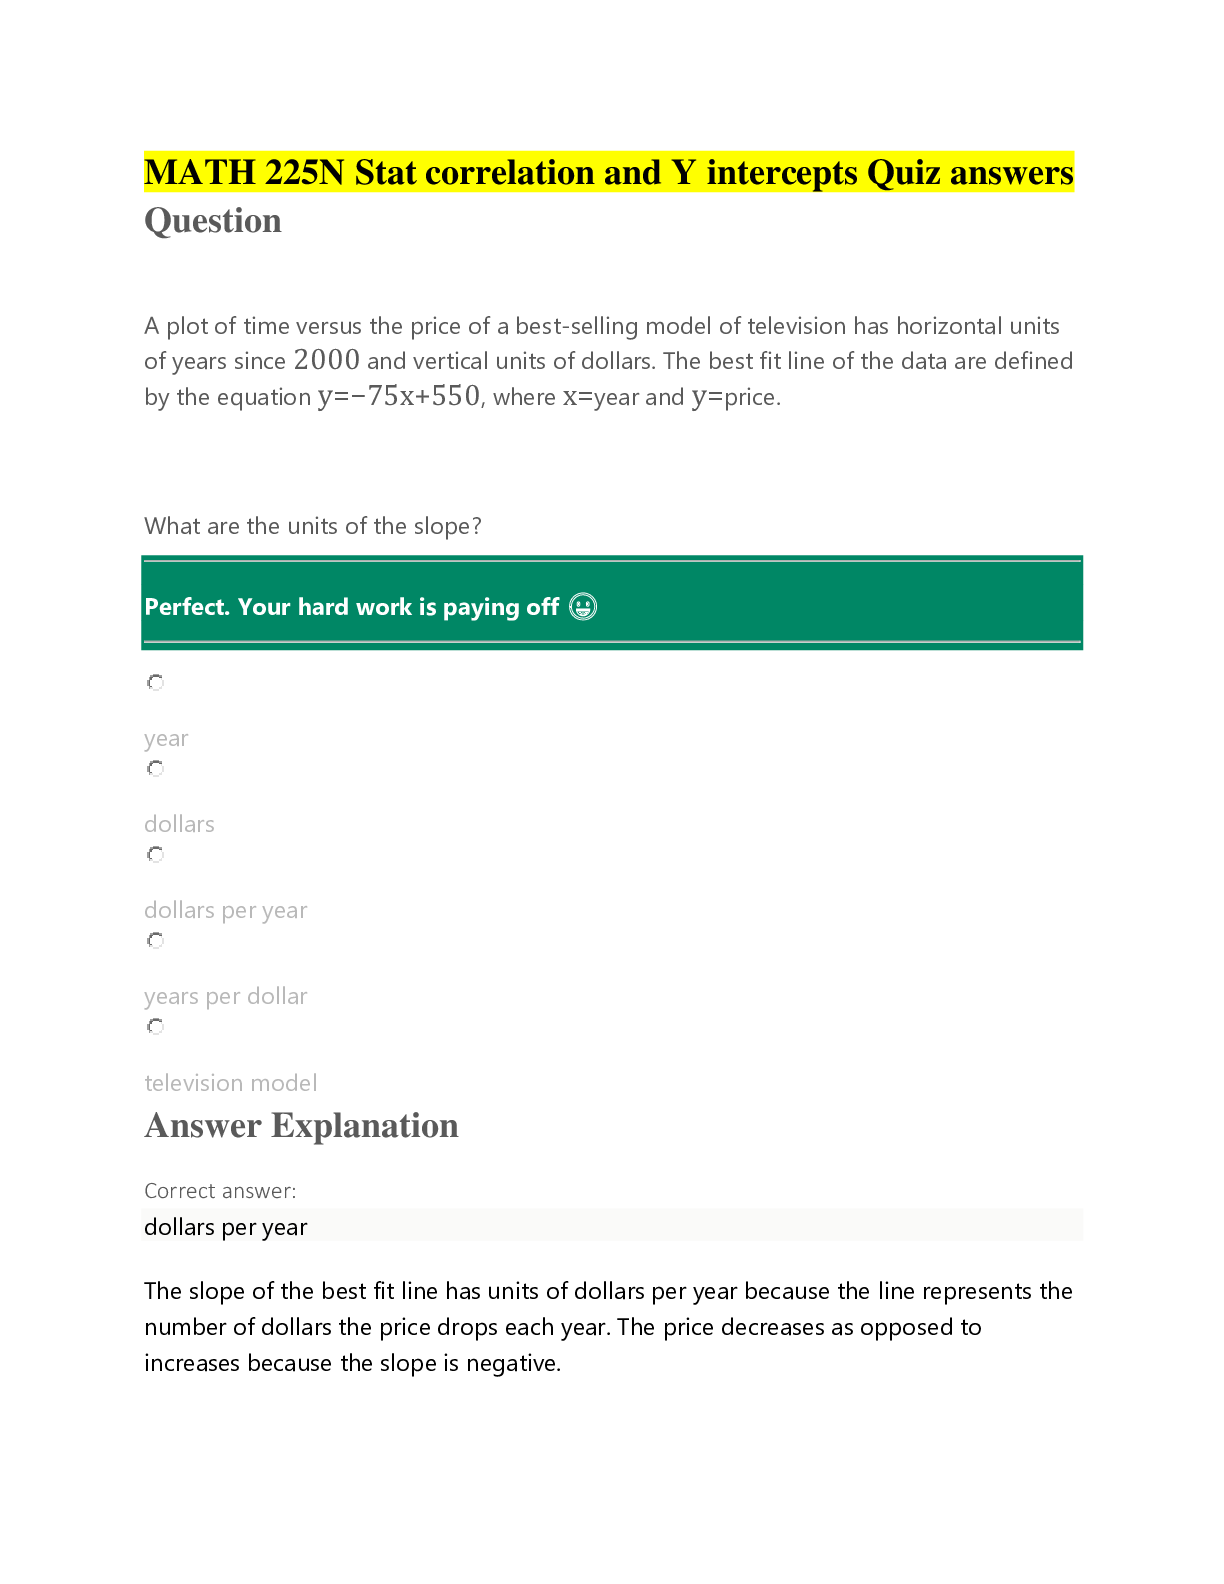
MATH 225N Stat correlation and Y intercepts Quiz answers Question A plot of time versus the price of a best-selling model of television has horizontal units of years since 2000 and vertical units... of dollars. The best fit line of the data are defined by the equation y=−75x+550, where x=year and y=price. What are the units of the slope? ________________________________________ ________________________________________ year dollars dollars per year years per dollar television model Question Which of the following data sets or plots could have a regression line with a negative y-intercept? Select all that apply. ________________________________________ ________________________________________ • the percent change in the land area in the arctic circle covered by ice as a function of the tons of CO2 produced by humans • ________________________________________ • the change in the square mileage in the arctic circle covered by ice as a function of the tons of CO2 produced by humans • ________________________________________ • the number of people living on a volcanic island as a function of the number of days since the last volcanic eruption • ________________________________________ • the difference in the number of ships launched by competing ship builders as a function of the number of months since the start of last year • ________________________________________ Question The scatter plot below shows the average cost of a designer jacket in a sample of years between 2000 and 2015. The least squares regression line modeling this data is given by yˆ=−4815+3.765x. ________________________________________ ________________________________________ The average cost of a designer jacket decreased by $3.765 each year between 2000 and 2015. The average cost of a designer jacket increased by $3.765 each year between 2000 and 2015. The average cost of a designer jacket decreased by $4815 each year between 2000 and 2015. The average cost of a designer jacket increased by $4815 each year between 2000 and 2015. Question The scatter plot below shows data for the average cost of a high-end computer (y, in dollars) in the year x years since 2000. The least squares regression line is given by yˆ=−1677+314x. ________________________________________ The predicted cost of a computer in the year 0 is −$1677. The predicted cost of a computer in the year 2000 is $314. The predicted cost of a computer in the year 2000 is $1677. The y-intercept should not be interpreted. Your answer: The predicted cost of a computer in the year 2000 is $1677. The y-intercept is a negative value: −1677. Question The scatter plot below shows the average cost of a designer jacket in a sample of years between 2000 and 2015. The least squares regression line modeling this data is given by yˆ=−4815+3.765x. ________________________________________ The y-intercept is −4815, which is not feasible because a product cannot have a negative cost. The y-intercept is 3.765, which is not feasible because an expensive product such as a designer jacket cannot have such a low cost. The y-intercept is −4815, which is feasible because it is the value from the regression equation. The y-intercept is 3.765 which is feasible because a product must have a positive cost. [Show More]
Last updated: 1 year ago
Preview 1 out of 7 pages
Instant download
Buy this document to get the full access instantly
Instant Download Access after purchase
Add to cartInstant download
Reviews( 0 )
Document information
Connected school, study & course
About the document
Uploaded On
Apr 26, 2020
Number of pages
7
Written in

Additional information
This document has been written for:
Uploaded
Apr 26, 2020
Downloads
0
Views
69