Mathematics > STUDY GUIDE > MATH 225N Week 4 Homework Questions Probability / MATH225N Week 4 Homework: Probability complete Que (All)
MATH 225N Week 4 Homework Questions Probability / MATH225N Week 4 Homework: Probability complete Questions & Answers (2020)
Document Content and Description Below
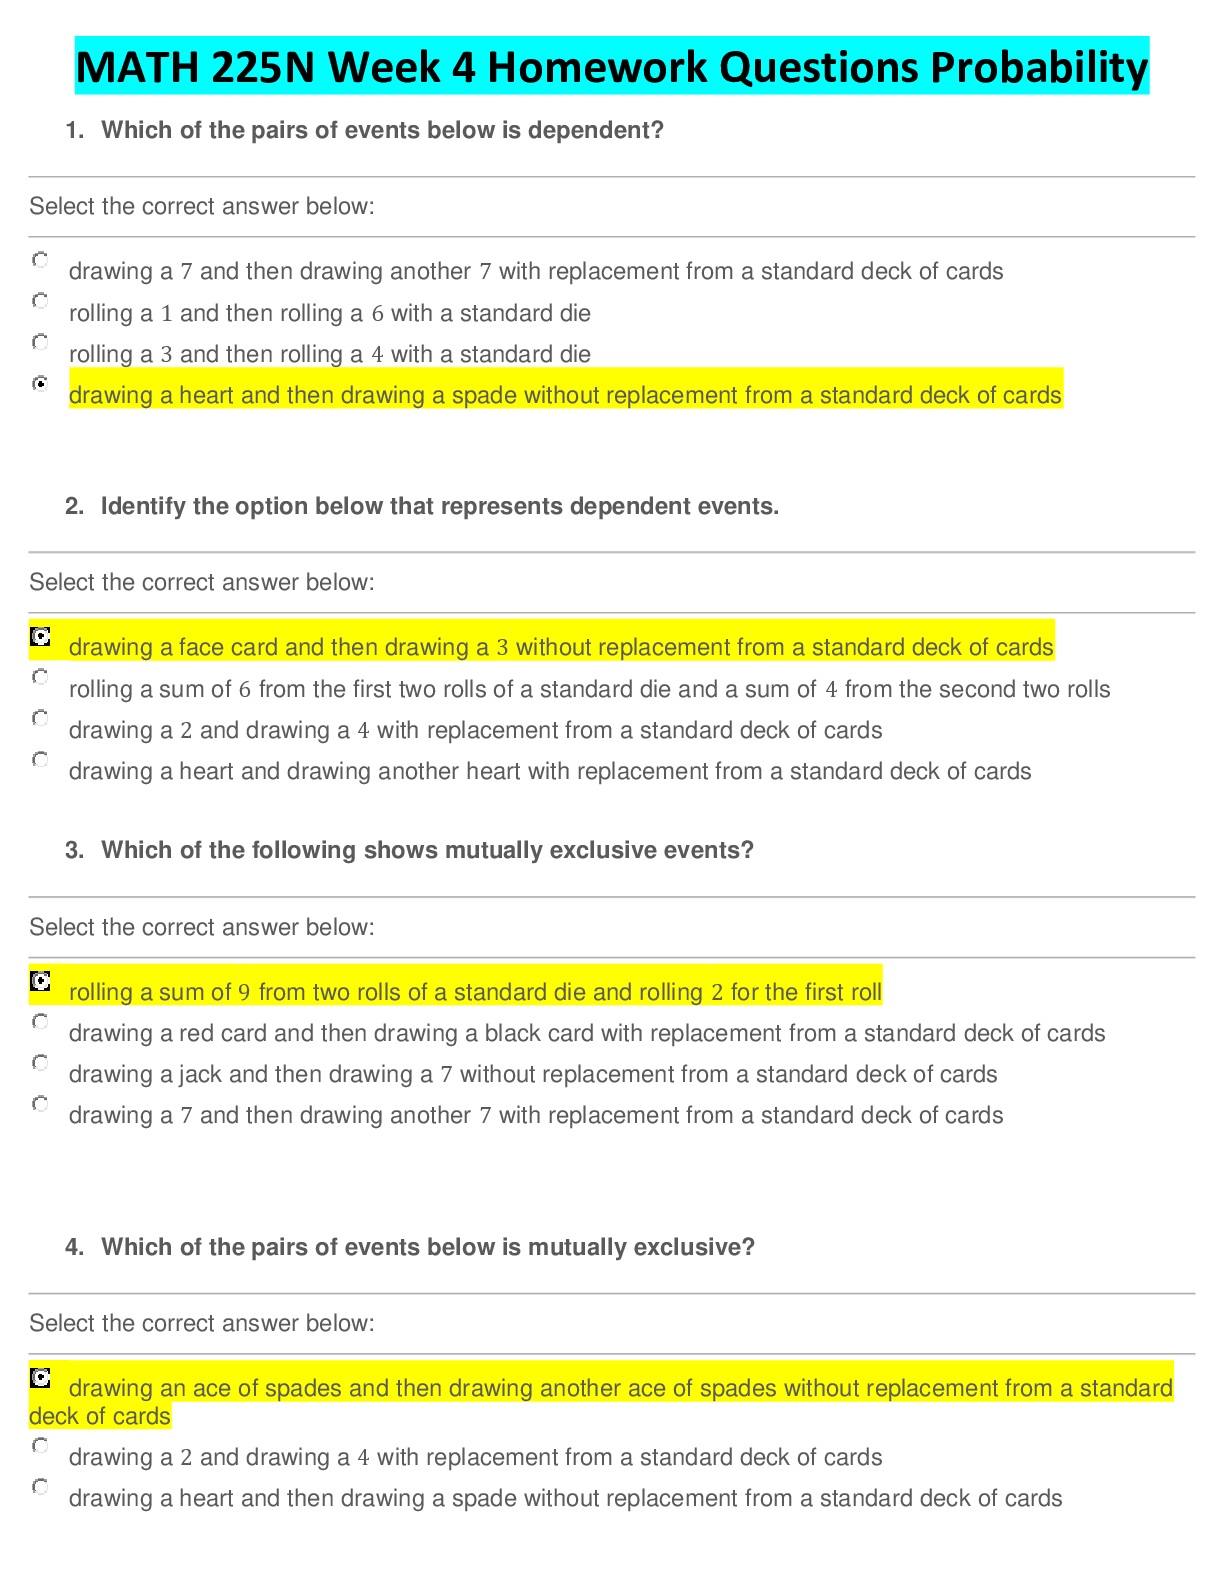
MATH 225N Week 4 Homework Questions Probability 1. Which of the pairs of events below is dependent? ________________________________________ Select the correct answer below: ______________________... __________________ drawing a 7 and then drawing another 7 with replacement from a standard deck of cards rolling a 1 and then rolling a 6 with a standard die rolling a 3 and then rolling a 4 with a standard die drawing a heart and then drawing a spade without replacement from a standard deck of cards 2. Identify the option below that represents dependent events. ________________________________________ Select the correct answer below: ________________________________________ drawing a face card and then drawing a 3 without replacement from a standard deck of cards rolling a sum of 6 from the first two rolls of a standard die and a sum of 4 from the second two rolls drawing a 2 and drawing a 4 with replacement from a standard deck of cards drawing a heart and drawing another heart with replacement from a standard deck of cards 3. Which of the following shows mutually exclusive events? ________________________________________ Select the correct answer below: ________________________________________ rolling a sum of 9 from two rolls of a standard die and rolling 2 for the first roll drawing a red card and then drawing a black card with replacement from a standard deck of cards drawing a jack and then drawing a 7 without replacement from a standard deck of cards drawing a 7 and then drawing another 7 with replacement from a standard deck of cards 4. Which of the pairs of events below is mutually exclusive? ________________________________________ Select the correct answer below: ________________________________________ drawing an ace of spades and then drawing another ace of spades without replacement from a standard deck of cards drawing a 2 and drawing a 4 with replacement from a standard deck of cards drawing a heart and then drawing a spade without replacement from a standard deck of cards drawing a jack and then drawing a 7 without replacement from a standard deck of cards (Mutually exclusive events are events that cannot occur together. In this case, drawing an ace of spades and then drawing another ace of spades without replacement from a standard deck of cards are two events that cannot possibly occur together.) 5. A deck of cards contains RED cards numbered 1,2,3,4,5,6, BLUE cards numbered 1,2,3,4,5, and GREEN cards numbered 1,2,3,4. If a single card is picked at random, what is the probability that the card has an ODD number? ________________________________________ Select the correct answer below: ________________________________________ 10/15 8/15 14/15 6/15 (By counting, we can see that there are 8 odd cards, and a total of 15 cards in the deck. So the probability is 8/15). 6. Hector is a baseball fan but wants to watch something different. There are 5 basketball games, 2 football games, and 4hockey games that he can choose to watch. If Hector randomly chooses a game, what is the probability that it is a basketball game? • Give your answer as a fraction. Provide your answer below: 5/11 7. There are 26 cards in a hat, each of them containing a different letter of the alphabet. If one card is chosen at random, what is the probability that it is not between the letters L and P, inclusive? ________________________________________ Provide your answer below: 21/26 8. A spinner contains the numbers 1 through 80. What is the probability that the spinner will land on a number that is not a multiple of 12? • Give your answer in fraction form. ________________________________________ Provide your answer below: 74/80 9. An art collector wants to purchase a new piece of art. She is interested in 5 paintings, 6 vases, and 2 statues. If she chooses the piece at random, what is the probability that she selects a painting? • Give your answer as a fraction. ________________________________________ Provide your answer below: 5/13 10. Boris is taking a quiz for an online class. For the quiz, the system randomly assigns 2 high-difficulty questions, 7 moderate-difficulty questions, and 6 low-difficulty questions. What is the probability that Boris is assigned a moderate-difficulty question first? • Give your answer as a fraction. ________________________________________ Provide your answer below: 7/15 11. A spinner contains the numbers 1 through 40. What is the probability that the spinner will land on a number that is not a multiple of 6? Give your answer as a fraction. ________________________________________ Provide your answer below: 34/40 12. A spinner contains the numbers 1 through 50. What is the probability that the spinner will land on a number that is not a multiple of 4? ________________________________________ Provide your answer below: 38/50 13. Identify the parameters p and n in the following binomial distribution scenario. The probability of winning an arcade game is 0.718 and the probability of losing is 0.282. If you play the arcade game 20 times, we want to know the probability of winning more than 15 times. (Consider winning as a success in the binomial distribution.) p=0.282, n=20 p=0.718, n=15 p=0.718, n=20 p=0.282, n=15 (The parameters p and n represent the probability of success on any given trial and the total number of trials, respectively. In this case, success is winning a game, so p=0.718. The total number of trials, or games, is n=20) 14. A weighted coin has a 0.55 probability of landing on heads. If you toss the coin 14 times, what is the probability of getting heads exactly 9 times? (Round your answer to 3 decimal places if necessary.) ________________________________________ Provide your answer below: 0.170 (This probability can be found using the binomial distribution with success probability p=0.55 and 14 trials. To find the probability that exactly 9 of the tosses are heads, use a calculator or computer: P(X=9)=binompdf(14,0.55,9)≈0.170. 15. Identify the parameter p in the following binomial distribution scenario. The probability of buying a movie ticket with a popcorn coupon is 0.546 and without a popcorn coupon is 0.454. If you buy 27 movie tickets, we want to know the probability that exactly 15 of the tickets have popcorn coupons. (Consider tickets with popcorn coupons as successes in the binomial distribution.) ________________________________________ Select the correct answer below: ________________________________________ 0.152 0.454 0.546 0.848 16. A softball pitcher has a 0.64 probability of throwing a strike for each pitch. If the softball pitcher throws 20 pitches, what is the probability that exactly 13 of them are strikes? • Round your answer to three decimal places. 0.184 This probability can be found using the binomial distribution with success probability p=0.64 and 20 trials. To find the probability that exactly 13 of the pitches are strikes, use a calculator or computer: P(X=13)=binompdf(20,0.64,13)=0.184. 17. Identify the parameter n in the following binomial distribution scenario. A basketball player has a 0.429 probability of making a free throw and a 0.571 probability of missing. If the player shoots 20 free throws, we want to know the probability that he makes no more than 12 of them. (Consider made free throws as successes in the binomial distribution.) ________________________________________ Select the correct answer below: ________________________________________ 8 12 20 32 18. Give the numerical value of the parameter p in the following binomial distribution scenario. A softball pitcher has a 0.675 probability of throwing a strike for each pitch and a 0.325 probability of throwing a ball. If the softball pitcher throws 29 pitches, we want to know the probability that exactly 19 of them are strikes. Consider strikes as successes in the binomial distribution. Do not include p= in your answer. ________________________________________ Provide your answer below: 0.675 (The parameters p and n represent the probability of success on any given trial and the total number of trials, respectively. In this case, success is a strike, so p=0.675) 19. Identify the parameters p and n in the following binomial distribution scenario. Jack, a bowler, has a 0.38 probability of throwing a strike and a 0.62 probability of not throwing a strike. Jack bowls 20times (Consider that throwing a strike is a success.) ________________________________________ Select the correct answer below: ________________________________________ p=0.38,n=0.62 p=0.38,n=10 p=0.38,n=20 p=0.62,n=10 p=0.62,n=20 (In a binomial distribution, there are only two possible outcomes. p denotes the probability of the event or trial resulting in a success. In this scenario, it would be the probability of Jack bowling a strike, which is 0.38. The total number of repeated and identical events or trials is denoted by n. In this scenario, Jack bowls a total of 20 times, so n=20). 20. The Stomping Elephants volleyball team plays 30 matches in a week-long tournament. On average, they win 4 out of every 6matches. What is the mean for the number of matches that they win in the tournament? Select the correct answer below: 46 4 20 30 In this scenario, the number of trials is 30 (the total number of matches played), which is n. The probability of a success (winning a match) is 46. So, the mean of the binomial distribution B(30,46) is: μ=(30)(46)=20 21. Using the same scenario, what is the standard deviation for the number of matches that they win in the tournament? The Stomping Elephants volleyball team plays 30 matches in a week-long tournament. On average, they win 4 out of every 6matches. ________________________________________ Select the correct answer below: 26 6.67−−−−√ 6.67 20−−√ 20 40 The standard deviation of a binomial distribution is the square root of the variance. The variance is the product of n, the total number of repeated trials or events, p, the probability of a success, and q, which is (1−p). variance = σ2=np(1−p) standard deviation = variance−−−−−−−√ In this scenario, the number of trials is 30 (the total number of matches played), which is n. The probability of a success (winning a match) is 46. So, the value for (1−p) is 26. The variance is the product of these values. variance = σ2=(30)(46)(26) So the variance is approximately 6.67, and the standard deviation is the square root of that, 6.67−−−−√ 22. Identify the parameter n in the following binomial distribution scenario. A weighted coin has a 0.441 probability of landing on heads and a 0.559 probability of landing on tails. If you toss the coin 19 times, we want to know the probability of getting heads more than 5 times. (Consider a toss of heads as success in the binomial distribution.) ________________________________________ Select the correct answer below: ________________________________________ 5 14 19 24 23. Give the numerical value of the parameter n, the number of trials, in the following binomial distribution scenario. A weighted coin has a 0.486 probability of landing on heads and a 0.514 probability of landing on tails. If you toss the coin 27 times, we want to know the probability of getting heads exactly 11 times. Consider a toss of heads as success in the binomial distribution. ________________________________________ Provide your answer below: 27 24. The probability of winning on an arcade game is 0.659. If you play the arcade game 30 times, what is the probability of winning exactly 21 times? • Round your answer to two decimal places. ________________________________________ Provide your answer below: .14 25. The probability of buying a movie ticket with a popcorn coupon is 0.526. If you buy 26 movie tickets, what is the probability that exactly 15 of the tickets have popcorn coupons? • Round your answer to three decimal places. ________________________________________ Provide your answer below: .137 26. The probability of buying a movie ticket with a popcorn coupon is 0.608. If you buy 10 movie tickets, what is the probability that more than 3 of the tickets have popcorn coupons? (Round your answer to 3 decimal places if necessary.) ________________________________________ Provide your answer below: .951 27. A softball pitcher has a 0.507 probability of throwing a strike for each pitch. If the softball pitcher throws 15 pitches, what is the probability that more than 8 of them are strikes? (Round your answer to 3 decimal places if necessary.) ________________________________________ Provide your answer below: .323 28. A 2014 study by researchers at the University College Antwerp and the University of Leuven showed that e-cigarettes are effective at reducing cigarette craving. Participants were separated into two groups. One group was given e-cigarettes and the other was told to not smoke e-cigarettes. Two months later, researchers observed how many participants had stopped smoking cigarettes. The following table shows approximate numbers. According to the table, what is the probability that a randomly chosen participant did not stop smoking, given that the participant received an e-cigarette? Participants stopped smoking did not stop smoking Total given e-cigarette 11 21 32 not given e-cigarette 0 16 16 Total 11 37 48 ________________________________________ Select the correct answer below: ________________________________________ 21/48 11/48 11/32 16/16 0/16 21/32 29. Researchers wanted to study if having a long beak is related to flight in birds. They surveyed a total of 34 birds. The data are shown in the contingency table below. What is the relative risk of flying for those birds that have long beaks? Round your answer to two decimal places. Flies Does not fly Total Long beak 11 3 14 Not a long beak 7 13 20 Total 18 16 34 Provide your answer below: 2.24 The probability that a bird with long beak flies is 11/14. The probability that a bird not having a long beak flies is 7/20. The relative risk is then 11/14 / 7/20≈2.24. This means that in this survey, birds having long beaks were 224% as likely to fly as birds not having long beaks. 30. Given the contingency table below, determine the marginal distribution of breakfast and lunch. Round your answer(s) to the nearest whole number. Select all that apply. Food Bread Rice Total Breakfast 122 189 311 Lunch 420 263 683 Total 542 452 994 ________________________________________ Select all that apply: ________________________________________ • 55% • ________________________________________ • 45% • ________________________________________ • 31% • • 69% • 31% • 69% • Marginal distributions are the row and column percentages. Breakfast and lunch are in the rows, so use the row totals to determine the percentages. The "Breakfast" percentage is 311/994≈0.31, and the "Lunch" percentage is 683/994≈0.69. The marginal distribution is 31%, 69%. 31. 155 fitness center members were asked if they run and if they lift weights. The results are shown in the table below. Does not Run Runs Total Does not Lift Weights 30 68 98 Lifts Weights 16 41 57 Total 46 109 155 Given that a randomly selected survey participant does not run, what is the probability that the participant lifts weights? • Enter the answer as a fraction. ________________________________________ Provide your answer below: 16/46 = 8/23 32. Fill in the following contingency table and find the number of students who both have a cat AND have a dog. Students Have a dog Do not have a dog Total Have a cat 35 25 60 Do not have a cat 27 11 38 Total 62 36 98 ________________________________________ Provide your answer below: 35 33. Researchers wanted to study if having a long beak is related to flight in birds. They surveyed a total of 34 birds. The data are shown in the contingency table below. What is the odds ratio for birds that fly having long beaks against birds that do not fly having long beaks? Round your answer to two decimal places. Flies Does not fly Total Long beak 11 3 14 Not a long beak 7 13 20 Total 18 16 34 Provide your answer below: 6.81 (The odds that a bird that flies also has long beak are 11 to 7. The odds that a bird that does not fly also has long beak are 3to 13. The odds ratio is then 11/17 / 3/13≈6.81. In this study, birds that fly had almost 7 times the odds of also having long beaks as the birds that do not fly.) 34. Fill in the following contingency table and find the number of students who both watch comedies AND watch dramas. Students Watch dramas Do not watch dramas Total Watch comedies 16 25 41 Do not watch comedies 38 27 65 Total 54 52 106 ________________________________________ Provide your answer below: 16 35. Researchers wanted to study if couples having children are married. They surveyed a large group of people. The data are shown in the contingency table below. What is the odds ratio for married people having children against unmarried people having children? Round your answer to two decimal places. Children No Children Total Married 97 35 132 Not Married 68 71 139 Total 165 106 271 The odds that a married couple has children are 97 to 35. The odds that an unmarried couple has children are 68 to 71. The odds ratio is then 97/35 ÷ 68/71 ≈ 2.89. In this study, people who are married had about 3 times the odds of having children as people who are not married. 36. Doctors are testing a new antidepressant. A group of patients, all with similar characteristics, take part in the study. Some of the patients receive the new drug, while others receive the traditional drug. During the study, a number of patients complain about insomnia. The data are shown in the contingency table below. What is the relative risk of insomnia for those who receive the new drug? Round to two decimal places. Insomnia No Insomnia Total New Drug 52 226 278 Traditional Drug 36 295 331 Total 88 521 609 Answer: 1.72 (The probability that a patient who receives the new drug develops insomnia is 52/278=26/139. The probability that a patient who receives the traditional drug develops insomnia is 36/331. The relative risk is then 26/139 ÷ 36/331≈1.72. This means that in this study, people who took the new drug were 172% more likely to develop insomnia) 37. A group of college freshman are targeted with a voter registration advertisement. Another group of freshman are not targeted. The table below shows how many of these freshman registered to vote. What is the odds ratio for freshman targeted with the advertisement registering to vote against freshman not targeted with the advertisement registering to vote? Does the advertisement appear to have been successful? Round to two decimal places. Registered to vote Did not register to vote Total Targeted with advertisement 103 36 139 Not targeted with advertisement 78 64 142 Total 181 200 381 Select the correct answer below: ________________________________________ 5.51; The advertisement was successful. 2.35; The advertisement was successful. 1.79; The advertisement was successful. 0.56; The advertisement was not successful. 0.43; The advertisement was not successful. 0.18; The advertisement was not successful. (The odds that a student targeted by the advertisement registers to vote is 103 to 36. The odds that a student not targeted by the advertisement registers to vote is 78 to 64, or 39 to 32. The odds ratio is then 103/36 ÷ 39/32≈2.35. In this situation, students targeted by the advertisement had more than twice the odds of registering to vote as students not targeted by the advertisement. It would appear that the advertisement was successful) 38. Researchers wanted to study if wearing cotton clothes is related to depression. They surveyed a large group of people. The data are shown in the contingency table below. What is the relative risk of wearing cotton clothes for those who are depressed? Round your answer to two decimal places. Depressed Not Depressed Total Cotton 122 189 311 Not Cotton 420 263 683 Total 542 452 994 Answer: .54 (The probability that someone who is depressed wears cotton clothes is 122542. The probability that someone who is not depressed wears cotton clothes is 189452. The relative risk is then 122542189452≈0.54. This means that in this survey, depressed people were 54% as likely to wear cotton clothes as people who are not depressed) 39. Researchers want to study whether or not a fear of flying is related to a fear of heights. They surveyed a large group of people and asked them whether or not they had a fear of flying and whether or not they had a fear of heights. The data are shown in the contingency table below. What is the relative risk of being afraid of flying for those who are afraid of heights? Round your answer to two decimal places. Afraid of heights Not afraid of heights Total Afraid of flying 76 33 109 Not afraid of flying 82 370 452 Total 158 404 561 Provide your answer below: 5.87 (The probability that someone with a fear of heights is afraid of flying is 76/158=38/79. The probability that someone who does not have a fear of heights is afraid of flying is 33/403. The relative risk is then 38/79 /v 33/403≈5.87. This means that in this survey, people with a fear of heights were 587% as likely to have a fear of flying as people without a fear of heights. 40. A study of drivers with speeding violations in the last year and drivers who use cell phones produced the following fictional data: Violation No violation Total Cell phone user 25 280 305 Not a cell phone user 45 405 450 Total 70 685 755 Find the probability that a driver received a violation, given that the driver is a cell phone user. ________________________________________ Select the correct answer below: ________________________________________ 280/305 70/755 25/305 25/70 41. Find the probability that a randomly chosen person takes public transit to work given that the person does not support the environmental bill. People Drive to work Walk to work Public Transport to work Total Support bill 5 30 20 55 Do not support bill 20 3 10 33 Total 25 33 30 88 Give your answer as a fraction. 10/33 42. Fill in the following contingency table and find the number of students who both do not go to the beach AND do not go to the mountains. Students Go to the mountains do not go to the mountains Total Go to the beach 32 22 54 Do not go to the beach 17 10 27 Total 49 32 81 ________________________________________ Provide your answer below: 10 43. Fill in the following contingency table and find the number of students who both have a cat AND have a dog. Students Have a dog Do not have a dog Total Have a cat 14 35 49 Do not have a cat 32 17 49 Total 46 52 98 ________________________________________ Provide your answer below: 14 44. Researchers wanted to study if couples having children are married. They surveyed a large group of people. The data are shown in the contingency table below. What is the odds ratio for people having children to be married against people not having children to be married? Round your answer to two decimal places. Children No Children Total Married 97 35 132 Not Married 68 71 139 Total 165 106 271 ________________________________________ Provide your answer below: 2.89 (The odds that people having children are married are 97 to 68. The odds that people not having children are married are 35to 71. The odds ratio is then 97/68 ÷ 35/71≈2.89. In this study, people who have children had about 3 times the odds of being married as people who do not have children) 45. Researchers wanted to study if wearing cotton clothes is related to depression. They surveyed a large group of people. The data are shown in the contingency table below. What is the odds ratio for people wearing cotton clothes being depressed against people not wearing cotton clothes being depressed? Round your answer to two decimal places. Depressed Not Depressed Total Cotton 122 189 311 Not Cotton 420 263 683 Total 542 452 994 Provide your answer below: 0.40 (The odds that a person who wears cotton clothes is also depressed are 122 to 189. The odds that a person who does not wear cotton clothes is depressed are 420 to 263. The odds ratio is then 122/189 ÷ 420/263≈0.40. In this study, people who wear cotton clothes had over 0.4 times the odds of also being depressed as people who are not wearing cotton clothes. 46. Review the flu vaccine data below. What is the odds ratio of not catching the flu for those who receive the new vaccine? Caught flu Did not catch flu Total New Vaccine 15 375 390 Traditional Vaccine 55 225 280 Total 70 600 670 Answer: 6.11 The odds that a person who receives the new vaccine does not catch the flu is 375 to 15, or 25 to 1. The odds that a person who receives the traditional vaccine does not catch the flu is 225 to 55, or 45 to 11. The odds ratio is then 25/1 ÷ 45/11≈6.11. In this experiment, people who took the new vaccine had just over 6 times the odds of not catching the flu as people who did not take the new vaccine. 47. Doctors are testing a new antidepressant. A group of patients, all with similar characteristics, take part in the study. Some of the patients receive the new drug, while others receive the traditional drug. During the study, a number of patients complain about insomnia. The data are shown in the contingency table below. What is the relative risk of insomnia for those who receive the new drug? Round to two decimal places. Insomnia No insomnia Total New drug 52 226 278 Traditional drug 36 295 331 Total 88 521 609 Answer: 1.72 (The probability that a patient who receives the new drug develops insomnia is 52/278=26/139. The probability that a patient who receives the traditional drug develops insomnia is 36/331. The relative risk is then 26/139 ÷ 36/331≈1.72. This means that in this study, people who took the new drug were 172% more likely to develop insomnia. 48. In a recent survey, a group of people were asked if they were happy or unhappy with the state of the country. The data are shown in the contingency table below, organized by political party. What is the odds ratio for people unhappy with the state of the country to be republicans against people happy with the state of the country to be republicans? Round your answer to two decimal places. Unhappy Unhappy Total Republican 152 98 250 Democrat 104 146 250 Total 256 244 500 Provide your answer below: 0.46 (The odds that a person unhappy with the state of the country is a republican are 98 to 146, or 49 to 73. The odds that a person happy with the state of the country is a republican are 152 to 104, or 19 to 13. The odds ratio is then 49/73 ÷ 19/13≈0.46. In this study, a person unhappy with the state of the country had about half the odds of being a republican as a person happy with the state of the country. • • • 49. Researchers wanted to study if couples having children are married. They surveyed a large group of people. The data are shown in the contingency table below. What is the relative risk of being married for those who have children? Round your answer to two decimal places. Children No Children Total Married 97 35 132 Not Married 68 71 139 Total 165 106 271 Answer: 1.78 (he probability that someone who has children is married is 97/165. The probability that someone who does not have children is married is 35/106. The relative risk is then 97/165 ÷ 35/106≈1.78. This means that in this survey, people who have children were 178%as likely to be married as people who do not have children. 50. Kelsey, a basketball player, hits 3-point shots on 38.1% of her attempts. If she takes 14 attempts at 3-point shots in a game, what is the probability that she hits exactly six of them? Use Excel to find the probability. • Round your answer to three decimal places. ________________________________________ Provide your answer below: 0.198 51. A computer graphics card manufacturer is testing an improvement to its production process. If a sample of 100 graphics cards manufactured using the new process has a less than 10% chance of having 3 or more defective graphics cards, then the manufacturer will switch to the new process. Otherwise, the manufacturer will stay with its existing process. If the probability of a defective graphics card using the new process is 0.9%, will the manufacturer switch to the new production process? ________________________________________ Select the correct answer below: ________________________________________ Yes, because the probability of having 3 or more defective graphics cards is greater than 0.10. Yes, because the probability of having 3 or more defective graphics cards is less than 0.10. No, because the probability of having 3 or more defective graphics cards is less than 0.10. No, because the probability of having 3 or more defective graphics cards is greater than 0.10. (Note that this is a cumulative binomial probability. In this case, we want to find the probability of 3 or more successes, inclusive, where a success is one of the graphics cards being defective. The probability of having 2 or fewer defective graphics cards is the complement of the probability of having 3 or more defective graphics cards. To determine the probability from a binomial distribution using Excel, follow the steps below. 1. First press FORMULAS and then INSERT FUNCTION. 2. Then select the BINOM.DIST function. 3. Next enter the values for the number of successes, the number of trials, the probability of a success, and the number of successes. In this case, enter 2, 100, and 0.009, in that order. Enter 1 for Cumulative since this is a cumulative probability. 4. Press OK. Excel should then display the probability. Here, the resulting probability is 0.937964, which is 0.938 rounded to three decimal places. To find the probability of having 3 or more defective graphics cards, subtract this probability from 1. The probability of having 3 or more defective graphics cards is 1−0.938=0.062, which is less than 0.10. So, the manufacturer will switch to the new process) • 52. In a large city’s recent mayoral election, 126,519 out of 283,143 registered voters actually turned out to vote. If 20 registered voters are randomly selected, find the probability that exactly 8 of them voted in the mayoral election. Use Excel to find the probability. • Round your answer to three decimal places. ________________________________________ Provide your answer below: 0.165 P=.446 (126,519/283,143) N=20 X=8 53. Alex wants to test the reliability of “lie detector tests,” or polygraph tests. He performs a polygraph test on a random sample of 12 individuals. If there is more than a 50% chance that the tests result in no false positives (that is, the test does not result in a true statement being recorded as a lie), Alex will conclude that the tests are reliable. If the probability of a lie detector test resulting in a false positive is 5.5%, what will Alex conclude? Use Excel to find the probability, rounding to three decimal places. Select the correct answer below: Alex will conclude that the test is reliable since the probability of no false positives is less than 0.5. Alex will conclude that the test is not reliable since the probability of no false positives is greater than 0.5. Alex will conclude that the test is not reliable since the probability of no false positives is less than 0.5. Alex will conclude that the test is reliable since the probability of no false positives is greater than 0.5. (Next enter the values for the number of successes, the number of trials, the probability of a success, and the number of successes. In this case, enter 0, 12, and 0.055, in that order. Enter 0 for Cumulative since this is not a cumulative probability) 54. A certain cold remedy has an 88% rate of success of reducing symptoms within 24 hours. Find the probability that in a random sample of 45 people who took the remedy, 40 of them had a reduction of symptoms within a day. • Round your answer to three decimal places. 0.183 55. Kevin works for a company that manufactures solar panels. In a large batch of solar panels, about 1 in 200 is defective. Suppose that Kevin selects a random sample of six solar panels from this batch. What is the probability that none of the solar panels are defective? Use Excel to find the probability. • Round your answer to three decimal places. 0.970 56. A database system assigns a 32-character ID to each record, where each character is either a number from 0 to 9 or a letter from A to F. Assume that each number or letter being selected is equally likely. Find the probability that at least 20characters in the ID are numbers. Use Excel to find the probability. • Round your answer to three decimal places. 0.578 57. A fair spinner contains the numbers 1, 2, 3, 4, and 5. For an experiment, the spinner will be spun 5 times. If Event A = the spinner lands on numbers all less than 3, what is an outcome of Event A? a total sum less than 4 spinner lands on 1, 3, 1, 2, 1 a total sum of 11 spinner lands on 1, 2, 1, 2, 2 58. A poll is conducted to determine if political party has any association with whether a person is for or against a certain bill. In the poll, 214 out of 432 Democrats and 246 out of 421 Republicans are in favor of the bill. Assuming political party has no association, the probability of these results being by chance is calculated to be 0.01. Interpret the results of the calculation. We can expect that 246 out of every 421 Republicans are in support of this bill. We cannot say the results are statistically significant at the 0.05 level. At the 0.01 level of significance, political party is associated with whether a person supports this bill. At the 0.01 level of significance, political party determines whether a person supports this bill. (Statistical significance of any level does not mean that there is a certain factor that affects the results of the experiment) 59. Arianna will roll a standard die 10 times in which she will record the value of each roll. What is a trial of this experiment? one roll of the die rolling at least one 5 ten rolls of the die rolling a sum of 40 60. A health survey determined the mean weight of a sample of 762 men between the ages of 26 and 31 to be 173 pounds, while the mean weight of a sample of 1,561 men between the ages of 67 and 72 was 162 pounds. The difference between the mean weights is significant at the 0.05 level. Determine the meaning of this significance level. Select the correct answer below: We expect that the mean weight of any sample of 762 men between the ages of 26 and 31 is 173 pounds. It is not unusual to see the mean weight of 1,561 men between the ages of 67 and 72 to be 162 pounds because the weight of men varies. The results are statistically significant at the 0.01 level. At the 0.05 level of significance, the age of men has an association with their mean weight. (when a difference is significant at the 0.05 level, it means that we are confident in concluding that this difference is not due to chance. If it is not due to chance, it must be due to the age of the men, because age is the differentiator between the two groups. Thus the answer is, At the 0.05 level of significance, the age of men has an association with their mean weight) 61. The mean body temperature of a human is accepted to be 98.6∘F. In a study, the body temperatures of 127 individuals were measured. The mean body temperature of the individuals was calculated to be 99.0∘F. Assuming the regular body temperature of humans is actually 98.6∘F, the probability of these results occurring by chance is less than 0.01. Interpret the results of the calculation. ________________________________________ Select the correct answer below: ________________________________________ We can expect that the mean body temperature of any 127 individuals is 99.0∘F. The mean body temperature of humans is not 98.6∘F. At the 0.01 level of significance, the mean body temperature of humans is not 98.6∘F. Since human body temperature varies, the results of this study are not unusual. (The results of the survey are significant at the 0.01 level. This means that the probability of the data being the result of chance is 0.01 or less. Because of this, we can be fairly confident, but not certain, that the mean body temperature of humans is not 98.6∘F) 62. Which of the following events seem like they would be unlikely to occur by chance? ________________________________________ Select all that apply: ________________________________________ • flipping a coin 100 times and having it land on heads 15 times • ________________________________________ • rolling a 6-sided die 100 times and having a 6 land face-up 15 times • ________________________________________ • picking 10 people out of a crowd and having them all have brown eyes • ________________________________________ • guessing somebody's name correctly without having previously met the person 63. Before a college professor gave an exam, he held a review session, where 30 of his 150 students attended the review. The mean score of the students who attended was 86%, whereas the mean score of the students who didn’t attend the review was 79%. The difference in the mean scores is significant at the 0.05 level, assuming the review session does not associate with a higher exam score. Determine the meaning of this significance level. Select the correct answer below: It is not unusual to see the mean exam score of 120 students be 79% because the testing abilities of students vary. We expect the mean score of a group of 30 students who attend a review session to be 86%. At the 0.05 level of significance, attendance of the review session is associated with a higher exam score. The review session is helpful to students at the 0.01 level of significance. 64. According to a recent poll, 40.5% of people aged 25 years or older in the state of Massachusetts have a bachelor’s degree or higher. The poll also reported that 30.0% of people aged 25 years or older in the state of Delaware have a bachelor’s degree or higher. The poll sampled 354 residents of Massachusetts and 210 residents of Delaware. The data was calculated to be significant at the 0.013 level. Determine the meaning of this significance level. Select the correct answer below: At the 0.013 level of significance, a larger percentage of residents from Massachusetts have bachelor’s degrees. It is not unusual to see 30.0% of a sample of 210 residents of Delaware have bachelor’s degrees because level of education varies. It is certain that more residents of Massachusetts have bachelor’s degrees than do residents of Delaware. We can expect about 40.5% of any group of 354 Massachusetts residents to have a bachelor’s degree or higher. 65. A survey was conducted to see whether age has an association with the belief that a master’s degree or higher provides an advantage in one’s career. Of the 524 adults between the ages of 22 and 25 surveyed, 56% believed that a master’s degree has value in a person’s career path. Of the 458 adults surveyed between the ages of 40 and 45, 52% also believed that a master’s degree has value in a person’s career path. Assuming age is not associated with this belief, the probability of the data being the result of chance is calculated to be 0.21. Interpret this calculation. Select the correct answer below: We can expect 56% of all adults between the ages of 22 and 25 to believe a master’s degree or higher provides an advantage in one’s career. The data is statistically significant at the 0.05 level of significance in showing that age has an association with the belief that a master’s degree or higher provides an advantage in one’s career. Age does not have any association with the belief that a master’s degree or higher provides an advantage in one’s career. The data are not statistically significant at the 0.05 level of significance in showing that age has an association with the belief that a master’s degree or higher provides an advantage in one’s career. 66. A farmer claims that the average mass of an apple grown in his orchard is 100g. To test this claim, he measures the mass of 150 apples that are grown in his orchard and determines the average mass per apple to be 98g. The results are calculated to be statistically significant at the 0.01 level. What is the correct interpretation of this calculation? Select the correct answer below: The data are not statistically significant at the 0.05 level. The mean mass of any 150 apples grown in the farmer's orchard is 98g. At the 0.01 level of significance, the mean mass of the apples grown in the farmer's orchard is different from 100g. At the 0.01 level of significance, the mean mass of the apples grown in the farmer's orchard is 98g. 67. Paul will roll two standard dice simultaneously. If Event A = both dice are odd and Event B = at least one die is even, which of the following best describes events A and B? Select two answers. ________________________________________ Select all that apply: • Mutually Exclusive • • Not Mutually Exclusive • • Independent • • Dependent 68. Patricia will draw 8 cards from a standard 52-card deck with replacement. Which of the following are not events in this experiment? Select all that apply: • drawing 8 hearts • • drawing 8 cards • • drawing 1 card • • drawing 3 kings • (Events are any combinations of outcomes or particular results in an experiment. Drawing 8 cards is the experiment and drawing 1 card is a trial of the experiment, neither of which specify a result or outcome) 69. Which of the following gives the definition of event? ________________________________________ Select the correct answer below: ________________________________________ the set of all possible outcomes of an experiment a subset of the set of all outcomes of an experiment a planned activity carried out under controlled conditions one specific execution of an experiment 70. Which of the following gives the definition of trial? ________________________________________ Select the correct answer below: ________________________________________ a particular result of an experiment one specific execution of an experiment a planned activity carried out under controlled conditions the set of all possible outcomes of an experiment 71. Beth is performing an experiment to check if a die is fair. She rolls the die 5 times and records the sequence of numbers she gets. Which of these is an outcome of this experiment? Select all correct answers. Select all that apply: • Rolling a die • • Rolling a die five times • • Rolling the sequence 1,1,2,1,6 • • Rolling five 4's • • Rolling the sequence 1,1,2 (An outcome is a specific result of an experiment. So the outcomes of this experiment are all the possible sequences of five die rolls. So in this case, a particular sequence such as 1,1,2,1,6 is an outcome. So is rolling five 4's, because this is a specific outcome (4,4,4,4,4) 72. Which of the following pairs of events are independent? Select all that apply: • You roll a die twice. Event A is getting an even number on the first roll. Event B is getting a 4 on the second roll. • You roll a die twice. Event A is getting a 6 on the first roll. Event B is getting a total of more than 7. • You flip a coin and roll a die. Event A is getting heads on the coin. Event B is getting a 3 or more on the die. • You roll a die and flip a coin. Event A is getting heads with the coin and getting 5 on the die. Event B is getting 3 or more on the die. 73. Is the statement below true or false? Mutually exclusive is the property of events in which none can occur at the same time. Select the correct answer below: True False 74. Trial best fits which of the following descriptions? Select the correct answer below: a particular result of an experiment a subset of the set of all outcomes of an experiment one repetition or instance of an experiment the set of all possible outcomes of an experiment 75. Jacqueline will spin a fair spinner with the numbers 0, 1, 2, 3, and 4 a total of 3 times. If Event A = spinner lands on numbers all greater than 2 and Event B = total sum of 9, which of the following best describes events A and B? Select the correct answer below: independent dependent mutually exclusive complement • [Show More]
Last updated: 1 year ago
Preview 1 out of 27 pages
Reviews( 0 )
Document information
Connected school, study & course
About the document
Uploaded On
Apr 27, 2020
Number of pages
27
Written in

Additional information
This document has been written for:
Uploaded
Apr 27, 2020
Downloads
0
Views
165


.png)
 Study Guide Latest 2022.png)
.png)