*NURSING > QUESTIONS & ANSWERS > ECO Final Exam | Complete Solution. All answers Provided. (All)
ECO Final Exam | Complete Solution. All answers Provided.
Document Content and Description Below
ECO Final Exam | Complete Solution Chapter 2 Question 1: What do economists mean by scarcity? a. Economists mean that unlimited wants exceed limited resources. b. Economists mean that trade is no... t possible. c. Economists mean that people are not employed. d. Economists mean that production is inefficient. e. Economists mean that economy is unable to produce increasing quantities of goods and services What of the following is not scarce according to the economic definition? a. Coal b. Time c. Food d. Capital e. None of the above Chapter 2 Question 2: A production possibilities frontier: a. Shows the market for a good or service b. Shows how unlimited wants exceed the limited resources available to fulfill those wants c. Shows how participants in the market are linked d. Shows the maximum attainable combinations of two goods that may be produced with available resources. We can show economic efficiency: a. With points inside the production possibilities frontier b. With points on the production possibilities frontier c. With points inside and on the production possibilities frontier d. With points on and outside the production possibilities frontier e. With points outside the production possibilities frontier We can show economic inefficiency: a. With points inside the production possibilities frontier b. With points on the production possibilities frontier c. With points inside and on the production possibilities frontier d. With points on and outside the production possibilities frontier e. With points outside the production possibilities frontier The production possibilities frontier will shirt outward: a. If technological advances occur. Chapter 2 Question 3: What does increasing marginal opportunity costs mean? a. The economy is unable to produce increasing quantities of good and services. b. Increasing the production of a good requires decreases in the production of another good c. Production is not occurring on the production possibilities frontier d. Increasing the production of a good requires smaller and smaller decreases in the production of another good e. Increasing the production of a good requires larger and larger decreases in the production of another good What are the implications of this idea for the shape of the production possibilities frontier? a. The production possibilities frontier will be bowed inward b. The production possibilities frontier will have a negative slope c. The production possibilities frontier will be a straight line d. The production possibilities frontier will have a positive slope. e. The production possibilities frontier will be bowed outward. Chapter 2 Question 4: GRAPH Consider the production possibilities frontier (PPF) that shows the trade-off between the production of cotton and the production of soybeans depicted in the figure to the right. Use the three-point curved line drawing tool to show the effect that improved fertilizers/prolonged drought would have on the initial production possibilities frontier by drawing a new production possibilities frontier. Properly label this curve. Chapter 2 Question 5: GRAPH Consider the production possibilities frontier (PPF) that shows the trade-off between the production of cotton and the production of soybeans depicted in the figure to the right. Suppose that genetic modifications make soybeans resistant to insects, allowing yields to increase. Use the three-point curved line drawing tool to show the effect of this technological change by drawing a new production possibilities frontier. Properly label this curve. Chapter 2 Question 6: GRAPH One of the trade-offs BMW faces is between safety and gas mileage. For example, adding steel to a car makes it safer but also heavier, which results in lower gas mileage. Use the three-point curved line drawing tool to draw a hypothetical production possibilities frontier that BMW engineers face that shows this trade-off. Assume that this trade-off is consistent with increasing costs of added safety. Properly label this curve. Chapter 2 Question 7: Suppose you win free tickets to a movie plus all you can eat at the snack bar for free. Would there be a cost to you to attend this movie? a. No because the movie ticket and snacks at the bar are free. b. No because the movies are not scarce c. No because the movie ticket is free d. Yes because attending movies is not on the production possibilities frontier e. Yes because the movie’s opportunity cost is equal to the highest-valued alternative that must be given up to attend the movie. Chapter 2 Question 8: Suppose we can divide all the goods produced by an economy into two types: consumption goods and capital goods. Capital goods, such as machinery, equipment, and computers, are goods used to produce other goods. Is it likely that the production possibilities frontier in this situation would be a straight line: or bowed out? Chapter 2 Question 9: GRAPH Suppose we can divide all the goods produced by an economy into two types: consumption goods and capital goods. Capital goods, such as machinery, equipment, and computers, are goods used to produce other goods. Suppose a technological advance occurs that affects the production of capital goods but not consumption goods. Use the three-point curved drawing tool to show the effect of this technological change by drawing a new production possibilities frontier. Properly label this curve. Chapter 2 Question 10: GRAPH Suppose we can divide all the goods produced by an economy into two types: consumption goods and capital goods. Capital goods, such as machinery, equipment, and computers, are goods used to produce other goods. Suppose that country A and country B currently have identical production possibilities frontiers but that country A devotes only 5 percent of its resources to producing capital goods over each of the next 10 years, whereas country B devotes 30 percent. Which country is likely to experience more rapid economic growth in the future? Use the three-point curved drawing tool to illustrate this by drawing two production possibilities frontiers. Specifically, your graph should include production possibilities frontiers for country A in 10 years (the future) and production possibilities frontiers for country B in 10 years (the future). Properly label the curves. Chapter 2 Question 11: What is absolute advantage? What is comparative advantage? Is it possible for a country to have a comparative advantage in producing a good without also having an absolute advantage? A country without an absolute advantage in producing a good: Chapter 2 Question 12: What is the basis for trade? How can a country gain from specialization and trade? Chapter 2 Question 13: GRAPH The graph to the right shows how many pounds of apples and pounds of cherries you and your neighbor can each pick in one week. For example, if you devote all of your time to picking apples and none of your time to picking cherries, you can pick 12 pounds of apples. If you devote all of your time to picking cherries, you can pick 72 pounds. At the same time, if your neighbor devotes all of her time to picking apples, she can pick 32 pounds of apples. If she devotes all of her time to picking cherries, she can pick 32 pounds. Suppose initially that you (Y) are consuming 8 pounds of apples and 24 pounds of cherries and that your neighbor (N) is consuming 4 pounds of apples and 28 pounds of cherries, as indicated in the graph. Then, suppose you and your neighbor specialize by each only picking the good for which you have a comparative advantage and trade. In particular, suppose you trade your neighbor half of your production for half of what your neighbor produces. In the table below, first fill in production when specializing. Next fill in consumption with trade. Recall that you trade your neighbor half of what you pick for half of what your neighbor picks. Finally, fill in gains from trade. Chapter 2 Question 14: GRAPH Using the same amount of resources, the United States and Canada can both produce lumberjack shirts and lumberjack boots, as shown in the production possibilities frontiers in the figure to the right. The United States has a comparative advantage in producing lumberjack boots. Canada has a comparative advantage in producing lumberjack boots. Does either country have an absolute advantage in producing both goods? Suppose initially that the United States is consuming 18 boots and 2 shirts and Canada is consuming 4 boots and 8 shirts, as indicated in the figure. Then, suppose the United States and Canada specialize by each only producing the good for which they have a comparative advantage and then trade. In particular, suppose the United States trades Canada half of its production for half of what Canada produces. The United States will have 10 additional shirt(s) after the trade and 0 additional boot(s). At the same time, Canada will be able to consume 4 additional shirt(s) as a result of the trade and 14 additional boot(s). Chapter 2 Question 15: In the 1950’s, the economist Bela Balassa compared 28 manufacturing industries in the United States and Britain. In every one of the 28 industries, Balassa found that the United States had an absolute advantage. In these circumstances, would there have been any gain to the United States from importing any of these products from Britain? Explain. Chapter 2 Question 16: CHART Suppose Iran and Iraq both produce oil and olive oil. The following table shows combinations of both goods that each country can produce in a day, measured in thousands of barrels. Who has the comparative advantage in producing oil? Can these two countries gain from trading oil and olive oil? Chapter 2 Question 17: CHART Suppose that France and Germany both produce wine and schnitzel. The table below shows combinations of the goods that each country can produce in a day. Who has the comparative advantage in producing wine and who has the comparative advantage in producing schnitzel? Suppose that France is currently producing 1 bottle of wine and 12 pounds of schnitzel and Germany is currently producing 3 bottles of wine and 10 pounds of schnitzel. Then, assume instead that France and Germany specialize by producing only the good for which they have a comparative advantage and then trade 3 bottles of wine for 13 pounds of schnitzel. After specialization and trade, France gains by consuming the same amount of wine and 1 additional pound(s) of schnitzel and Germany gains by consuming the same amount of wine and 2 additional pound(s) of schnitzel. Chapter 2 Question 18: What is the circular-flow diagram and what does it illustrate? Chapter 2 Question 19: What are the two main categories of participants in markets? Which participants are of greatest importance in determining what goods and services are produced? Chapter 2 Question 20: What is a free market? In what ways does a free market economy differ from a centrally planned economy? Unlike a free market economy, Chapter 2 Question 21: What is an entrepreneur? Why do entrepreneurs play a key role in a market system? Chapter 2 Question 22: Firms are likely to produce more of a good or service when its price rises and less of a good or service when its price falls. Chapter 2 Question 23: What are private property rights? Private property rights are: What role do they play in the working of a market system? Private property rights: Why are independent courts important for a well-functioning economy? Independence is necessary for courts: Chapter 2 Question 24: Identify whether each of the following transactions will take place in the factor market or in the production market and whether households or firms are supplying the good or service or demanding the good or service. George buys a BMW X5 SUV. This takes place in the product market. The household demands the good the firm supplies the good. BMW increases employment at its Spartanburg plant. This takes place in the factor market. The households supply the labor and the firm demands the labor. George works 20 hours per week at McDonald’s. This takes place in the factor market. The household supplies the labor and the firm demands the labor. George sells land he owns to McDonald’s so it can build a new restaurant. This takes place in the factor market. The household supplies the factor of production and the firm demands the factor of production. Chapter 2 Question 25: In The Wealth of Nations, Adam Smith wrote the following: “It is not from the benevolence of the butcher, the brewer, or the baker, that we expect our dinner, but from their regard to their own interest.” What did Smith mean by this? Chapter 3 Question 1: GRAPH Below are both a demand schedule and a demand curve. Which one is best suited to find the quantity demanded at a price of $4.00? The demand schedule. Chapter 3 Question 2: What do economists mean when they use the Latin expression ceteris paribus? Chapter 3 Question 3: GRAPH Use the point drawing tool to show a change in demand given the combinations of price and quantity-demanded shown at point A. Chapter 3 Question 4: The law of demand is the assertion that An increase in the price of a product causes a decrease in quantity demanded because of the income and substitution effects. More specifically, Chapter 3 Question 5: GRAPH A grilled cheese sandwich is considered to be a normal good. Use the line drawing tool to show how a decrease in consumer income affects the demand for grilled cheese sandwiches. Label this new line ‘D2’. Chapter 3 Question 6: GRAPH Jiffy peanut butter and Smucker’s Strawberry jam are considered to be complementary goods. Use the line drawing tool to show how an increase in the price of Jiffy peanut butter affects the demand for Smucker’s Strawberry jam. Label this new line ‘D2’. Chapter 3 Question 7: GRAPH Below are both a supply schedule and a supply curve. Which one is best suited to find the quantity supplied at a price of $4.50? The supply curve. Chapter 3 Question 8: The difference between a change in supply and a change in the quantity supplied is that the latter is Chapter 3 Question 9: From the list below, select the variable that will cause the supply curve to shift: Chapter 3 Question 10: Identify whether each of the following statements describes a change in supply or a change in the quantity supplied. a. To take advantage of high prices for snow shovels during a very snowy winter, Alexander Shovels, Inc., decides to increase output. A change in quantity supplied. b. The success of Apple’s iPod leads more firms to begin producing digital music players. A change in supply. c. In the six months following Hurricane Katrina, production of oil in the Gulf of Mexico declined by 25 percent. A change in supply. Chapter 3 Question 11: GRAPH On the diagram to the right, a movement from A to B represents a Chapter 3 Question 12: GRAPH According to the law of supply, Chapter 3 Question 13: Consider the supply of crude oil on the world market. In August 2011, the price of oil was roughly $80 per barrel. Which of the following changes would increase the supply of oil? The oil supply curve would shift to the right if Chapter 3 Question 14: When economists speak of a shortage, they mean a situation in which Chapter 3 Question 15: Complete the following statement: “When there is a shortage of a good Chapter 3 Question 16: GRAPH An article discusses the market for autographs by Mickey Mantle, the superstar centerfielder for the New York Yankees during the 1950s and the 1960s: “At card shows, gold outings, charity dinners, Mr. Mantle signed his name over and over.” One expert on sport autographs is quoted as saying: blah blah blah. Show how the price of baseballs signed by Mantle could be higher than the price of baseballs signed by Ford. 1) Use the line drawing tool to draw the supply curve (SFord) and the demand curve (DFord) for baseballs autographed by Whitey Ford. Properly label the lines. 2) Use the line drawing tool to draw the supply curve (SMantle) and the demand curve (DMantle) for baseballs autographed by Mickey Mantle. Properly label the lines. 3) Use the point drawing tool to indicate the equilibrium price and quantity of autographed baseballs by Ford and the equilibrium price and quantity of autographed baseballs by Matle. Properly label the lines. Chapter 3 Question 17: During the summer of 2011, General Motors (GM) had trouble selling pickup trucks. According to an article in USA Today: “General Motors dealers had a 122-day supply of Chevrolet Silverado and GMC Sierra pickups in June, more than 50% above what’s considered optimum … Behind the glut: The year started strong and makes pumped up production. Then the economy slowed faster than they cut back.” The term glut implies that relative to the quantity supplied of GM pickup trucks, the quantity demanded was smaller. Given the situation in the market for GM pickup trucks in the summer of 2011, their prices would be expected to fall. A slowing economy helped cause the glut of pickup trucks because Chapter 3 Question 18: GRAPH Assume the figure to the right illustrates the market for houses for sale in a small city. Suppose the market price of houses is $250,000. How large will the resulting surplus be? At a price of $250,000, there will be 800 surplus houses. What is the equilibrium price is $150,000. Chapter 3 Question 19: GRAPH In the diagram to the right, when the price is $71 per player, the amount of the surplus is 56 million players per month. Chapter 3 Question 20: The market for corn in country A is highly competitive. At the current market price of $5/bushel there is a shortage of 100,000 bushels of corn in this country. Media reports claim that the price of corn will rise drastically in the near future. According to these reports, the neighboring country B had witnessed a similar situation recently. At the same price, the shortage in country B was also 100,000 bushels and eventually the equilibrium price in B went up to $10/bushel. Both countries are known to have equal number of corn producers and the market supply of corn is identical at all prices. This, combined with the fact that consumers in the two countries also have similar tastes and preferences, let the media to conclude that the price of corn in country A would soon be as high as $10/bushel. Which of the following is being assumed by the media while concluding that the price in country A will also rise to $10/bushel? Chapter 3 Question 21: The market for corn in country A is highly competitive. At the current market price of $5/bushel there is a shortage of 100,000 bushels of corn in this country. Media reports claim that the price of corn will rise drastically in the near future. According to these reports, the neighboring country B had witnessed a similar situation recently. At the same price, the shortage in country B was also 100,000 bushels and eventually the equilibrium price in B went up to $10/bushel. Both countries are known to have equal number of corn producers and the market supply of corn is identical at all prices. This, combined with the fact that consumers in the two countries also have similar tastes and preferences, let the media to conclude that the price of corn in country A would soon be as high as $10/bushel. This reasoning is flawed because it assumes that: a. . Chapter 3 Question 22: The market for corn in country A is highly competitive. At the current market price of $5/bushel there is a shortage of 100,000 bushels of corn in this country. Media reports claim that the price of corn will rise drastically in the near future. According to these reports, the neighboring country B had witnessed a similar situation recently. At the same price, the shortage in country B was also 100,000 bushels and eventually the equilibrium price in B went up to $10/bushel. Both countries are known to have equal number of corn producers and the market supply of corn is identical at all prices. This, combined with the fact that consumers in the two countries also have similar tastes and preferences, let the media to conclude that the price of corn in country A would soon be as high as $10/bushel. If the new equilibrium price turns out to be below $10/bushel, which of the following inferences can be drawn? Chapter 4 Question 1: GRAPH Dissolvable tobacco products contain less nicotine than cigarettes and can help people quit smoking. Suppose that figure to the right illustrates five consumers’ willingness to pay for tobacco lozenges. If the price of a pack of tobacco lozenges is $5.50, what is the consumer surplus for these consumers? Consumer surplus is $5.50 Chapter 4 Question 2: Firm A is a new producer in the market for good X, which is characterized by linear demand and supply curves. Initially, to attract customers, the firm prices its product low at $8 per unit. While the firm sells 1,000 units of the product at this price, there is a shortage in the market. This shortage can be cleared if price is increased to $10 per unit. The quantity demanded and supplied at this higher price will be 1,500 units. Which of the following is most strongly supported by this information? Chapter 4 Question 3: Firm A is a new producer in the market for good X, which is characterized by linear demand and supply curves. Initially, to attract customers, the firm prices its product low at $8 per unit. While the firm sells 1,000 units of the product at this price, there is a shortage in the market. This shortage can be cleared if price is increased to $10 per unit. The quantity demanded and supplied at this higher price will be 1,500 units. Rajiv Bose, a market analyst with firm A, claims that an increase in producer surplus would necessarily increase average profit for the firm. Which of the following, if true, would weaken Rajiv’s claim? Chapter 4 Question 4: Briefly explain whether you agree with the following statement: “If consumer surplus in a market increases, producer surplus must decrease.” Chapter 4 Question 5: Does an increase in economic surplus in a market always mean that economic efficiency in the market has increased? Briefly explain. Chapter 4 Question 6: Country Talmar produces 100,000 cars during a particular year. The market price of cars in Talmar is $5,000. In a recent meeting of the Economic Council, an economist, Carl Anderson claimed the nation’s production of cars was inefficiently high because the industry seemed to have positive inventory every year. Another economist, Tara Henderson, felt that the production was inefficiently low because there is a huge segment of the population that does not own cars. Which of the following statements are Tara and Carl likely to agree with? Chapter 4 Question 7: Country Talmar produces 100,000 cars during a particular year. The market price of cars in Talmar is $5,000. In a recent meeting of the Economic Council, an economist, Carl Anderson claimed the nation’s production of cars was inefficiently high because the industry seemed to have positive inventory every year. Another economist, Tara Henderson, felt that the production was inefficiently low because there is a huge segment of the population that does not own cars. Which of the following if true, would support Carl’s view? Chapter 4 Question 8: Country Talmar produces 100,000 cars during a particular year. The market price of cars in Talmar is $5,000. In a recent meeting of the Economic Council, an economist, Carl Anderson claimed the nation’s production of cars was inefficiently high because the industry seemed to have positive inventory every year. Another economist, Tara Henderson, felt that the production was inefficiently low because there is a huge segment of the population that does not own cars. Which of the following, if true, would support Tara’s view? Chapter 4 Question 9: GRAPH Use the information on the kumquat market in the following table to answer the questions. The equilibrium price is $15 and the equilibrium quantity is 100 million crates. Suppose the federal government imposes a price floor of $25 per crate and purchases any surplus kumquats from producers. Now how much revenue will kumquat producers receive? Kumquat producers will receive $4.5 billion in revenue. 1) Use the rectangular drawing tool to shade in the revenue received by kumquat producers before the price floor. Properly label the shaded area. 2) Use the rectangular drawing tool to shade in the revenue received by kumquat producers after the price floor. Properly label the shaded area. 3) Use the rectangular drawing tool to shade in the area representing the amount the government spends to purchase surplus kumquats. Properly label the shaded area. Chapter 4 Question 10: GRAPH Suppose the figure to the right represents a local cattle market. What would be the effect on this market of the local government regulating a price ceiling of $1.00 per pound? The market would have a shortage of 20 thousand pounds. Chapter 4 Question 11: The carpet industry in a developing country, A was going through difficult times. While this industry was once a major foreign exchange earner, there was a steady fall in production levels for the past three to four years. Workers, who had the requisite abilities to weave carpets, were finding it difficult to sustain themselves in this industry and began looking for opportunities elsewhere. Since the carpet industry was one of country A’s oldest industries, many people lobbied the government to take some action. Widespread support from various groups induced the government to invest heavily in the carpet industry last year. This was expected to boost the industry’s production level considerably. However, the increase in carpet production was much lower than expected. Which of the following, if true, could explain this outcome? Chapter 4 Question 12: A deadly hurricane caused substantial damage to corn produced in the eastern region of a small country, which is its main corn-producing belt. This resulted in acute shortage of corn in this country and the price increased. The government decided to introduce a price ceiling for corn in an attempt to prevent an abnormal price hike. Kyra, a student of economics, believed that this was not a good idea as it was likely to increase the shortage and create a huge deadweight loss. Her friend, Dona, however felt that the resultant deadweight loss may not be too high. Which of the following, if true, would support Kyra’s claim. Chapter 4 Question 13: GRAPH Consider the market illustrated in the figure to the right. Supply curve S1 represents the private cost of production and demand curve D1 represents the private benefit from consumption. Suppose the consumption of this good creates a negative externality. In turn, the social benefit from consumption is represented by demand curve D2. Show how the externality affects market efficiency. Use the triangle drawing tool to share in the new economic surplus (new surplus) or the deadweight loss (deadweight loss) created by the negative externality. Properly label this shaded area. Chapter 4 Question 14: Which of the following is not an example of an externality? An externality is not created by Chapter 4 Question 15: How do externalities affect markets? If a negative externality in production is present in a market, then Chapter 4 Question 16: How do externalities in the production of college educations result in market failure? Because of externalities, the market for college educations will a. b. . Chapter 4 Question 17: A coal-fired electric utility has a capacity of producing 500MW of electricity every month. To maximize its profit, the firm produces 400MW of electricity in a month. Kevin Peters, the president of an environmental advocacy group, claims that the production at this utility is inefficient and should be reduced by 200MW. The Environmental Protection Agency (EPA), however, has a different opinion. Although the EPA agrees that production needs to be reduced, it claims that the electric utility need not reduce production by as much as 200 MW. Which of the following, if true, would support Kevin’s claim? Chapter 4 Question 18: A coal-fired electric utility has a capacity of producing 500MW of electricity every month. To maximize its profit, the firm produces 400MW of electricity in a month. Kevin Peters, the president of an environmental advocacy group, claims that the production at this utility is inefficient and should be reduced by 200MW. The Environmental Protection Agency (EPA), however, has a different opinion. Although the EPA agrees that production needs to be reduced, it claims that the electric utility need not reduce production by as much as 200 MW. Which of the following, if true, would support the EPA’s view? Chapter 4 Question 19: The gross annual production of petrochemical plants situated in Jamnagar district of the Indian state of Gujarat is around 130 million tons. Each plant follows the profit-maximization principle and supplies petrochemicals up to the point where price equals the price marginal cost of production. Industry experts claim that the aggregate production of this industry is socially efficient because at this output level the supply of petrochemicals is equal to its demand. Which of the following, if true, would strengthen the claim of the industry experts that production is socially efficient? Chapter 4 Question 20: In a paper written for the Harvard Project on International Climate Agreements, the authors state that while a majority of developed nations are enacting significant regulations to mitigate climate change, “developing countries typically place greater priority on economic development than on environment protection, despite being vulnerable to the potential adverse effects of continued warming.” Recall the definition of normal goods. Is environmental protection a normal good? If so, is there any connection between this fact and the observation of the authors of the above statement? Briefly explain. How do the marginal cost and marginal benefit of environmental protection change with economic development? Environmental protection is The authors’ statement a. b. . Since developed countries have enacted more significant regulations to mitigate climate change than developing countries, it must be the case that for a given level of environmental protection, Chapter 4 Question 21: GRAPH Suppose the figure to the right represents the production of a manufactured good. Production of this good generates volatile organic compounds, which are a type of air pollution. As a result, the cost of production to society is greater than the private cost of production is represented by MC1 and the marginal social cost is represented by MC2. Suppose the government decides to impose a Pigovian tax to bring about an efficient level of output. What size should the tax be? The government should levy a tax of $225 per ton produced. Chapter 4 Question 22: Suppose the United States has two utilities, Commonwealth Utilities and Consolidated Electric. Both produce 20 million tons of sulfur dioxide pollution per year. However, the marginal cost of reducing a ton of pollution for Consolidated Electric is $200 per ton and the marginal cost of reducing a ton of pollution for Commonwealth Utilities is $250 per ton. The government’s goal is to cut sulfur dioxide pollution in half (by 20 million tons per year). If the government issues 10 million tradable pollution permits to each utility, what will be the cost of eliminating half of the pollution to society? Using a cap-and-trade system of tradable emission allowances will eliminate half of the sulfur dioxide pollution at a cost of $4,000 million per year. If the permits are not tradable, what will be the cost of eliminating half of the pollution? If permits cannot be traded, then the cost of the pollution reduction will be $4500 million per year. Chapter 4 Question 23: The advanced machinery used for limestone quarrying in a particular region leads to noise pollution and affects the hearing ability of people residing in the neighborhood. The quarrying activity also results in soil erosion. Blah blah blah. Which of the following, if true, would support the taxation policy proposed by the research group? Chapter 4 Question 24: The advanced machinery used for limestone quarrying in a particular region leads to noise pollution and affects the hearing ability of people residing in the neighborhood. The quarrying activity also results in soil erosion. Blah blah blah. Suppose the government responds by imposing a tax on the production of limestone. After the tax is imposed, total production of limestone declines by the amount the environmental research group had estimated. This convinces them that limestone production is now socially efficient. Which of the following conclusions can most reasonably be drawn from the given information? Chapter 4 Question 25: The government of Country X follows a cap-and-trade system of tradable emissions allowances. Each steel manufacturing firm in this country is permitted to release a maximum of 30 million pounds of pollutants annually, but the firms can freely trade their emission allowances with each other. Clemington Inc., an iron and steel manufacturer in this country, releases 1.2 million pounds of airborne pollutants into the atmosphere every year and had been asked by the pollution control department to reduce pollution. Stella Morris, a director at Clemington Inc., strongly recommends that the board buy the allowances from other steel plants instead of curbing production. Which of the following, if true, would strengthen Stella’s view? Chapter 7 Question 1: What is the definition of marginal utility? The law of diminishing utility suggests that: Marginal utility is more useful than total utility in consumer decision making because: Chapter 7 Question 2: TABLE The table below shows the relationship between the number of movies seen per month and the total utility received. Fill in marginal utility in the table below. In this example, consuming additional movies illustrates the law of diminishing marginal utility. Chapter 7 Question 3: Consider the demand for Ramen noodles. Suppose the price of Ramen noodles decreases. If Ramen noodles are a normal good, this will produce a positive substitution effect and a positive income effect. Chapter 7 Question 4: Explain how a downward-sloping demand curve results from consumers adjusting their consumption choices to changes in price. Chapter 7 Question 5: GRAPH The demand for lemonade for Luci (DL) and Kyle (DK) is illustrated in the figure to the right. Derive the market demand curve for lemonade if the market is comprised of only these two consumers. Use the line drawing tool, draw the market demand curve for lemonade in the figure to the right. Attach the provided label. Chapter 7 Question 6: GRAPH The table below shows the demand for tickets to professional basketball games for you, Gina, and Chad. Use the line drawing tool to draw the market demand curve for basketball tickets (assuming the market consists of you, Gina, and Chad). Label this line ‘Market Demand’. Chapter 7 Question 7: Suppose that Lady Gaga can sell out a concert at Madison Square Garden with tickets priced at $80 each. Lady Gaga’s manager estimates that the singer could still sell out the Garden at $130 per ticket. Why might Lady Gaga and her manager want to keep ticket prices at $80? Chapter 7 Question 8: Suppose that the Amazing Spider-man comes out, and hundreds of people arrive at a theater and discover that the movie is already sold out. Meanwhile, the theater is also showing a boring movie in its third week of release in a mostly empty theater. Why would this firm charge the same $8.00 for a ticket to either movie, when the quantity of tickets demanded is much greater than the quantity supplied for one movie, and the quantity of tickets demanded is much less than the quantity supplied for the other? Chapter 7 Question 9: What effect does a network externality have on the market for a product? If a network externality is present for a product, then Chapter 7 Question 10: Consider a form of public consumption such as wearing clothes. An individual’s demand for clothes depends on: Chapter 7 Question 11: Consider the ultimatum game, where an “allocator” is given, say, $50.00 to decide how to divide with a “recipient,” who then decides whether to accept or reject the allocation, ultimately determining whether the pair receives the allocation or nothing. What is the optimal play in the ultimatum game? The optimal play in the ultimatum game is for the allocator to propose a division of the money such that the recipient receives $.01 and the recipient then accepts the division. When the ultimatum game experiment is carried out, both allocators and recipients act as if fairness is important. Chapter 7 Question 12: Richard Thaler, an economist at the University of Chicago, is the person who first used the term endowment effect to describe placing a higher value on something already owned than would be placed on the object if not currently owned. According to an article in the Economist: Dr. Thaler, who recently had some expensive bottles of wine stolen, observed that he is “now confronted with precisely one of my own experiments: these are bottles I wasn’t planning to sell and now I’m going to get a cheque from an insurance company and most of these bottles I will not buy. I’m a good enough economist to know there’s a bit of an inconsistency there.” Based on Thaler’s statement, how do his stolen bottles of wine illustrate the endowment effect, and why does he make the statement: “I’m a good enough economist to know there’s a bit of an inconsistency there.” Thaler’s stolen bottles of wine illustrate the endowment effect because Thaler’s behavior is inconsistent because: a. b. . Chapter 7 Question 13: After owning a used car for two years, you start having problems with it. You take it into the shop and are told it will cost $4,000 to repair it. In considering whether to repair it or not, you should take what into consideration? Chapter 7 Question 14: In recent years, some economists have begun studying situations in which people does not appear to be making choices that are economically rational. This new area of economics is called behavioral economics. Why might consumers not act rationally? Consumers might: The most obvious reason why consumers might not act rationally would be that they do not realize that their actions are inconsistent with their goals. For example, consumers commonly commit the following three mistakes when making decisions: they take into account monetary cost but ignore nonmonetary opportunity costs. They fail to ignore sunk costs. They are overly optimistic about their future behavior. Chapter 7 Question 15: According to behavioral economists, why might consumers or businesses not act rationally? People might not act rationally because they Chapter 7 Question 16: The construction of a nuclear power plant near a town was heavily opposed by the residents once they became aware of the health risks that the plant could pose if it became operational. The opposition to the construction was on various grounds. Blah blah blah. The residents and the lobbyists most likely disagree on which of the following issues related to the power plant’s construction? Chapter 7 Question 17: What is the formula of the price elasticity of demand? The formula for the price elasticity of demand is: Why isn’t elasticity just measured by the slope of the demand curve? a. b. . Chapter 7 Question 18: GRAPH Consider the market for a new DVD movie, where the price is initially $12 and 36 copies are sold per day at a superstore, as indicated in the figure to the right. The superstore is considering lowering the price to $10. What is the price elasticity of demand between these two prices (use the Midpoint Formula)? The price elasticity of demand is -.61. Chapter 7 Question 19: GRAPH Consider the polar case where the price elasticity of demand is perfectly elastic. Use the line drawing tool to draw a perfectly elastic demand curve, Label this line ‘D’. Chapter 7 Question 20: When XYZ firm entered the market for good A two years back, it kept the price of its price of the product low to attract customers’ away from its leading competitor. The firm has now established itself and has a market share of 20 percent. The management of XYZ is planning to increase price of A from the current $6 per unit to $7 per unit. Blah blah blah. Which of the following is most strongly supported by the information above? Chapter 7 Question 21: Compare the price elasticity of demand for pepper with the price elasticity of demand for clothes. The price elasticity of demand for pepper is likely: Chapter 7 Question 22: Suppose Wendy’s hamburgers have many close substitutes available. If so, then an increase in the price of Wendy’s hamburgers will likely Chapter 7 Question 23: Suppose the price elasticity of demand for a Czech novel translated into English is perfectly inelastic. Assume the initial price of the translated novel is $23.00 and the quantity demanded is 509 copies per year. If the price is of the translated novel increases by $3.00 then the quantity demanded will be 509 copies per year. Next, suppose the price elastic of demand for a mystery novel by Stephen King is infinitely elastic. In this example, assume the initial price of the novel is $29.00 and the quantity demanded is 92 thousand copies per year. If the price of the mystery novel increases by $2.00, then the quantity demanded will be 0 copies per year. Chapter 7 Question 24: The price elasticity of demand for McDonald’s hamburgers should be more elastic than the price elastic of demand for all hamburgers. Chapter 7 Question 25: The Commerce Ministry of a conducts regular surveys on good and services sold within the country. Researchers at the Ministry study consumer behavior through the choices the consumers make while deciding what to buy. Their report on the industry for beverages last year indicated that the price elasticity of demand for fruit juices in the country was -0.8, while the price elasticity of demand for a particular brand called Fruit Drops was -1.2. blah blah blah. Which of the following conclusions can most reasonably be drawn from the information given in the question? Chapter 7 Question 26: The price of organic apples falls and apple growers find that their revenue increases. Is the demand for organic apples elastic or inelastic? The demand for organic apples is elastic. Chapter 7 Question 27: Two managers have the following conversation. Manager 1: “The only way we can increase the revenue we receive from selling our frozen pizzas is by cutting the price.” Manager 2: “Cutting the price of a product never increases the amount of revenue you receive. If we want to increase revenue, we have to increase price.” Do you agree with the reasoning of Manager 2? a. b. . Chapter 7 Question 28: GRAPH Consider the demand curve illustrated in the figure to the right. Is demand elastic or inelastic? At what price is total revenue maximized? Total revenue is maximized when price equals $8. Chapter 7 Question 29: A firm sells 3,000 headphones at a price of $3 per unit. Even through this price is slightly higher than competing brands, the management is considering a further increase in price by 25 cents. The firm plans to focus advertising efforts on superior sound clarity. Rachel, the firm’s marketing head, feels confident that a price increase by 25 cents will increase revenue. Blah blah blah. Which of the following are both the management and the industry analysts likely to agree with? a. . Chapter 7 Question 30: A firm sells 3,000 headphones at a price of $3 per unit. Even through this price is slightly higher than competing brands, the management is considering a further increase in price by 25 cents. The firm plans to focus advertising efforts on superior sound clarity. Rachel, the firm’s marketing head, feels confident that a price increase by 25 cents will increase revenue. Blah blah blah. Which of the following, if true, would indicate that any increase Chapter 9 Question 1: What are the three conditions for a market to be perfectly competitive? For a market to be perfectly competitive there must be Chapter 9 Question 2: What is a price taker? A price taker is: When Chapter 9 Question 3: GRAPH Consider the graph below showing the market demand and supply for corn. Use the line drawing tool to graph the demand for the corn produced by one corn farmer. Properly label this line. Chapter 9 Question 4: GRAPH Suppose Farmer Smith grows apples. The entire market for apples is show in the figure below. Assume the market for apples is perfectly competitive. Use the line drawing tool to draw the demand curve for farmer Smith’s apples. Label this line ‘Demand for Smith apples’. Chapter 9 Question 5: How are prices determined in perfectly competitive markets? In perfectly competitive markets, prices are determined by: Chapter 9 Question 6: What characterizes perfectly competitive markets? Chapter 9 Question 7: Explain why it is true that for a firm in a perfectly competitive market that P=MR=AR. In a perfectly competitive market, P=MR=AR because: a. Firms can sell as much output as they want at the market price. Chapter 9 Question 8: How should firms in perfectly competitive markets decide how much to produce? Perfectly competitive firms should produce the quantity where: Chapter 9 Question 9: CHART Farmer Jones grows oranges in Florida. Suppose the market for oranges is perfectly competitive and that the market price for a crate of oranges is $18 per crate. Fill in total revenue, average revenue, and marginal revenue in the table below. Chapter 9 Question 10: GRAPH The graph to the right shows a firm in a perfectly competitive market operating at a loss. The graph includes the firm’s marginal cost curve, average total cost curve, and average variable cost curve. Use the line drawing tool to graph the firm’s demand curve. Label this line ‘Demand’. Use the point drawing tool to plot the firm’s profit-maximizing price and quantity. Label this point ‘Point A’. Use the rectangle drawing tool to shade in the firm’s profit (Profit/Loss). Properly label this shaded area. Chapter 9 Question 11: GRAPH The figure to the right illustrates the average total cost (ATC) and marginal cost (MC) curves for an orange farmer in California. Assume the market for oranges is perfectly competitive. Suppose the market price of oranges is $28.00 per crate. Characterize the farmer’s profit. At $28.00 price, the farmer will make a profit. The orange farmer will make a profit if the price of oranges is above $20 per crate. Chapter 9 Question 12: Which of the following is an expression of profit for a perfectly competitive firm? Profit for a perfectly competitive firm can be expressed as: a. Profit=(P-ATC)XQ, where P is price, Q is output, and ATC is average total cost. Chapter 9 Question 13: GRAPH The figure to the right illustrates the average total cost (ATC) and marginal cost (MC) curves for an apple farmer. Assume the market for apples is perfectly competitive. IF the market price for apples is $42.00 per crate, then what will be this apple farmer’s profit? Use the rectangle drawing tool to shade in the apple farmer’s profit. Label this shaded area ‘Profit’. Chapter 9 Question 14: GRAPH Lauren grows grapes. Her average variable cost (AVC), average total cost (ATC), and marginal cost (MC) of production are illustrated in the figure to the right. Assume the market for grapes is perfectly competitive and that the market price is $2.00 per crate. Characterize Lauren’s economic profits. Assume she produces such that she maximizes profits in the short run. Using the rectangle drawing tool, shade in Lauren’s economic profits. Attach the correct label to indicate whether she is earning a profit (Profit) or incurring a loss (Loss). Chapter 9 Question 15: What is the difference between a firm’s shutdown point in the short run and its exit point in the long run? In the short run, a firm’s shutdown point is the minimum point on the: a. Average variable cost curve, while in the long run, a firm’s exit point is the minimum point on the average total cost curve. Why are firms willing to accept losses in the short run but not in the long run? a. There are sunk costs in the short run but not in the long run. Chapter 9 Question 16: GRAPH The market for corn is perfectly competitive with 1,000 farmers. Suppose the farmers have identical short-run cost curves, which are illustrated in the figure below. Describe the market’s supply curve. Use the line drawing tool to draw the short-run market supply curve for the corn. Label this line ‘Supply’. Chapter 9 Question 17: GRAPH The figure to the right represents the cost structure for a perfectly competitive firm with its average total cost (ATC) curve, average variable (AVC) curve, and marginal cost (MC) curve. Fixed costs are $50.00. Suppose the market price is $18.00 per unit. Characterize the firm’s profit. If the firm produces output, then it will experience losses. Should the firm instead shut down in the short run? In the short run, the firm should a. Continue to produce because price is greater than average variable cost. Chapter 9 Question 18: Bob is a general contractor in the construction industry. Suppose the construction industry is perfectly competitive. In the short run, assume the marginal cost of building new homes equals the market price of a new home when Bob builds 10 new homes. At this level of output, bob’s average fixed cost of building a new home is $200,000 and his average variable cost is $160,000 per home. (so his average total cost is $360000 per home). If new homes are selling for $170,000, should he continue to produce 10 new homes in the short run or shut down? In the short run, Bob should produce and lose $1,900,000. Chapter 9 Question 19: What is the supply curve for a perfectly competitive firm in the short run? The supply curve for a firm in a perfectly competitive market in the short run is: a. That firm’s marginal cost curve for prices at or above average variable cost. Chapter 9 Question 20: Would a firm earing zero economic profit continue to produce, even in the long run? In the long-run competitive equilibrium, a firm earning zero economic profit: a. Will continue to produce because such profit is as high a return as could be earned elsewhere. Chapter 9 Question 21: GRAPH Discuss the shape of the long-run supply curve in a perfectly competitive market. The long-run supply curve is: a. A horizontal line equal to the minimum point on the typical firm’s average total cost curve. Suppose that the perfectly competitive market illustrated in the graph to the right is initially in long-run equilibrium (at P1) and then there is a permanent decrease in the demand for the product (to D2). Show how the market adjusts in the long run. Use the line drawing tool to add either a new demand curve or a new supply curve showing the market in the long-run equilibrium. Properly label this line. Use the point drawing tool to identify the new long-run market equilibrium price and quantity. Properly label this point. Chapter 9 Question 22: TABLE Xavier is an accountant who provides tax services through his own firm. To provide these services he must rent an office for $14,000 per year, hire a secretary for $30,000, and spend $6,000 per year in advertising. Xavier’s total revenue from his tax services is $82,000 per year. Suppose Xavier’s firm is in a perfectly competitive industry and that he could otherwise earn $32,000 per year working as an accountant in another firm. Assuming Xavier’s profits are representative of the industry, describe what will likely happen to Xavier’s profits in the long run. a. Xavier is breaking even and should continue to produce to continue breaking even in the long run. Chapter 9 Question 23: GRAPH The figure to the right represents the cost structure for a perfectly competitive firm with its average total cost (ATC) curve, average variable (AVC) curve, and marginal cost(MC) Curve. Suppose the market price is $14.00 per unit. Will firms enter or exit the industry in the long run? If market price is $14.00, then firms will enter the market in the long run. What effect will firms entering have on the market? When firms enter, a. Market supply will increase, decreasing price. Chapter 9 Question 24: Suppose the market for cotton is perfectly competitive and that input prices increase as the industry expands. Characterize the industry’s long-run supply curve. The cotton industry’s long-run supply curve will be: a. Upward sloping because the long-run average cost of production will be increasing. Chapter 9 Question 25: GRAPH the figure to the right represents the market for peaches. Assume the market for peaches is perfectly competitive and a constant-cost industry. Also assume the industry is initially in long-run equilibrium. Then, the demand for peaches decreases, as shown, from D1 to D2. Use the line drawing tool to draw the new market supply curve (S2) and the long-run industry supply curve (SLR). Properly label this line. Chapter 9 Question 26: Suppose you read the following item in a newspaper article, under the headline “Price Gouging Alleged in Pencil Market”: Consumer advocacy groups changed at a press conference yesterday that there is widespread price gouging in the sale of pencils. They released a study showing that whereas the average retail price of pencils was $1.00, the average cost of producing pencils was only $0.50. blah blah blah. Which of the following is not likely to happen in the pencil market? a. Firms will charge a price above marginal cost in the long run. Chapter 9 Question 27: GRAPH In 2011, Sony announced that it had lost money selling televisions for the seventh straight year. Given the strong consumer demand for plasma, LCD, and LED television sets, shouldn’t Sony have been able to raise prices to earn a profit? Illustrate on the graph to the right how an increase in demand could result in a lower market price. Use the line drawing tool to draw the new demand curve. Properly label this line. Use the line drawing tool to draw the new supply curve. Properly label this line. Use the point drawing tool to indicate the new equilibrium price and quantity. Label this point ‘E2’. Chapter 9 Question 28: Assume the market for oranges is perfectly competitive. If the demand for oranges increases, will the market supply additional oranges? IF the demand for oranges increases, then the market: a. Will supply additional oranges because producers seek the highest return on their investments. Homework Chapters 10,12, 13, 14 Chapter 10 Ch. 10 1. The great baseball player Ty Cobb was known for being very thrifty. Near the end of his life he was interviewed by a reporter who was surprised to find that Cobb used candles, rather than electricity to light his home. From Ty Cobb’s point of view, was the local electric company a monopoly? D. was not a monopoly because candles were a good substitute for electricity Ch. 10 2. Some observers say that changes in the past few years have eroded the monopoly power of local cable TV companies, even though no other cable firms have entered their markets. What are these changes? A. Technology now makes it feasible to receive signals relayed by satellite from distant broadcast stations. B. Congress has loosened regulations on rebroadcasting distant stations. D. Both a and b Ch. 10 3. A newspaper article has the headline “Google Says It’s Actually Quite Small.” According to the article: Google rejects the idea that it’s in the search advertising business, an industry in which it holds more than a 70 percent share of revenue. Instead, the company says its competition is all advertising, a category broad enough to include newspaper, radio and highway billboards. Google cares whether people think it is large or small because A. even the perception of dominance can bring about plenty of litigation that may jeopardize its business Do highway billboards actually provide competition for Google? All of the following are true except: C. Highway billboards are used by the firms to target consumers at the point of sale whereas Google provides only some information Ch. 10 4. A form of market structure studied by economists is monopoly. When is a firm a monopoly, or are monopolies only theoretical concepts that do not exist? B. A firm is a monopoly if it can ignore the actions of all other firms. 5. Economists have developed broad and narrow definitions to identify monopolies. What is a characteristic that supports a firm being classified as a monopoly? Economists could find that a firm is a monopoly if 6. Substitutes exist for just about every product, so can a firm ever really be a monopoly? A firm can Ch. 10 7. If patents reduce competition, why does the federal government grant them? The federal government grants patents Ch. 10 8. What is “natural” about a natural monopoly? A natural monopoly Ch. 10 9. Suppose the quantity demanded per day for a product is 120 when the price is $35. The following table shows costs for a firm with a monopoly in this market. Briefly explain whether this firm has a natural monopoly in this market. Ch. 10 10. For many years, De Beers of South Africa essentially operated as a monopoly. What made this company a monopoly? De Beers of South Africa was essentially a monopoly because Ch. 10 11. Governments often have the potential to influence whether firms are monopolies. How might the government affect whether a firm is a monopoly? The government could E. grant a firm a public franchise, making it the exclusive legal provider of a good or service Ch. 10 12. One of the reasons why monopolies exist is because the government blocks the entry of more than one firm into a market. How might the government do this? The government could block entry by A. issuing copyrights granting the exclusive right to use a creation during the creator’s lifetime. Ch. 10 13. Ed Seahill has acquired a monopoly on the production of baseballs (don’t ask how) and faces the demand and cost situation given in the following table. refer to HWK for tables Ch. 10 14. Suppose that Comcast has a cable monopoly in Philadelphia. The following table gives Comcast’s demand and costs per month for subscriptions to basic cable. Suppose the local government imposes a $27 per month tax on cable companies. What will Comcast do? (Assume fixed costs equal $15.) C. Comcast should produce 6 units in the short run and shut down in the long run. Ch.10 15. Describe a monopoly’s demand curve. A monopoly’s demand curve D. is the same as the demand curve for the product Ch. 10 16. Suppose the figure to the right represents the market for diamond necklaces, where the company that supplies necklaces is a monopoly because it is the only firm with access to diamond mines. What is the firm’s profit-maximizing price and quantity? What are profits? Refer to HWK for chart Ch. 10 17. A pharmaceutical corporation has developed a unique new drug, making the company a monopoly. Demand for new drug (D), the corresponding marginal revenue (MR), and the firm’s cost structure (marginal cost is MC) are illustrated in the figure to the right. What are the company’s profit-maximizing price and quantity? Refer to HWK for chart Ch. 10 18. Suppose that a perfectly competitive industry becomes a monopoly. As a result, consumer surplus will decrease, producer surplus will increase, and deadweight loss will increase. Ch. 10 19. Which are most economically efficient, perfectly competitive markets or monopolies? Compared to monopolies, perfectly competitive markets are C. more economically efficient because they result in more economic surplus. Ch. 10 20. Suppose Boeing has developed a new airplane (call it the Boeing 787) that is one-of-a-kind, without close substitutes, making Boeing a monopoly. The demand for the new plane (D), the corresponding marginal revenue (MR), and the firm’s cost structure (marginal cost is MC) are illustrated in the figure to the right. When maximizing profit, does Boeing generate deadweight loss? Refer to the HWK for chart Ch. 10 21. Is the loss in efficiency due to market power large or small? Explain. The loss in efficiency due to market power is E. small because competition limits market power, even when the market is not perfectly competitive. Ch. 10 22. Are monopolies economically efficient? Consider the market to the right. Compared to the perfectly competitive outcome, what would be the change in surplus if instead the market had one supplier that was a monopoly? Refer to the HWK for chart Ch. 10 23. Monopolies are recognized to create deadweight loss. How large are the efficiency losses due to monopoly? Economists generally agree that efficiency losses due to monopolies in the economy are C. small because true monopolies are very rare Ch. 10 24. What is the difference between a horizontal merger and a vertical merger? A horizontal merger is a merger Ch. 10 25. Use the graph to the right for a monopoly to answer the questions. What quantity will the monopoly produce, and what price will the monopoly charge? Refer to HWK for chart Suppose the government decides to regulate this monopoly and imposes a price ceiling of $2.60 (in other words, the monopoly can charge less than $2.60 but can’t charge more). Ch. 10 26. Before they merged in 2008, Sirius Satellite Radio and XM Satellite Radio were the only two satellite radio firms. In announcing that it would not oppose the merger, the Justice Department said that: “evidence developed in the investigation did not support defining a market limited to the two satellite radio firms.” It believed that the two firms also competed with “other sources of audio entertainment, including traditional AM/FM radio, HD Radio, MP3 players (e.g., iPods), and audio offerings delivered through wireless telephones.” Why would defining the size of the market in which the two firms competed be important to the Justice Department in deciding whether to oppose the merger? How the market is defined is important when the Justice Department evaluates proposed mergers because Ch. 10 27. Look again at the section “The Department of Justice and the Federal Trade Commission Merger Guidelines” in the textbook. Evaluate the following situations: A market initially has 20 firms, each with a 5 percent market share. Of the firms, 8 propose to merge, leaving a total of 13 firms in the industry. Are the Department of Justice and the Federal Trade Commission likely to oppose the merger? The Department of Justice and the Federal Trade Commission would challenge such a merger. A market initially has 5 firms, each with a 20 percent market share. Of the firms, 4 propose The Department of Justice and the Federal Trade Commission would challenge such a merger. Ch. 10 28. In October 2008, Delta Airlines completed its acquisition of Northwest Airlines. The newly merged company is the largest airline in the world. The following statement regarding the merger is from a Justice Department press release: After a thorough, six-month investigation, during which the [Antitrust] Division obtained extensive information from a wide range of market participants- including the companies, other airlines, corporate customers and travel agents-the Division has determined that the proposed merger between Delta and Northwest is likely to produce substantial and credible efficiencies that will benefit U.S. consumers and is not likely to substantially lessen competition. What is meant by “substantial and credible efficiencies,” and how might they benefit U.S. consumers? If the Delta-Northwest merger creates “substantial and credible efficiencies,” then the merger Why would a merger between the two large airlines not be “likely to substantially lessen competition”? The Delta-Northwest merger might not be likely to substantially lessen competition because Ch. 10 29. The following table shows the market shares during the last three months of 2010 for companies in the U.S. personal computer (PC) market, which includes desk-based PCs, mobile PCs, such as mini-notebooks, but not media tablets, such as the iPad. Use the information in the section “The Department of Justice and FTC Merger Guidelines” to predict whether the Department of Justice and the FTC would be likely to oppose a merger between any of the five firms listed in the table. Assume that “Other” in the table consists of three firms, each of which has a six percent market share. Considering mergers between any two of the five named firms, the Department of Justice and the FTC CHAPTER 12 Ch. 12 1. “In years when people buy few shares of stock, investment will be low and, therefore, so will gross domestic product (GDP).” Ch. 12 2. The figure shows the values of the components of GDP for the year 2006. Based on the data shown, which of the following statements regarding the components of GDP are false? Please refer to HWK for graph Ch. 12. 3. Which of the following statements about the consumption component of GDP is not correct? Ch. 12 4. Indicate whether each of the following is a final good, an intermediate good, or neither. Coffee beans purchased by a coffee shop-Intermediate good One share of Google stock-Neither A new pick-up truck purchased by a consumer-Final good A new home purchased by a family-Final good Ch. 12 5. Which of the following equations sums up the components of Gross Domestic Product (GDP)? A. Y = C + I + G + NX Ch. 12 6. Transfer payments are not included in GDP calculations because A. Transfer payments are simply transfers of income from one group to another and not a purchase of a new good or service. Ch. 12 7. The following table illustrates the value added approach to calculating GDP. Please complete. Refer to HWK Ch. 12 8. During the current year, the government in the country of Brungaria has adopted a fiscal stimulus package to boost economic growth. The stimulus package is a major factor behind the increase in government purchases this year. As a result of these policies, Brungaria will experience a substantial increase in overall employment, gross investment, and consumption expenditure. In response, the Economic Advisory Committee of the government announces at a press conference that these results will ensure that Brungaria’s GDP will be higher this year than it was in the previous year. Which of the following, if true, would undermine the claim of the Economic Advisory Committee? C. Brungaria’s exports have fallen significantly in the current year. Ch. 12 9. The Council of Economic Advisors to the President of a country reported gross investment expenditure at $400,000 during a particular year. The group excluded from this valuation an amount of $50,000 spent by an existing domestic firm during the year. Mark, an economist, argued that this amount should have been included under the business fixed investment component of GDP. Which of the following, if true, would support Mark’s argument? A. The firm purchased new machinery worth $50,000 for its production facility during that year. Ch. 12 10. Real-Time Data Analysis Exercise from FRED Refer to HWK Ch. 12 11. Real-Time Data Analysis Exercise from FRED Refer to HWK Ch. 12 12. Real-Time Data Analysis Exercise from FRED Refer to HWK Ch. 12 13. Real-Time Data Analysis Exercise from FRED The following table contains some investment data from FRED for the fourth quarter of 2014. Refer to HWK The difference between gross private domestic investment and fixed private investment represents inventory investment Ch. 12 14. Which of the following are likely to increase the measured level of GDP and which are likely to reduce it? a. When the number of people working outside the home increases, the measured level of GDP increases. b. When there is a sharp increase in the crime rate, the measured level of GDP may increase or decrease. c. If higher tax rates cause more people to hide the income they earn, the measured GDP decreases. Ch. 12 15. Michael Burda of Humboldt University in Germany and Daniel Hamermesh of the University of Texas examined how workers in the United States who lost their jobs between 2003 and 2006 spent their time. They discovered that during the period when they were unemployed, the reduction in the number of hours paid work was almost completely replaced by an increase in the number of hours spent on household production. Based on these findings, what can we predict about total production-whether or not that production is included in the calculation of GDP-in the economy when these workers became unemployed? D. If the workers had been paying other people to perform the household activities prior to unemployment, then total production will fall. Ch. 12 16. Roger Ransom and Richard Sutch, economic historians at the University of California Riverside, have estimated that African-American farmers in the U.S. South after the Civil War worked about 30 percent fewer hours per year than they had as slaves during the years before the Civil War. If after the Civil War, African-American farmers had continued to work these additional hours, their production and income would have been higher and so would have been U.S. GDP. The farmers’ well-being B. would not have been higher as a result of working these additional hours because value of individual’s well-being is not included in GDP calculation. After the Civil War, U.S. GDP B. could have been higher if the farmers did not reduce their work hours Ch 12 17. Real GDP per capita is often used as a measure of general well-being. While increases in real GDP often do lead to increases in the well-being of the population; why is real GDP not a perfect measure of well-being? A. The value of leisure is not included B. The costs of pollution are not included C. GDP does not include crime rates or income distribution D. All of the above Ch. 12 18. The GDP of the country Sumeria has grown at an average rate of 6 percent over the last two years, while the rate of inflation has remained more or less stable. Macroeconomics in the country are arguing that this increase in GDP is a clear indication of an overall improvement in the well-being of its people. Which of the following, if true about the last two years in Sumeria, would strengthen this argument? D. An increasing percentage of the population is choosing leisure time over time spent in the work force. Ch. 12 19. Chart referring to Nominal GDP in 2011 & 2012 and Real GDP in 2011 & 2012. Refer to . In 2012, the value of the GDP deflator is 120. Ch. 12 20. Real-Time Data Analysis Exercise from FRED Refer to HWK Ch. 12 21. Consider the following table: refer to HWK for table National income (NI) equals $11860 billion Ch. 12 22. Suppose the amount the federal government collects in personal income taxes increases, while the level of GDP remains the same. What will happen to the values of national income, personal income, and disposable personal income? Ch. 12 23. Disposable personal income is Ch. 12 24. The table and figure above show GDP measured in terms of the total income received by households. Use the table and figure to help determine which of the following statements about the division of income is false Ch. 12 25. The largest component of gross domestic income is A. wages Ch. 12 26. National income is Ch. 12 27. Ethan has been comparing the economic data of the two countries of Glenshire and Nebuloz. He finds that the GDP of Glenshire has been higher than that of Nebuloz during the last five years. The former country recorded a much higher GDP growth rate during these years and its domestic currency also had more value than the currency of Nebuloz. On the basis of all this information, Ethan tried to convince his friend that Glenshire would be a much better country to live in than Nebuloz. Each of the following, if true, would strengthen Ethan’s argument, except one. Identify the exception. Ch. 12 28. Real-Time Data Analysis Exercise from FRED Refer to HWK Since GNP exceeds GDP, it can be conluded that foreign production by U.S. firms exceeds U.S. by foreign firms. For countries having a significant fraction of domestic production occurring in foreign-owned facilities, the GDP will likely exceed GNP. Ch. 12 29. Real-Time Data Analysis Exercise from FRED Refer to HWK The difference between personal income and disposable income represents personal tax. Given the ratio of personal consumption to disposable income shown in the table above along with the fact that disposable income rises dollar-for-dollar with a tax reduction, it may be concluded that a tax cut will be largely spent by households. Ch. 12 30. Real-Time Data Analysis Exercise from FRED Refer to HWK , the implication is that the fourth quarter of 2014 saw households engaged in saving. The difference between personal income and disposable personal income represents personal tax payments which, in the fourth quarter of 2014, amounted to $1792.1 billion. Given the ratio of personal consumption to disposable income shown in the table above along with the fact that disposable income rises dollar-for-dollar with a tax reduction, it may be concluded that a tax cut will be largely spent by households. Chapter 13 Ch. 13 1. How does the U.S. economy create and destroy millions of jobs every year? (Mark all the apply) A. In the market system, new firms are constantly entering and exiting with various Ch. 13. 2. Use the figure to determine which one of the following statements is true: refer to HWK Ch. 13 3. Suppose that the economy enters into a recession and that, as a result, Rusty Z. Wrench loses his job as a delivery truck mechanic and remains unemployed. When the economy recovers, Rusty’s previous employer rehires him. What is the best classification for his time as an unemployed truck mechanic? Ch. 13 4. Suppose John Q. Worker is currently unemployed. Each day, John Q. Worker spends the entire day searching available job openings for an appropriate position given his set of skills, abilities, and interests. If someone asks John Q. what he does for work, he tells them that he is currently “in-between jobs”. Which of the following best classifies John Q.’s unemployment status? Ch. 13 5. When the economy is at full employment, Ch. 13 6. Cyclical unemployment I unemployment caused by a recession. As output (GDP) is increasing, the amount of cyclical unemployment would decrease Ch. 13 7. Suppose that Sally J. Society recently lost her job as an underwater welder. In looking for a new job, she discovers that the only available jobs are for economists and that there are no openings for underwater welders because the trade is now obsolete. If Sally J. Society decides to return to school to earn an Economics degree, what is the best classification of her unemployment status? Ch. 13 8. Real-Time Data Analysis Exercise refer to HWK Ch. 13 9. The figure in the window on the right shows the average yearly unemployment rate for the 10-year period from 1999 to 2008 for the United States, Canada, Japan, and several Western European countries. refer to HWK for figure Based on the data from the figure on the right which one of the following statements is true? Ch. 13 10. What effect do labor unions have on the unemployment rate? Ch. 13 11. What is the relationship between the unemployment rate and enacting or increasing a minimum wage? Ch. 13 12. How do unemployment insurance payments in the United States and social insurance programs in other countries increase the unemployment rate? Ch. 13 13. What is the difference between the consumer price index and the producer price index? Ch. 13 14. What index is used to measure the average prices paid by a typical family? An average of the prices of the goods and services purchased by a typical family is the Ch. 13 15. Which of the following can give an early warning of future increases in the price level? A. producer price index Ch. 13 Ch. 13 18. Your father earned $34,000 per year in 1984. To the nearest dollar, what is that equivalent to in 2008 if the CPI in 2008 is 215 and the CPI in 1984 is 104? C. $70,288 Ch. 13 19. Price indexes can be used to compare prices across different periods. Suppose that a year of tuition for college at public institutions averaged a cost of $1,903 in 1989 and that the CPI index was 114 in 1989. Suppose that the actual average cost of tuition in 2009 was $7,980. Relative to the expected cost computed above, the cost of tuition increased by more than the amount of inflation. Ch. 13 22. Suppose you were borrowing money to buy a car. Consider the following situations. Situation 1: Suppose the interest rate on your car loan is 15.00 percent and the inflation rate is 14.00 percent. Calculate the real interest rate. 1% Situation 2: Suppose the interest rate on your car loan is 5.00 percent and the inflation rate is 2.00 percent. Calculate the real interest rate. 3% Ch. 13 23. The central bank of the county Iberia recently announced a reduction in the interest rate by 150 basis points. Following this announcement, Matthew Boulder, who is interested in buying a house, expects the real interest rates also to fall. However, he notices that the real interest rate in the economy has actually increased. Which of the following is most likely to explain this outcome? Ch. 13 24. Maria Tivlinsky and Harry Davis, both interns at an economics research institute in the country Southville, are discussing the effects of the increase in the supply of unskilled labor in the economy. Maria says that the average nominal wage paid to unskilled labor is likely to fall. This, according to her, would cause firms to hire more workers and will reduce unemployment in the country. Harry however, does not think that unemployment will necessarily fall; too many workers looking for jobs could depress wages and employment prospects on the whole. Which of the following, if true, is likely to weaken Harry’s claim that unemployment will not fall? Ch. 13 25. Maria Tivlinsky and Harry Davis, both interns at an economics research institute in the country Southville, are discussing the effects of the increase in the supply of unskilled labor in the economy. Maria says that the average nominal wage paid to unskilled labor is likely to fall. This, according to her, would cause firms to hire more workers and will reduce unemployment in the country. Harry however, does not think that unemployment will necessarily fall; too many workers looking for jobs could depress wages and employment prospects on the whole. It was observed that overall employment in the country did not increase during the next year. Which of the following, if true, would explain this? Ch. 13 26. Real-Time Data Analysis Exercise refer to hwk Ch. 13 27. Suppose that News Corporation, the owner of the Wall Street Journal, and the investors buying the firm’s bonds both expect a 4 percent inflation rate for the year. Further, suppose the nominal interest rate on bonds is 7 percent and the expected real interest rate is 3 percent. Now suppose that a year after the investors purchase the bonds, the inflation rate turns out to be 3 percent, rather than the 4 percent that had been expected. In this situation, investors win and borrowers lose. Ch. 13 28. Which of the following is not a cost created by high inflation? Ch. 13 29. Indicate whether the following statement is true or false and why. “A wage rising slower than the rate of inflation is actually falling.” Ch. 13 30. The working-age population in Concordia was estimated to be 6.5 million in a certain year. The country’s labor department announced that the total number of unemployed people in the country had gone up to 460,000 during this year while, the total number of people out of the labor force decreased to 2,000,000. Oscar Lewis, a student of labor economics believes that the labor department data is flawed. The government of Concordia adopted expansionary fiscal polices in the last two years with the aim of increasing employment. However, the government has been unable to bring down the unemployment rate in the country. Which of the following, if true, best explains this outcome? B. The government implemented a generous welfare plan 3 years ago to support people who cannot find work. Chapter 14 Ch. 14 1. What is the rule of 70? The rule of 70 Ch. 14 2. Suppose you had a choice between living in the United States in 1900 with an income of $1,037,000 per year or in the United States in 2012 with an income of $55,000 per year. Assume the incomes for both years are measured in 2012 dollars. In which year would you have the highest real income? 1900 In which year would you have the better standard of living? 2012 Ch. 14 3. Real GDP per capita in the United States, as mentioned in the chapter, grew from about $5,600 in 1900 to about $42,200 in 2010, which represents an annual growth rate of 1.8 percent. If the United States continues to grow at this rate, it will take 38.9 years for real GDP per capita to double. If government economic policies meant to stimulate economic growth result in the annual growth rate increasing to 2.3 percent, it will take 30.4 years for real GDP per capita to double. Ch. 14 4. Capital can be differentiated between physical capital and human capital. Human capital is B. the knowledge and skills workers acquire from education and training or from their life experiences Ch. 14 5. Between 1950 and the mid-1990s, the United States experienced a much larger increase in the standard of living than the Soviet Union. This difference can be most attributed to the fact that the U.S. Which of the following is a reason the U.S. experienced larger economic growth than the Soviet Union? (Check all that apply) Ch. 14 7. Real-Time Data Analysis Exercise refer to HWK Ch. 14 11. Crowding out occurs when Ch. 14 12. The ease with which a financial security can be exchanged for money is referred to as D. liquidity Even though individuals earn interest on financial investments such as bonds, mutual funds, and certificates of deposits, they may still hold wealth in checking accounts because A. individuals need money that is available to be spent on goods and services Ch. 14 13. Evaluate the following statement: “Saving money is not lending. How can it be? When I save my money, I put it in a bank. I don’t loan it out to someone else.” The statement is Ch. 14 14. Evaluate the following statement: “Saving money is not lending. How can it be? When I save my money, I put it in a bank. I don’t loan it out to someone else.” The statement is Ch. 14 15. In a closed economy, the values of GDP, consumption spending, investment spending, transfer payments, and taxes are as follows: Y= $13 trillion C=$10 trillion I=$4 trillion TR=$3 trillion T=$4 trillion Using the information above, what is the value of private saving and public saving? C. Private saving equals $2 trillion and public saving equals $2 trillion Ch. 14 16. Real-Time Data Analysis Exercise refer to HWK 17. Real-Time Data Analysis Exercise refer to HWK 18. Real-Time Data Analysis Exercise refer to HWK Ch. 14 19. What are the names of the following events in a business cycle? a. The high point of economic activity is called- a peak b. The low point of economic activity is call- a trough c. The period between the high point of economic activity and the following low point is called-a recession d. The period between the low point of economic activity and the following high point is called-an expansion Ch. 14 20. Which of the following describes the effect of the business cycle on the inflation rate and the unemployment rate? Why might the unemployment rate continue to rise during the early stages of a recovery? A. Employment growth may be slow relative to the growth in the labor C. Some firms continue to operate well below their capacity even after a recession has ended. D. Because both (a) and (c) are true Ch. 14 21. Consider the following choices. Which one of the following choices is correct? Many economists agree that this difference is due to all of the following reasons except: B. Since the 1950s, people have become more rational and control their spending behavior countercyclically Ch. 14 22. Which of the following contribute(s) to shorter recessions, longer expansions, and less severe fluctuations in real GDP? (Mark all that apply) A. A service-based economy B. Social Security benefits C. Monetary policy D. Al of the above Ch. 14 23.Refer to HWK for panel Panel (a) above shows an idealized business cycle. Panel (b) shows an actual business cycle by plotting fluctuations in real GDP during the period from 1999 to 2002. Use the graphs to help determine which one of the following is NOT true: Ch. 14 24. refer to HWK for graph Use the graph to help determine which of the following statements regarding fluctuations in real GDP is true: Ch. 14 25. refer to HWK for panel Panel (a) shows movements in real GDP for each quarter from the beginning of 1990 through the end of 2006. Panel (b) shows movements in the number of passenger aircraft shipped by Boeing for the same years. Use the graphs above to determine which on the following statements is true: A. The effects of the recessions on Boeing are much more dramatic and long-lived than the effects on the economy as a whole. Ch. 14. 26. refer to HWK for graph Use the graph to help determine which of the following statements regarding inflation and business cycles is true. Note: The points on the figure represent the annual inflation rate measured by the change in the consumer price index (CPI) for the year ending in the indicated month. D. Toward the end of the 1991-2001 expansion, the inflation rate began to rise. Ch. 14 27. Firm X, a leading manufacturer of rubber tires in country A, caters to almost one-third of the domestic tire market. The country was hit by a recession last year that caused the national output growth to be negative. Simon Reeds, the CEO of firm X, feels that these fluctuations in the business environment are short-lived and expects the economy to recover very soon. In spite of the recession, Simon feels that the firm can actually invest in expanding its facilities as it has sufficient cash flows to continue its operation during the crisis period. The firm’s marketing head, Sandra Jones, counters this by saying that the firm is already losing sales due the recession and they should not increase costs further by making large-scale investments in the present climate. Which of the following, if true, would support the CEO’s claim? E. The government recently announced a plan to offer incentives to buyers in the car and household appliances market. Ch. 14. 28. Firm X, a leading manufacturer of rubber tires in country A, caters to almost one-third of the domestic tire market. The country was hit by a recession last year that caused the national output growth to be negative. Simon Reeds, the CEO of firm X, feels that these fluctuations in the business environment are short-lived and expects the economy to recover very soon. In spite of the recession, Simon feels that the firm can actually invest in expanding its facilities as it has sufficient cash flows to continue its operation during the crisis period. The firm’s marketing head, Sandra Jones, counters this by saying that the firm is already losing sales due the recession and they should not increase costs further by making large-scale investments in the present climate. Which of the following, if true, would support the marketing head’s claim? A. Import barriers were reduced recently to encourage competition. Ch. 14 29. Firm X, a leading manufacturer of rubber tires in country A, caters to almost one-third of the domestic tire market. The country was hit by a recession last year that caused the national output growth to be negative. Simon Reeds, the CEO of firm X, feels that these fluctuations in the business environment are short-lived and expects the economy to recover very soon. In spite of the recession, Simon feels that the firm can actually invest in expanding its facilities as it has sufficient cash flows to continue its operation during the crisis period. The firm’s marketing head, Sandra Jones, counters this by saying that the firm is already losing sales due the recession and they should not increase costs further by making large-scale investments in the present climate. Which of the following questions is most relevant to answer in order to determine the accuracy of the CEO’s claim? D. What are consumer expectations of future growth? Chapter 15 1. Increases in government purchases will make the aggregate demand curve shift to the right. 2. A student was asked to draw an aggregate demand and aggregate supply graph to illustrate the effect of an increase in aggregate supply. The student drew the following graph: Which of the following is a correct statement about the student’s analysis? 3. The graph to the right shows the aggregate demand curve for an economy. Use the line drawing tool to show the effect of a monetary policy change that causes a decrease in interest rates. Properly label this line. A decrease in taxes would cause a similar shift in the aggregate demand curve. 4. In the diagram to the right, moving from point A to point B is called a movement along the AD curve. Moving from point A to point C is referred to as a shift in the AD curve. 5. Indicate which of the following would cause a shift in the aggregate demand curve from A to point C. 6. Consider the downward-sloping aggregate demand (AD) curve to the right. Which of the following results in a movement from point A to point B (a movement up along the AD curve) or from point A to point C (a movement down along the AD curve)? 7. Milovia is a small open economy. The general price level in the economy has been increasing at a rate of about 7.5 percent each year. Jane Wilson, an industry analyst, is of the opinion that such high inflation is adversely affecting aggregate demand in the economy and therefore its ability to grow. Her colleague, Harry Gomes, however, disagrees. According to Harry, some amount of inflation is unavoidable in a growing economy. Higher prices for products help to increase the level of corporate profits and induce firms to increase aggregate output. Which of the following, if true will indicate that higher prices will not induce firms to increase output? 8. Milovia is a small open economy. The general price level in the economy has been increasing at a rate of about 7.5 percent each year. Jane Wilson, an industry analyst, is of the opinion that such high inflation is adversely affecting aggregate demand in the economy and therefore its ability to grow. Her colleague, Harry Gomes, however, disagrees. According to Harry, some amount of inflation is unavoidable in a growing economy. Higher prices for products help to increase the level of corporate profits and induce firms to increase aggregate output. Which of the following, if true will support Harry’s view that aggregate output can increase in spite of domestic inflation? 9. Milovia is a small open economy. The general price level in the economy has been increasing at a rate of about 7.5 percent each year. Jane Wilson, an industry analyst, is of the opinion that such high inflation is adversely affecting aggregate demand in the economy and therefore its ability to grow. Her colleague, Harry Gomes, however, disagrees. According to Harry, some amount of inflation is unavoidable in a growing economy. Higher prices for products help to increase the level of corporate profits and induce firms to increase aggregate output. Jane’s argument is based on which of the following assumptions? 10. How does an increase in the price level affect the quantity of real GDP supplied in the long run? 11. The position of the long-run aggregate supply (LRAS) curve is determined by 12. An increase in the labor force or capital stock is illustrated as a shift from A to B. An increase in the expected price of an important natural resource is indicated by a shift from B to A. An improvement in technology is shown as a shift from A to B An increase in the expected future price level causes a shift from B to A. 13. Consider the figure to the right. Why does the short-run aggregate supply curve (SRAS) slope upward? All of the above 14. Neutron Inc., is one of the leading electric car manufacturers in Northbay, a developing economy. Neutron’s sales increased by more than 20 percent this year compared to the previous year, which started a debate within the company about whether the firm should increase prices. Among those in favor of a price hike is Eric Johnson, the operations head at Neutron. Eric is of the opinion that given the high demand for neutron’s cars, the firm should increase price to improve profits. Mike Wilson, the CEO of the firm, however, feels that a price increase would adversely affect the demand for Neutron’s products because he thinks consumers in this industry are more price conscious than brand loyal. Which of the following, if true, will support Eric’s view? 15. Neutron Inc., is one of the leading electric car manufacturers in Northbay, a developing economy. Neutron’s sales increased by more than 20 percent this year compared to the previous year, which started a debate within the company about whether the firm should increase prices. Among those in favor of a price hike is Eric Johnson, the operations head at Neutron. Eric is of the opinion that given the high demand for neutron’s cars, the firm should increase price to improve profits. Mike Wilson, the CEO of the firm, however, feels that a price increase would adversely affect the demand for Neutron’s products because he thinks consumers in this industry are more price conscious than brand loyal. Which of the following, if true, will weaken the case for a price increase? 16. Euphrasia, a mixed open economy, was severely affected by a recession that almost paralyzed its service sector. The Euphrasian government announced a fiscal stimulus package of $15,000 billion to boost economic growth. GDP of the economy was expected to increase by 2.5 percent during the following year after the implementation of the fiscal stimulus. However, it was observed that instead of increasing, the GDP of Euphrasia actually declined by 0.75 percent that year Which of the following, if true, will explain this outcome? 17. Suppose that initially, the economy is in long-run macroeconomic equilibrium at point A. If there is increased pessimism about the future of the economy, the AD curve will shift from AD0 to AD1 The new short-run macroeconomic equilibrium occurs at point B. Long-run adjustment will shift the SRAS curve from SRAS0 to SRAS1 as workers adjust to lower-than-expected prices. The new long-run macroeconomic equilibrium occurs at point C. 18. The graph to the right shows the aggregate demand curve, short-run aggregate supply curve, and the long-run potential output for an economy 19. Almora, a developing open economy, is experiencing an economic boom since it discovered oil reserves off its coast two years ago. Bill Hudson, an economist with the Finance Ministry of Almora, said in an interview that the oil boom has improved the average standard of living in the economy. Robin Peters is an industry analyst who does not agree with Hudson’s view. In one of his recent articles in the country’s leading business daily, Robin claimed that the high rate of inflation following the boom has actually weakened the expansionary impact on the economy. Which of the following, if true, will support Bill’s argument? 20. Almora, a developing open economy, is experiencing an economic boom since it discovered oil reserves off its coast two years ago. Bill Hudson, an economist with the Finance Ministry of Almora, said in an interview that the oil boom has improved the average standard of living in the economy. Robin Peters is an industry analyst who does not agree with Hudson’s view. In one of his recent articles in the country’s leading business daily, Robin claimed that the high rate of inflation following the boom has actually weakened the expansionary impact on the economy. Which of the following, if true, will support Robin’s argument? 21. Almora, a developing open economy, is experiencing an economic boom since it discovered oil reserves off its coast two years ago. Bill Hudson, an economist with the Finance Ministry of Almora, said in an interview that the oil boom has improved the average standard of living in the economy. Robin Peters is an industry analyst who does not agree with Hudson’s view. In one of his recent articles in the country’s leading business daily, Robin claimed that the high rate of inflation following the boom has actually weakened the expansionary impact on the economy. Which of the following statements is Bill and Robin likely to agree with? 22. Suppose that the economy grows from 2013 to 2014 without inflation. Which of the following graph correctly shows this situation? 23. Consider the information in the following table. The values for the price levels in the above table are well below 100. This information indicates that 24. “FedEx Corp’s forecast for record holiday shipping this year shows that U.S. customers are buying more things online. But retailers still anticipate a soft holiday season, with the growth in shipping volume largely expected to come from shoppers scouring the Web for cheap deals.” The information implies that the “FedEx indicator” discussed in the chapter opener 25. According to the dynamic AD-AS model, what is the most common cause of inflation? A and B only 26. Which of the following is a major difference between the AD-AS model and the dynamic AD-AS model? The dynamic AD-AS model assumes 27. Paul Schumer and Jim Miller, two analysts at a research institute, discuss the rising costs of higher education in their country. Paul feels that escalating tuition fees in colleges and universities are indicative of a bubble in the higher education market. According to Jim, however, the rising costs are the result of better quality education being provided by the institutions in recent years. Which of the following, if true, will weaken Paul’s argument? Chapter 15-A Quiz 1. Consider the figure to the right. Why does the short-run aggregate supply curve (SRAS) slope upward? 2. According to the dynamic AD-AS model, what is the most common cause of inflation? 3. In the diagram to the right, moving from point A to point B is called a movement along the AD curve. Moving from point A to C is referred to as a shift in the AD curve. 4. Suppose that initially, the economy is in long-run macroeconomic equilibrium at point A. If there is increased pessimism about the future of the economy, the AD curve will shift from AD0 to AD1. The new short-run macroeconomic equilibrium occurs at point B. Long-run adjustment will shift the SRAS curve from SRAS0 to SRAS1 as workers adjust to lower-than expected prices. The new long-run macroeconomic equilibrium occurs at point C. Chapter 15-B Quiz 1. The following graph shows aggregate demand and short-run aggregate supply. 2. A change in the price level causes a movement along the short-run aggregate supply (SRAS) curve. In the figure, this is shown by moving from point A to B. A change in any other factor causes a shift in the SRAS curve. In the figure, this is shown by moving from point B to C. 3. Consider the downward-sloping aggregate demand (AD) curve to the right. Which of the following results in a movement from point A to point B (a movement up along the AD curve) or from point A to point C (a movement down along the AD curve)? (Mark all that apply) 4. Which of the following is a major difference between the AD-AS model and the dynamic AD-AS model? The dynamic AD-AS model assumes Chapter 16 1. The U.S. dollar can best be described as 2. Which of the following is NOT a function of money? 3. When money is acting as a store of value, it allows an individual to 4. The fiscal deficit of the country Zoldova has been increasing at an alarming rate for the last decade. One of the major reasons for the worsening fiscal deficit has been indiscriminate government spending which had to be financed by printing more currency. The continuous increase in money supply to finance wasteful government expenditure cause the inflation rate to hit triple digits. With rising instability in the country, the central bank had to redenominate its currency earlier this year. As a result, currency worth 10,000 Zoldovan dollars last year are now worth only 100 Zoldovan dollars. 5. Credit cards are 6. M1 includes more than just currency because The amount of U.S. currency outstanding averages to about $2,800 per person in the U.S. This large amount of currency per person can be partially explained because 7. The M2 definition of the money supply includes . 8. The formula for the simple deposit multiplier is? 9. Suppose the reserve requirement is 5%. What is the effect on total checkable deposits in the economy if bank reserves increase by $40 billion? 10. An initial decrease in a bank’s reserves will decrease checkable deposits 11. Suppose banks keep no excess reserves and that all banks are currently meeting the reserve requirement. The Federal Reserve then makes an open market purchase of $13,000 from Bank1. Use the T-account to show the result of this transaction for Bank 1. Assuming Bank1 keeps no excess reserves after the transaction. 12. Hermesia, a developing economy, has been experiencing low growth in output with a high rate of unemployment for more than a year. Two members of the National Trade Union in Hermesia, Geoffrey Miller and Arthur Davis, are discussing the relevant expansionary policies that can be taken by the central bank or the government to stimulate economic growth in Hermesia. Geoffrey suggests that the central bank should substantially lower the reserve requirements of the commercial banks so that money supply and household spending both increase. Arthur, however disagrees. According to him, a decrease in the reserve requirements will not have the desired impact on money supply. He believes that an increase in government spending is more likely to boost the economy than an expansionary monetary policy. Which of the following, if true, will weaken Arthur’s claim that a decrease in the reserve requirements will not substantially increase money supply? 13. In a fractional reserve banking system, what is the difference between a “bank run” and a “bank panic”? 14. The United States is divided into 12 Federal Reserve Districts. The Federal Reserve Bank’s Board of Governors consists of 7 members appointed by the president of the U.S. to 14-year, non-renewable terms. One of the board members is appointed to a 4 year, renewable term as the chairman. 15. The Federal Reserve is divided into two bodies: Which of the following is not a Federal Reserve district? 16. Which of the following is a monetary policy tool used by the Federal Reserve Bank? 17. Which of the following policy tools is the Federal Reserve least likely to use in order to actively change the money supply? Reserve Requirements are changed so infrequently because 18. In addition to the Federal Reserve Bank, what other economic actors influence the money supply? 19. In the last few years investments in green technology has increased substantially in Daslow, a developed economy. With an increased flow of credit to this sector, the stock prices of some of the leading green technology firms went up by 75 percent or more in the current fiscal year. A group of economists in Daslow claims that such a sharp increase in stock prices are an indication of a bubble. Since bubbles are unsustainable, this could hurt the economy in the near future. However, a group of industry analysts disagrees. They feel that with rising concern for the environment, the green technology industry is only likely to grow faster. Which of the following, if true, will support the economists’ claim? 20. In the last few years investments in green technology has increased substantially in Daslow, a developed economy. With an increased flow of credit to this sector, the stock prices of some of the leading green technology firms went up by 75 percent or more in the current fiscal year. A group of economists in Daslow claims that such a sharp increase in stock prices are an indication of a bubble. Since bubbles are unsustainable, this could hurt the economy in the near future. However, a group of industry analysts disagrees. They feel that with rising concern for the environment, the green technology industry is only likely to grow faster. Since the sector has been growing due to an increase in demand, it is unlikely that there is a bubble. 21. In the last few years investments in green technology has increased substantially in Daslow, a developed economy. With an increased flow of credit to this sector, the stock prices of some of the leading green technology firms went up by 75 percent or more in the current fiscal year. A group of economists in Daslow claims that such a sharp increase in stock prices are an indication of a bubble. Since bubbles are unsustainable, this could hurt the economy in the near future. However, a group of industry analysts disagrees. They feel that with rising concern for the environment, the green technology industry is only likely to grow faster. Which of the following questions would be most important to answer in order to determine whether the economists’ claim is accurate? 22. If the money supply is growing at a rate of 6 percent per year, real GDP (real output) is growing at a rate of 4 percent per year, and velocity is constant, what will the inflation rate be? 2% (enter your response as an integer) If the money supply is growing at a rate of 6 percent per year, real GDP (real output) is growing at a rate of 4 percent per year, and velocity is growing at 3 percent per year instead of remaining constant, what will the inflation rate be? 5% (enter your response as an integer) 23. Which of the following is true with respect to hyperinflation? 24. According to the quantity theory of money, inflation results from which of the following The money supply grows faster than real GDP. Chapter 16-A Quiz 1. According to the quantity theory of money, inflation results from which of the following? The money supply grows faster than real GDP 2. The use of money 3. Which of the following is a monetary policy tool used by the Federal Reserve Bank? 4. The M2 definition of the money supply includes 5. Evaluate the following statement: Banks use deposits to make consumer loans to households and commercial loans to businesses. Banks will loan out every penny of their deposits in order to make a profit. Chapter 16-B Quiz 1. Credit cards are 2. Which of the following is NOT a function of money? 3. Which of the following is true with respect to hyperinflation? 4. An initial increase in a bank’s reserves will increase checkable deposits 5. In addition to the Federal Reserve Bank, what other economic actors influence the money supply? Chapter 17 1. When congress established the Federal Reserve in 1913, its main responsibility was Congress broadened the Fed’s responsibility since 2. How can investment banks be subject to liquidity problems? Investment banks can be subject to liquidity problems because 3. Why is price stability one of the Fed’s monetary policy goals? Which of the following is not a problem of high inflation rates? 4. One of the goals of the Federal Reserve is price stability. For the Fed to achieve this goal, 5. The economy of country Rumblen was hit by a banking crisis, which has led to a recession. Jason Wallace, a real estate agent, says that the economy will recover soon because the government is taking various measures to counter the recession. According to him, the flow of credit will soon return to pre-crises levels. His wife Anna Wallace disagrees with him. She says that the situation may not improve soon, given the substantial increase in unemployment, Which of the following, if true, will weaken Anna’s claim that the situation is not likely to improve in the short term? 6. If the Federal Reserve purchases $150 million worth of U.S. treasury bills from the public, the money supply will increase. 7. The federal funds rate 8. In the figure to the right, the opportunity cost of holding money decreases when moving from point A to point B on the money demand curve. 9. Inflation in the developing country of Terbia has been rising over the last few years and is currently at a very high level. Two stock market analysts, Stanley Durro and Michelle Thompson, are discussing the possible causes of inflation. Michelle thinks that the real reason why prices are rising is because Terbia’s economy is expanding. Stanley disagrees. He argues that the inflation is not demand driven; o the contrary, too much money in the economy is increasing the price level. Which of the following, if true, would weaken Stanley’s claim that the inflation is driven by an excess supply of money? 10. The Fed uses monetary policy to offset the effects of a recession (high unemployment and falling prices when actual real GDP falls short of potential GDP) and the effects of a rapid expansion (high prices and wages) Can the Fed, therefore, eliminate recessions? The Fed can only soften the magnitude of recession, not eliminate them. 11. In the figure to the right, the economy experiences inflation in the second period. What would be the Fed’s reaction if actual real GDP occurs at point B and potential GDP occurs at LRAS2? 12. An increase in the money supply in the U.S. will not Cause the value of investing in U.S. financial assets to become more desirable to foreign investors. 13. Changes in interest rates affect aggregate demand. Which of the following is affected by changes in interest rates and, as a result, impacts aggregate demand? 14. Consider the figures below and determine which is the best description of what causes the shift from AD1 to AD2. 15. The figure to the right illustrates the economy using the Dynamic Aggregate Demand and Aggregate Supply Model. If actual real GDP in 2006 occurs at point B and potential GDP occurs at LRAS06, we would expect the Federal Reserve Bank to pursue a contractionary monetary policy. If the Fed’s policy is successful, what is the effect on the following macroeconomic indicators? Actual GDP decreases Potential real GDP does not change Price level decreases Unemployment increases 16. The figure to the right illustrates the economy using the Dynamic Aggregate Demand and Aggregate Supply Model. What would be the Fed’s reaction if actual GDP in 2006 occurs at point B and potential GDP occurs at LRAS06? That is, what step will the Fed likely take to control inflation in the second period? An open market sale of government securities. 17. The figure to the right illustrates a dynamic AD-AS model. Suppose the economy is in equilibrium in the first period at point A. In the second period, the economy reaches point B. What policy would the Fed likely pursue in order to move AD2 to AD2, policy and reach equilibrium (point C) in the second period? 18. Wendy Hendricks is a financial reporter for a news channel in Trussia, a large landlocked country. According to her, the economy is running the risk of deflation because prices in some sectors like computers and consumer goods have actually been falling in the past three years. As the economy is showing signs of slowing down, she feels that the central bank should adopt an expansionary monetary policy. Which of the following, if true, would weaken Wendy’s claim that the economy is slowing down? 19. Suppose that the equilibrium real federal funds rate is 6 percent and the target rate of inflation is 1 percent. Use the following information and the Taylor Rule to calculate the federal funds rate 20. Glenn Rudebusch, an economist at the Federal Reserve Bank of San Francisco, argues that if the Fed had followed the Taylor Rule during the recession of 2007 – 2009, then by the end of 2009 the target for the federal funds rate would have been – 5 percent. 21. Nobel laureate Milton Friedman and his followers belong to a school of thought known as monetarism. What do the monetarists argue the Fed should target? 22. The central bank of the country Oakville is hosting its annual economic policy symposium with monetary policy as the theme. Several bankers and professional economists are in attendance. Dorah Baker, a professor at the University of Oakville, is of the opinion that monetary policy should target the rate of growth of money supply. This, she claims, would increase economic stability. Jack Snyder, a delegate attending the conference, does not agree. He thinks that monetary policy is highly effective in controlling inflation and so the central bank should bring inflation down from the current level of four percent to as close to zero as possible. Which of the following, if tru, would weaken Dorah’s claim that monetary policy should target the rate of growth of money supply? 23. Suppose you buy a house for $150,000. One year later, the market price of the house has risen to $160,000. If you made a down payment of 25 percent and took out a mortgage loan for the other 75 percent, the return on your investment in the house is 27% If you made a down payment of 15 percent and borrowed the other 85 percent, the return on your investment in the house is 44% 24. The introduction of Fannie Mae and Freddie Mac into the mortgage-backed securities market by the government 25. How do investment banks differ from commercial banks? 26. Why did the Fed help JP Morgan Chase buy Bear Stearns? 27. Economic growth in the country of Southville has slowed down in the last few months. Following a collapse in housing prices, several homeowners have defaulted on their mortgages. Given that this sector accounts for a sizable portion of the GDP, many commentators believe that this will prompt a domino effect in the economy. On a TV chat show, three industry experts are discussing the crisis and its possible impacts. Megan Greenboe is of the opinion that housing prices were driven up by speculation prior to crisis. According to her, this crisis will eventually reduce liquidity in the economy and lead to a credit crunch. Bob Sacberg, however, does not agree with Megan. Bob were therefore driven by fundamentals. Samantha Morris meanwhile is not very convinced that the housing sector is solely responsible for the economic slowdown. She argues that a twelve percent fall in housing prices in unlikely to have a very widespread impact. Which of the following, if true, will weaken Bob’s argument that fundamental factors in the housing market led to thin increase in housing prices? 28. Economic growth in the country of Southville has slowed down in the last few months. Following a collapse in housing prices, several homeowners have defaulted on their mortgages. Given that this sector accounts for a sizable portion of the GDP, many commentators believe that this will prompt a domino effect in the economy. On a TV chat show, three industry experts are discussing the crisis and its possible impacts. Megan Greenboe is of the opinion that housing prices were driven up by speculation prior to crisis. According to her, this crisis will eventually reduce liquidity in the economy and lead to a credit crunch. Bob Sacberg, however, does not agree with Megan. Bob were therefore driven by fundamentals. Samantha Morris meanwhile is not very convinced that the housing sector is solely responsible for the economic slowdown. She argues that a twelve percent fall in housing prices in unlikely to have a very widespread impact. Which of the following, if true, will weaken Megan’s argument that the economy is moving toward a credit crunch? 29. Economic growth in the country of Southville has slowed down in the last few months. Following a collapse in housing prices, several homeowners have defaulted on their mortgages. Given that this sector accounts for a sizable portion of the GDP, many commentators believe that this will prompt a domino effect in the economy. On a TV chat show, three industry experts are discussing the crisis and its possible impacts. Megan Greenboe is of the opinion that housing prices were driven up by speculation prior to crisis. According to her, this crisis will eventually reduce liquidity in the economy and lead to a credit crunch. Bob Sacberg, however, does not agree with Megan. Bob were therefore driven by fundamentals. Samantha Morris meanwhile is not very convinced that the housing sector is solely responsible for the economic slowdown. She argues that a twelve percent fall in housing prices in unlikely to have a very widespread impact. Which of the following, if true, will weaken Samantha’s argument that the fall in housing prices are unlikely to have widespread impact on the economy? Chapter 17-A Quiz 1. Changes in interest rates affect aggregate demand. Which of the following is affected by changes in interest rates and, as a result, impacts aggregate demand? 2. What are the Fed’s main monetary policy targets? The money supply and interest rates. 3. What is inflation targeting? Committing the central bank to achieve an announced level of inflation. 4. The Fed uses monetary policy to offset the effects of a recession (high unemployment and falling prices when actual real GDP falls short of potential GDP) and the effects of a rapid expansion (high prices and wages). Can the Fed, therefore, eliminate recessions? The Fed can only soften the magnitude of recessions, not eliminate them. 5. Which of the following is NOT a monetary policy goal of the Federal Reserve Bank (the Fed). Low prices. 6. The figure to the right illustrates a dynamic AD-AS model. Suppose the economy is in equilibrium in the first period at point A. In the second period, the economy reaches point B. What policy would the Fed likely pursue in order to move AD2 to AD2, policy and reach equilibrium (point C) in the second period? Open market purchase of government securities. 7. What two institutions did Congress create in order to increase the availability of mortgages in a secondary market? “Fannie Mae” and “Freddie Mac” 8. The figure to the right illustrates the economy using the Dynamic Aggregate Demand and Aggregate Supply Model. What would be the Fed’s reaction if actual real GDP in 2006 occurs at point B and potential GDP occurs at LRAS06? That is, what step will the Fed likely take to control inflation in the second period? An open market sale of government securities. 9. In the figure to the right, the opportunity cost of holding money decreases when moving from Point A to Point B on the money demand curve. Chapter 17-B Quiz 1. In the figure to the right, when the money supply increased from MS1 to MS2, the equilibrium interest rate fell from 4% to 3%. Why? 2. In the figure to the right, the economy experiences inflation in the second period. What would be the Fed’s reaction if actual real GDP occurs at point B and potential GDP occurs at LRAS2? 3. How do investment banks differ from commercial banks? 4. The figure to the right illustrates the economy using the Dynamic Aggregate Demand and Aggregate Supply Model. If actual real GDP in 2006 occurs at point B and potential GDP occurs at LRAS06, we would expect the Federal Reserve Bank to pursue a contractionary monetary policy. If the Fed’s policy is successful, what is the effect of the policy on the following macroeconomic indicators? Actual real GDP decreases Potential real GDP does not change Price level decreases Unemployment increases 5. Suppose the economy is in equilibrium in the first period at point A. In the second period, the economy reaches point B. What policy would the Fed likely pursue in order to move AD2 to AD2, policy and reach equilibrium (point C) in the second period? (What policy will increase the price level and increase actual real GDP?) Open market purchase of government securities 6. As the figure to the right indicates, the Fed can affect both the money supply and interest rates. However, in recent years, the Fed targets interest rates in monetary policy more often than it does the money supply. Which interest rate does the Fed target? The federal funds rate 7. The Fed changes the discount rate as a part of its policy to reach all of the following objectives except: High unemployment 8. Consider the figure to the right. Can the Fed achieve a $900 billion supply (MS) AND a 5% interest rate (point C)? No. The Fed cannot target both the money supply and the interest rate simultaneously. 9. The figure to the right illustrates a dynamic AD-AS model. Suppose the economy is in equilibrium in the first period at point A. In the second period, the economy reaches point B. We would expect the Fed to pursue what type of policy in order to move AD2 to AD2, policy and reach equilibrium (point C) in the second period? Expansionary monetary policy If the Federal Reserve Bank’s policy is successful, what is the effect on the following macroeconomic indicators? Actual real GDP: increases Potential real GDP: does not change Price level: increases Unemployment: decrease Chapter 18 1. Some spending and taxes increase or decrease with the business cycle. This event has an effect on the economy that is similar to fiscal policy and is called Automatic Stabilizers. 2. After September 11, 2001, the federal government increased military spending on wars in Iraq and Afghanistan. Is this increase in spending considered fiscal policy? No. The increase in defense spending after that date was designed to achieve homeland security objectives. 3. Government spending and taxes that increase or decrease without any actions taken by the government are referred to as Automatic Stabilizers. Which of the following are examples of discretionary fiscal policy? (Check all that apply) 4. What is the difference between federal government purchases (spending) and federal government expenditures? Government purchases are included in government expenditures. 5. Complete the following table for a static AD-AS model: 6. Which of the following is an example of an expansionary fiscal policy? A decrease in taxes. 7. Consider the figures below. Determine which combination of fiscal policies shifted AD1 to AD2 in each figure and returned the economy to long-run macroeconomic equilibrium. 8. Consider the figures to the right. Which of the following combinations of specific fiscal policy will return the economy to long-run macroeconomics equilibrium (point C)? That is, what policy will move aggregate demand from AD2 to AD2 (policy) in the second period? 9. Westville, a small developed country, is experiencing a very high rate of inflation. Roma Anderson, a market research analyst, thinks that the high level of inflation is due to an acute shortage of goods available in the economy. According to her, the government should use expansionary fiscal policies to boost the economy. Meanwhile, Robert Simpson, a member of the finance ministry, is of the opinion that the high level of inflation is the result of excessive household spending. He suggests that the government should increase personal income tax rates to curb consumption demand. The government did increase personal income tax rates to reduce inflation. However, inflation did not decline as expected. Which of the following, if true, will explain this outcome? 10. The figure to the right illustrates the economy using the Dynamic Aggregate Demand and Aggregate Supply Model. If actual real GDP in 2006 occurs at point B and potential GDP occurs at LRAS06, we would expect the federal government to pursue a(n) contractionary fiscal policy. If the government’s policy is successful, what is the effect of the policy on the following macroeconomic indicators? Actual real GDP decreases. Potential real GDP does no change. Price level decreases. Unemployment increases. 11. The figure to the right illustrates the economy using the Dynamic Aggregate Demand and Aggregate Supply Model. What would be the federal government’s reaction if actual real GDP in 2006 occurs a point B and potential GDP occurs at LRAS06? That is, what step can we expect the federal government to take to control inflation in the second period? 12. The figure to the right illustrates the dynamic AD-AS model. Suppose the economy is in equilibrium in the first period at point (A). In the second period, the economy reaches point (B). We would expect the federal government to pursue what type of policy in order to move AD2 to AD2 (policy) and reach equilibrium (point C) in the second period? If the federal government’s policy is successful, what is the effect on the following macroeconomic indicator? Actual real GDP: increases Potential real GDP: does not change Price level: increases Unemployment: decreases 13. The figure to the right illustrates the dynamic AD-AS model. Suppose the economy is in equilibrium in the first period at point (A). In the second period, the economy reaches point (B). What policy would the federal government likely pursue in order to move AD2 to AD2 (policy) and reach equilibrium (point C) in the second period? Increase government spending 14. Two years back, the Republic of Terbia, a developed economy, experienced a massive boom in the information technology (IT) industry. The rapid expansion of credit to the firms in the industry resulted in a significant increase in employment and prices in the economy. However, due to overvaluation and speculation in the market, stock prices of these firms fell sharply. IT being one of the most important sectors, this downward affected the economy adversely, leading to a recession. Alicia White, an industry expert, suggests that expansionary monetary policy by the central bank is necessary to induce greater spending in the economy. However, Jaime Russell, a teacher at the community college, disagrees. According to him, increasing the supply of money would not help. The only possible impact of a fall in the interest rate would be an increase in aggregate supply. This, in turn, will reduce prices and profits further. Instead, the government should use expansionary fiscal policies to boost aggregate demand. Which of the following, if true, will weaken Alicia’s view? 15. One-time tax rebates, such as those in 2001 and 2008, increase consumption spending by less than a permanent tax cut because one-time tax rebates increase Current income 16. According to the multiplier effect, an initial decrease in government purchases decreases real GDP by more than the initial decrease in government purchases. 17. The multiplier effect is only a consideration for increases in government purchases. False 18. The higher the tax rate, the smaller the multiplier effect. 19. The recession accompanied by a financial crisis are more sever than recessions that do not involve bank crisis because The large budget deficits of $1.4 trillion in fiscal year 2009 and $1.3 trillion in fiscal year 2010 were 20. Suppose that at the same time Congress and the President pursue an expansionary fiscal policy, the Federal Reserve pursues an expansionary monetary policy. 21. If the government increases expenditure without rising taxes, this will 22. In the long run, increases in government purchases result in Complete crowding out 23. Does government spending ever reduce private spending Yes, due to crowding out. 24. The federal government’s budget surplus was $189.4 billion in 2000 and $41.8 billion in 2001. A decrease in the federal government’s budget surplus can be the result of 25. How does a budget deficit act as an automatic stabilizer and reduce the severity of a recession? 26. Increased government debt can lead to higher interest rates and, as a result, crowding out of private investment spending. In terms of borrowing (debt-spending), what will offset the effect of crowding out in the long run so that government debt poses less of a problem to the economy? 27. When is it considered “good policy” for the government to run a budget deficit? 28. The budget deficit of the government of Lyria, an open economy, has persistently remained higher than 6 percent of GDP. Murphy Smith, a banker, feels that a high budget deficit is detrimental to economic growth. In his opinion, there should be a law that makes it mandatory for the government to balance the budget. Dorina Shaw, a business analyst, however, disagrees. According to her, this budget deficit by itself need not be a problem. Governments usually run fiscal deficits even when their economies are at full employment. Which of the following, if true, would suggest that making it mandatory for the Lyrian government to balance its budget will benefit the economy? 29. In the long run, government tax policy can affect private investment which impacts the production function and factors of production. In other words, aggregate supply may be impacted by different types of taxes the government can use. Which of the following is not true in terms of potential long run impacts of tax policies? 30. Policy that is basically designed to affect aggregate supply and increase incentives to work, save, and start a business, by reducing the tax wedge is called Chapter 18-A Quiz 1. After September 11, 2001, the federal government increased military spending on wars in Iraq and Afghanistan. Is this increase in spending considered fiscal policy? No. The increase in defense spending after that date was designed to achieve homeland security objectives. 2. In the long-run, increases in government purchases result in Complete crowding out. 3. Complete the following table for a static AD-AS model: 4. The figure to the right illustrates the economy using the Dynamic Aggregate Demand and Aggregate Supply Model. What would be the federal government’s reaction if actual real GDP in 2006 occurs a point B and potential GDP occurs at LRAS06? That is, what step can we expect the federal government to take to control inflation in the second period? 5. According to the multiplier effect, an initial decrease in government purchases decreases real GDP by more than the initial decrease in government purchases. 6. Each year that the federal government runs deficit, the federal debt grows. Each year that the federal government runs a surplus, the federal debt shrinks. 7. Policy that is basically designed to affect aggregate supply and increase incentives to work, save, and start a business, by reducing the tax wedge is called Supply-side economics. 8. One-time tax rebates, such as those in 2001 and 2008, increase consumption spending by less than a permanent tax cut because one-time tax rebates increase Current income Chapter 18-B Quiz 1. The figure to the right illustrates the dynamic AD-AS model. Suppose the economy is in equilibrium in the first period at point (A). In the second period, the economy reaches point (B). We would expect the federal government to pursue what type of policy in order to move AD2 to AD2 (policy) and reach equilibrium (point C) in the second period? Expansionary fiscal policy If the federal government’s policy is successful, what is the effect on the following macroeconomic indicator? Actual real GDP: increases Potential real GDP: does not change Price level: increases Unemployment: decreases 2. What is the difference between federal government purchases (spending) and federal government expenditures? Government purchases are included in government expenditures. 3. What are the gains to be had from simplifying the tax code? 4. When is it considered “good policy” for the government to run a budget deficit? When borrowing is used for long-lived capital goods. 5. Consider the figures below. Determine which combination of fiscal policies shifted AD1 to AD2 in each figure and returned the economy to long-run macroeconomic equilibrium. 6. The higher the tax rate, the smaller the multiplier effect. 7. The multiplier effect is only a consideration for increases on government purchases. False 8. Does government spending over reduce private spending? Yes, due to crowding out. [Show More]
Last updated: 1 year ago
Preview 1 out of 108 pages
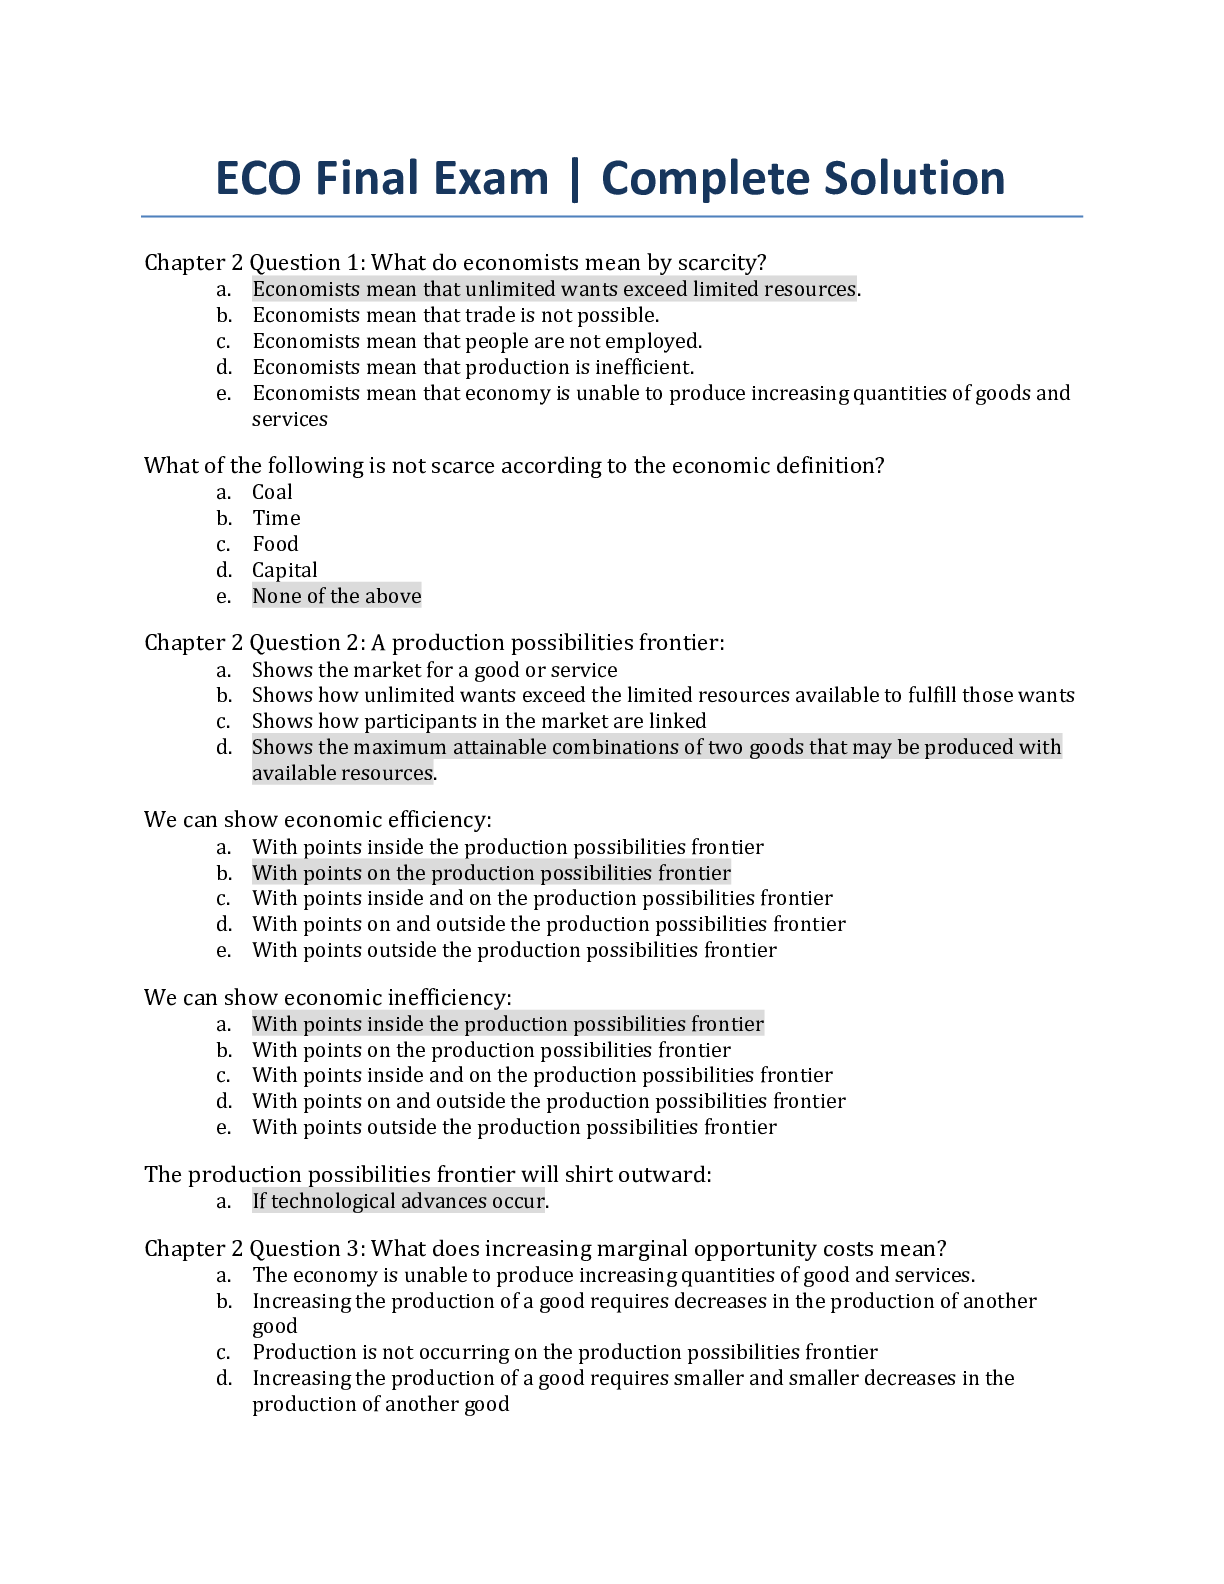
Reviews( 0 )
Recommended For You
Philosophy> QUESTIONS & ANSWERS > PHI 208 Week 5 Final Exam | Complete Solutions (Explained) Ashford University (All)

PHI 208 Week 5 Final Exam | Complete Solutions (Explained) Ashford University
Chamberlain PHI 208 Week 5 Final Exam 1. Question : In the video, “Drones Are Ethical and Effective,” Kenneth Anderson argues that the use of drones is ethical because it provides a greate...
By Expert#1 , Uploaded: May 25, 2020
$14
Philosophy> QUESTIONS & ANSWERS > PHIL 347N Final Exam | Complete Solution (New) - Graded A+ (All)

PHIL 347N Final Exam | Complete Solution (New) - Graded A+
Question 1.1. (TCOs 1, 2) Determine whether the following passage is an argument. Mark is the newest member of the requisitions department. The requisitions department oversees the purchasing of a...
By Nutmegs , Uploaded: Apr 02, 2022
$14
Calculus> QUESTIONS & ANSWERS > Practice Final Exam Solutions - Accelerated Multivariable Calculus Harvard University - MATH 2413Practice_final_exam_solution. ALL ANSWERS CORRECT (All)

Practice Final Exam Solutions - Accelerated Multivariable Calculus Harvard University - MATH 2413Practice_final_exam_solution. ALL ANSWERS CORRECT
Practice Final Exam Solutions - Accelerated Multivariable Calculus 1. Determine whether the following are TRUE or FALSE, and write your answer into the box. a) If ~a ×~b = ~0, then either one (or bo...
By Muchiri , Uploaded: Mar 23, 2021
$7
*NURSING> QUESTIONS & ANSWERS > NCSBN TEST BANK for the NCLEX-RN & NCLEX-PN. Contains More than 2000 Q&A Plus Review and Rationale in 517 PAGES. (All)

NCSBN TEST BANK for the NCLEX-RN & NCLEX-PN. Contains More than 2000 Q&A Plus Review and Rationale in 517 PAGES.
NCSBN TEST BANK -for the NCLEX-RN & NCLEX-PN. Updated 2022/2023. Contains More than 2000 Q&A Plus Review and Rationale in 517 PAGES. (All Testable Questions for NCLEX-RN & NCLEX-PN)
By Expert1 , Uploaded: Jul 28, 2020
$20
Business> QUESTIONS & ANSWERS > CLM 031 EXAM (All)
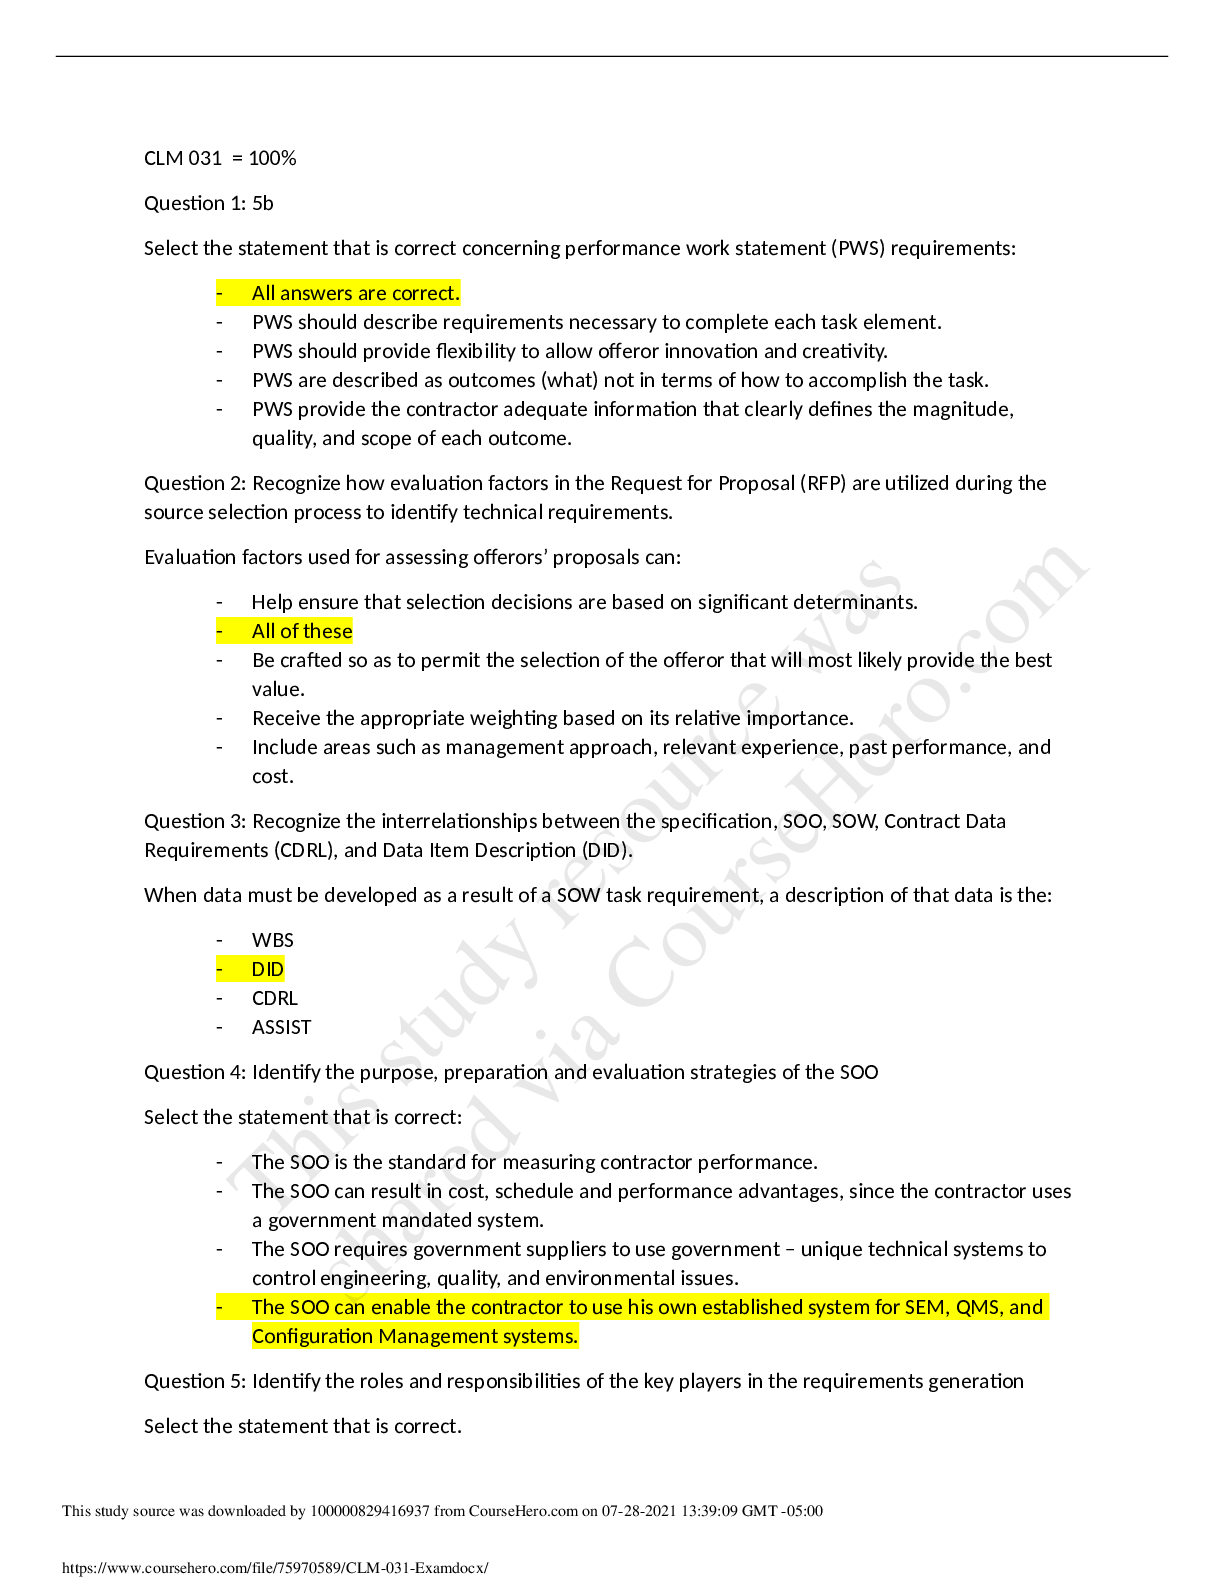
CLM 031 EXAM
CLM 031 = 100% Question 1: 5b Select the statement that is correct concerning performance work statement (PWS) requirements: - All answers are correct. - PWS should describe requirements necessary...
By Book Worm, Certified , Uploaded: Nov 03, 2022
$5
*NURSING> QUESTIONS & ANSWERS > PHIL 347 Week 6 Checkpoint Quiz. Score 100/100 (All)

PHIL 347 Week 6 Checkpoint Quiz. Score 100/100
Question: What are the three fundamental reasoning strategies listed in the text? Question: What is comparative reasoning? On what skill is it based? Question: We learned four tests for evaluating...
By Amanda Rosales , Uploaded: Mar 24, 2021
$7
Business> QUESTIONS & ANSWERS > BUSINESS 1007 (All)
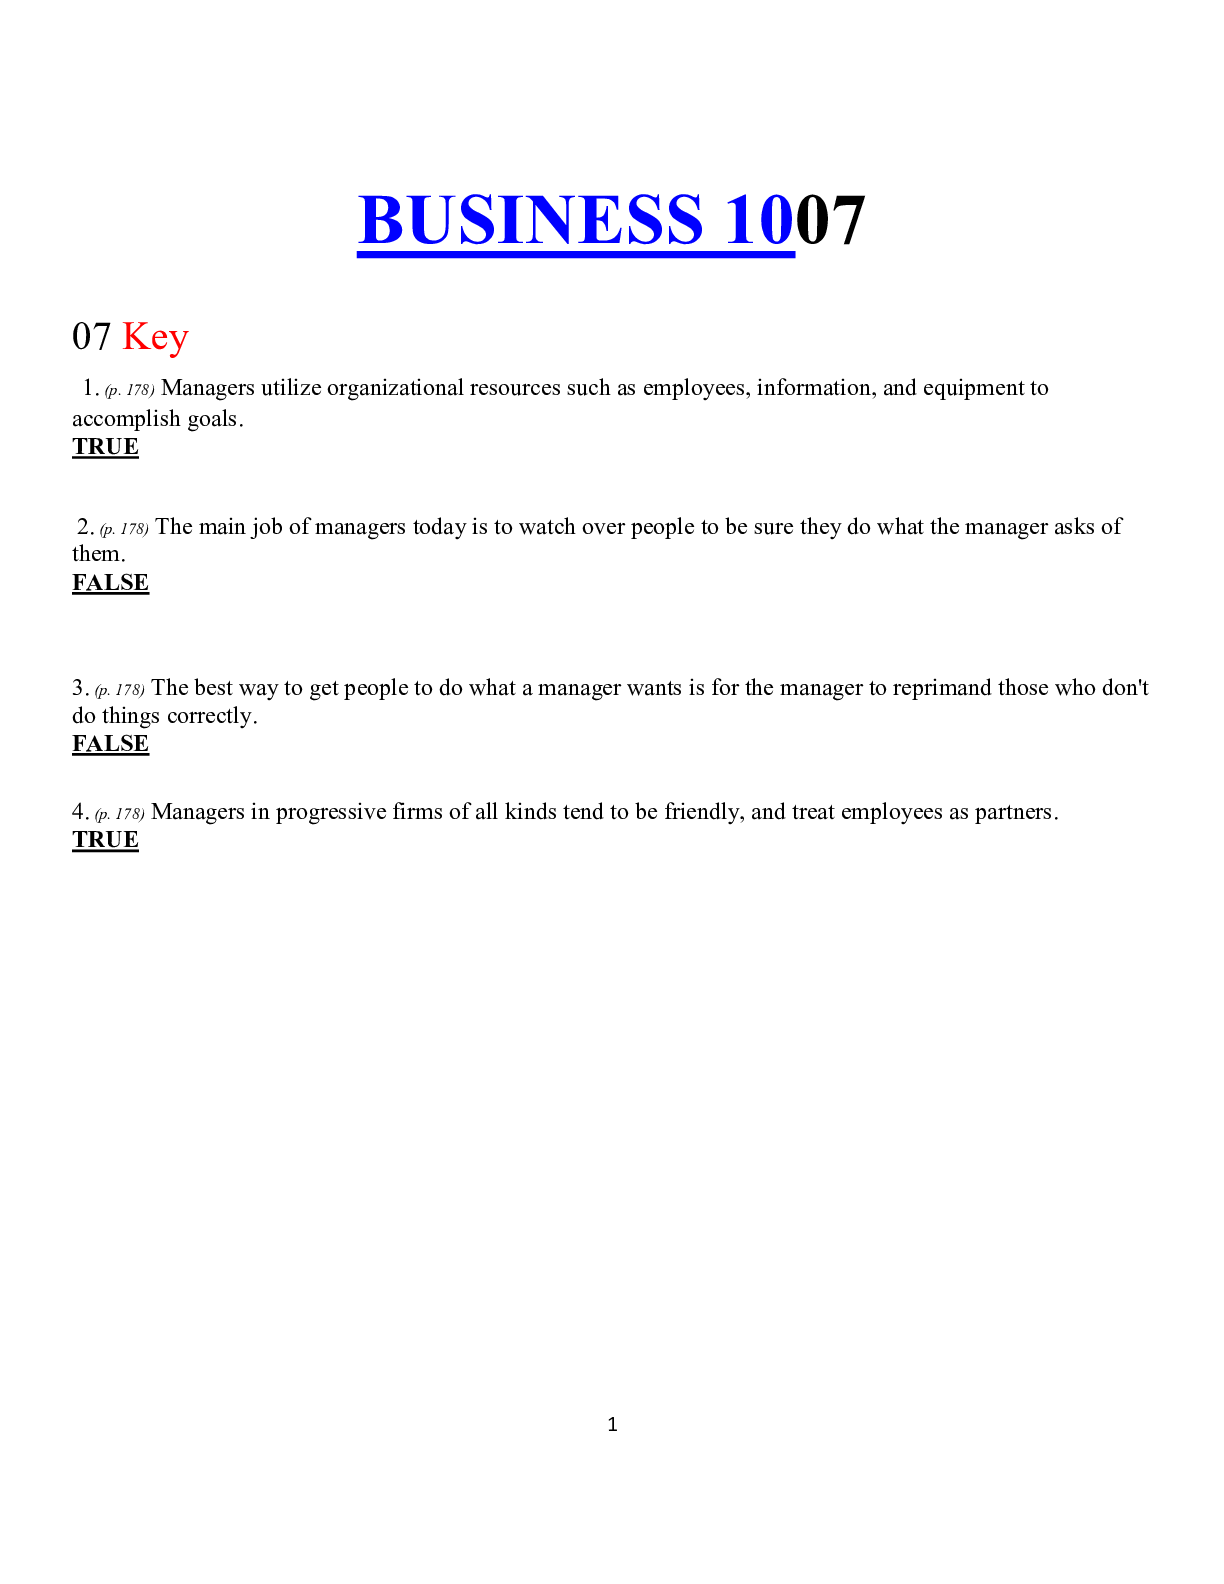
BUSINESS 1007
BUSINESS 1007 07 Key 1. (p. 178) Managers utilize organizational resources such as employees, information, and equipment to accomplish goals. 2. (p. 178) The main job of managers today is to w...
By Kirsch , Uploaded: Oct 19, 2019
$6
Anthropology> QUESTIONS & ANSWERS > KOR 352 FA19 101 week 8 Quiz. Already Graded A (All)
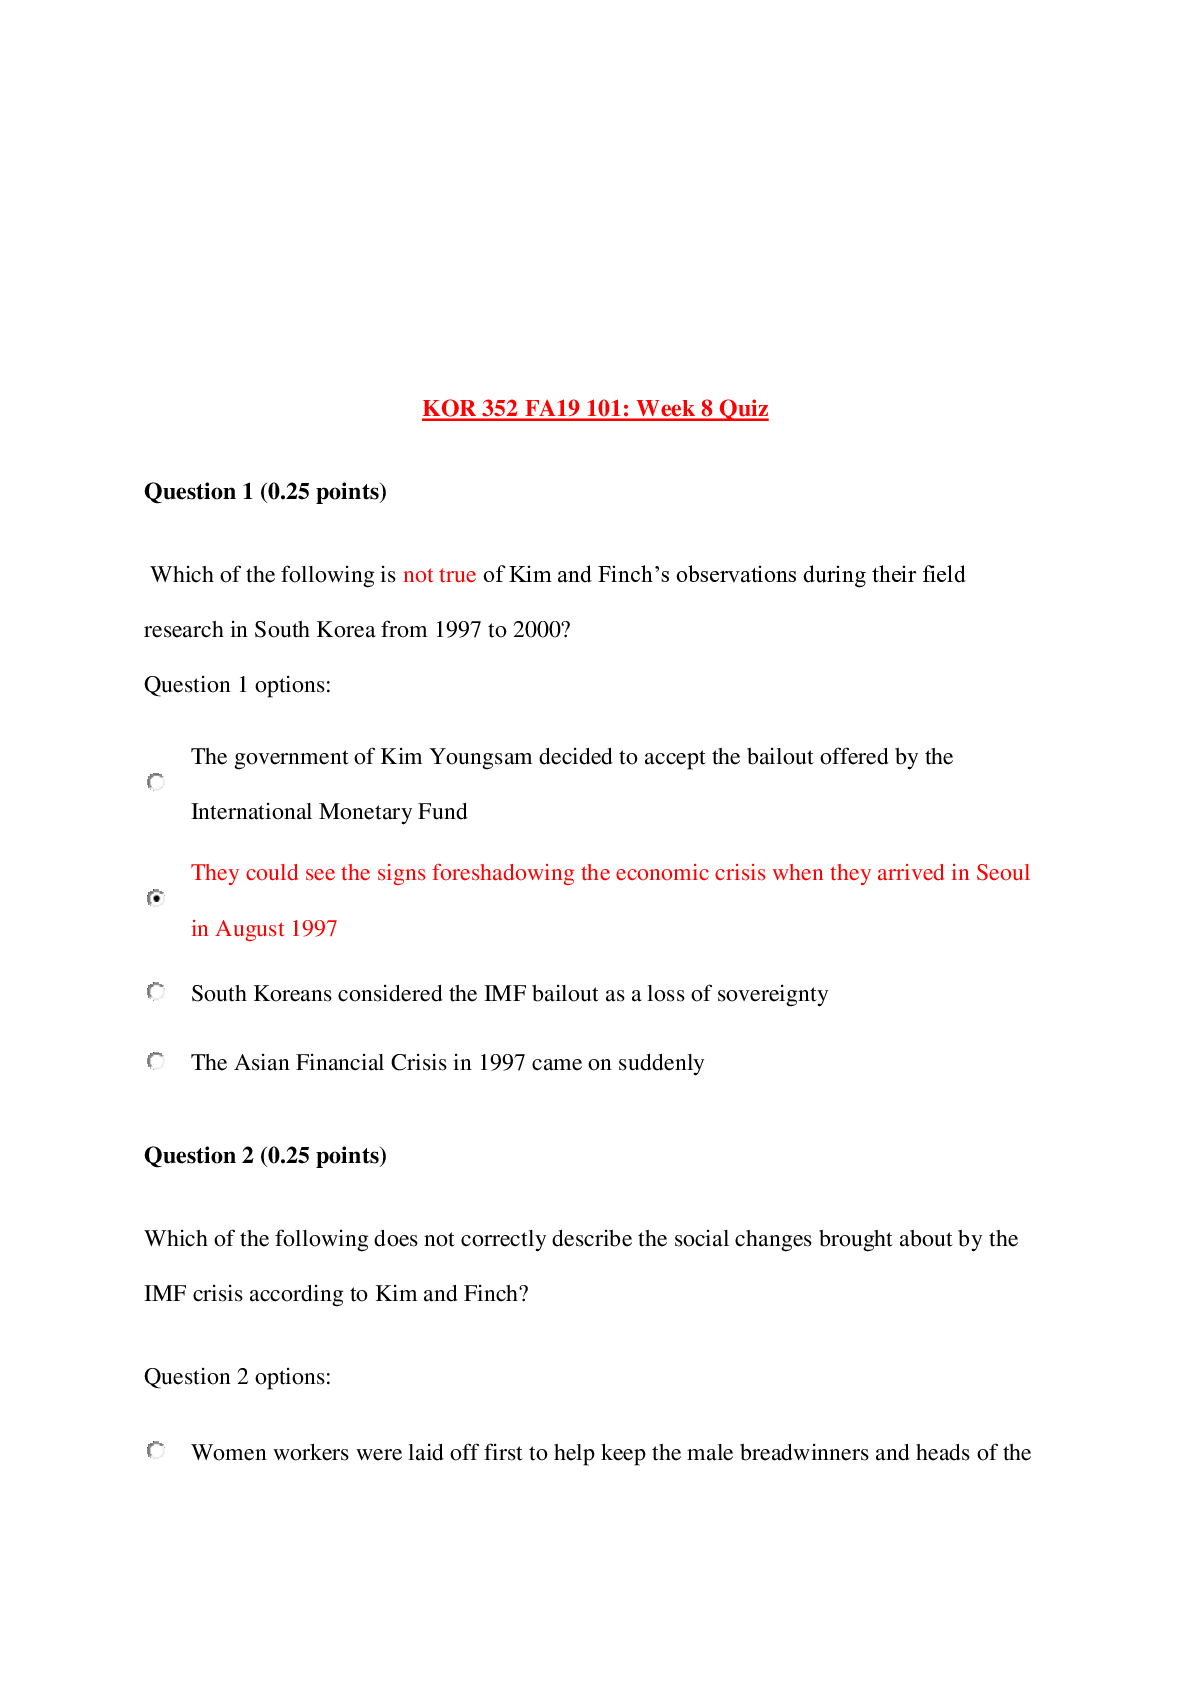
KOR 352 FA19 101 week 8 Quiz. Already Graded A
KOR 352 FA19 101: Week 8 Quiz Question 1 (0.25 points) Which of the following is not true of Kim and Finch’s observations during their field research in South Korea from 1997 to 2000? Question 1 o...
By Kirsch , Uploaded: Oct 17, 2019
$9
E-Commerce> QUESTIONS & ANSWERS > ESOC 316 Digital Commerce - University Of Arizona. Midterm Quiz. 20 Q&A. 100% Score (All)
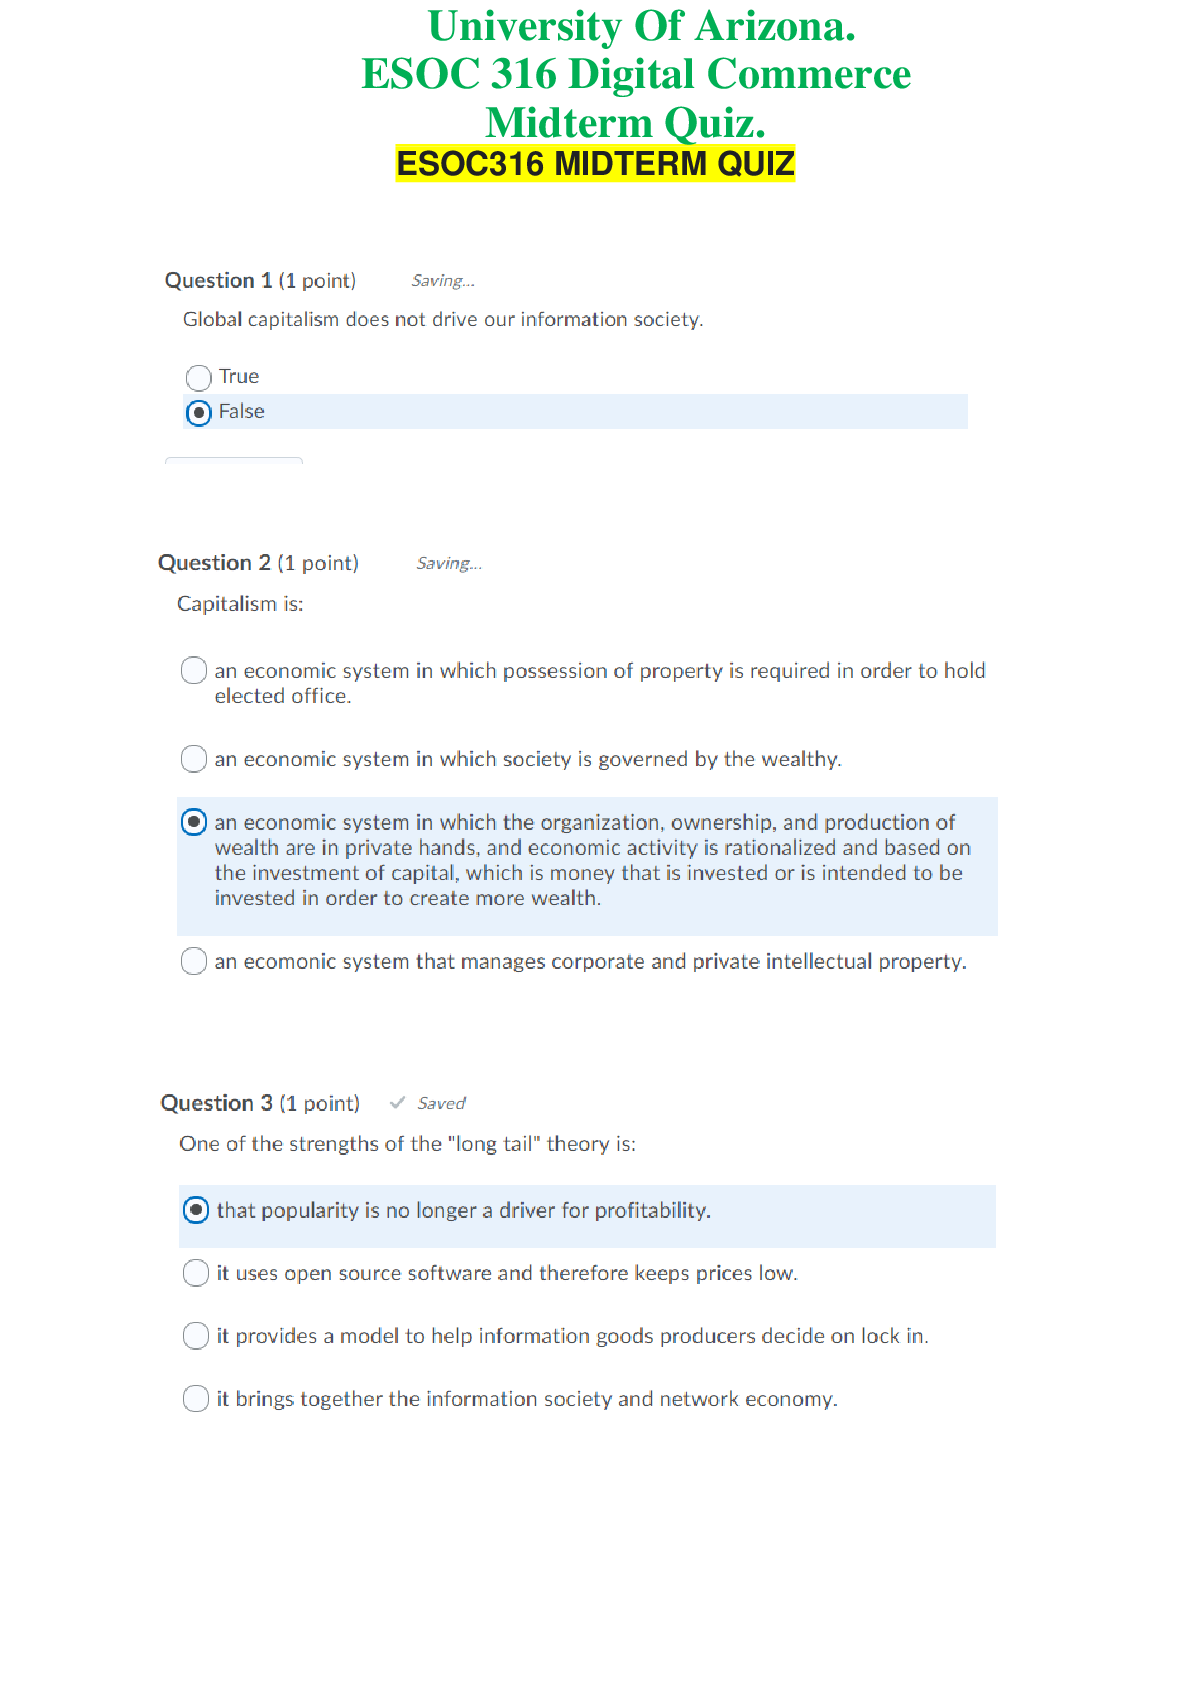
ESOC 316 Digital Commerce - University Of Arizona. Midterm Quiz. 20 Q&A. 100% Score
ESOC 316 Digital Commerce - University Of Arizona. Midterm Quiz. 20 Q&A. 100% Score ESOC316 MIDTERM QUIZQuestion 6 (1 point) Saved Information has several properties that make information goods...
By Kirsch , Uploaded: Oct 15, 2019
$9.5
Marketing> QUESTIONS & ANSWERS > Marketing Management Chapter 2 to Chapter 10 Q&A (All)

Marketing Management Chapter 2 to Chapter 10 Q&A
Chapter 2 to Chapter 10 Chapter 2: Developing Marketing Strategies and Plans GENERAL CONCEPT QUESTIONS Multiple Choice 66 Chapter 1: Marketing: Managing Profitable Customer Relationships...
By Kirsch , Uploaded: Oct 14, 2019
$10
Document information
Connected school, study & course
About the document
Uploaded On
May 01, 2020
Number of pages
108
Written in

Additional information
This document has been written for:
Uploaded
May 01, 2020
Downloads
0
Views
161