Database Management > EXAM > Florida International University - QMB 6406 final exam with complete solution (All)
Florida International University - QMB 6406 final exam with complete solution
Document Content and Description Below
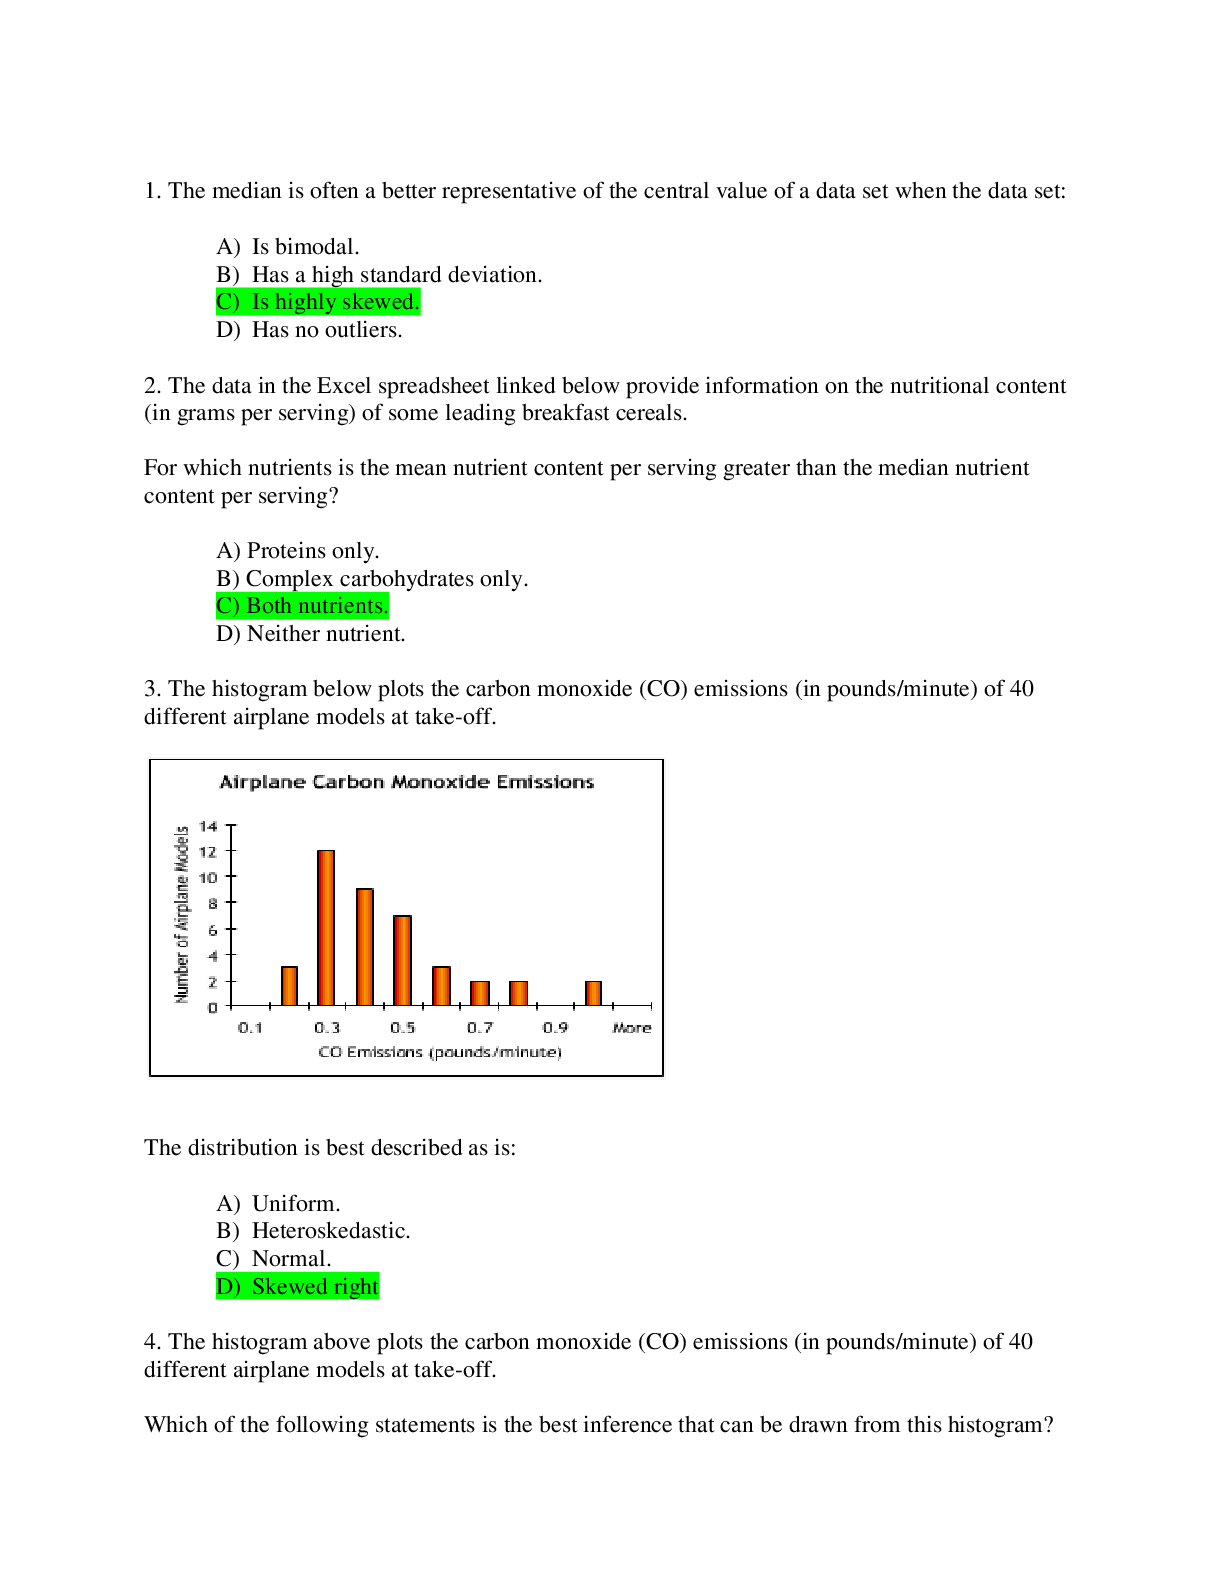
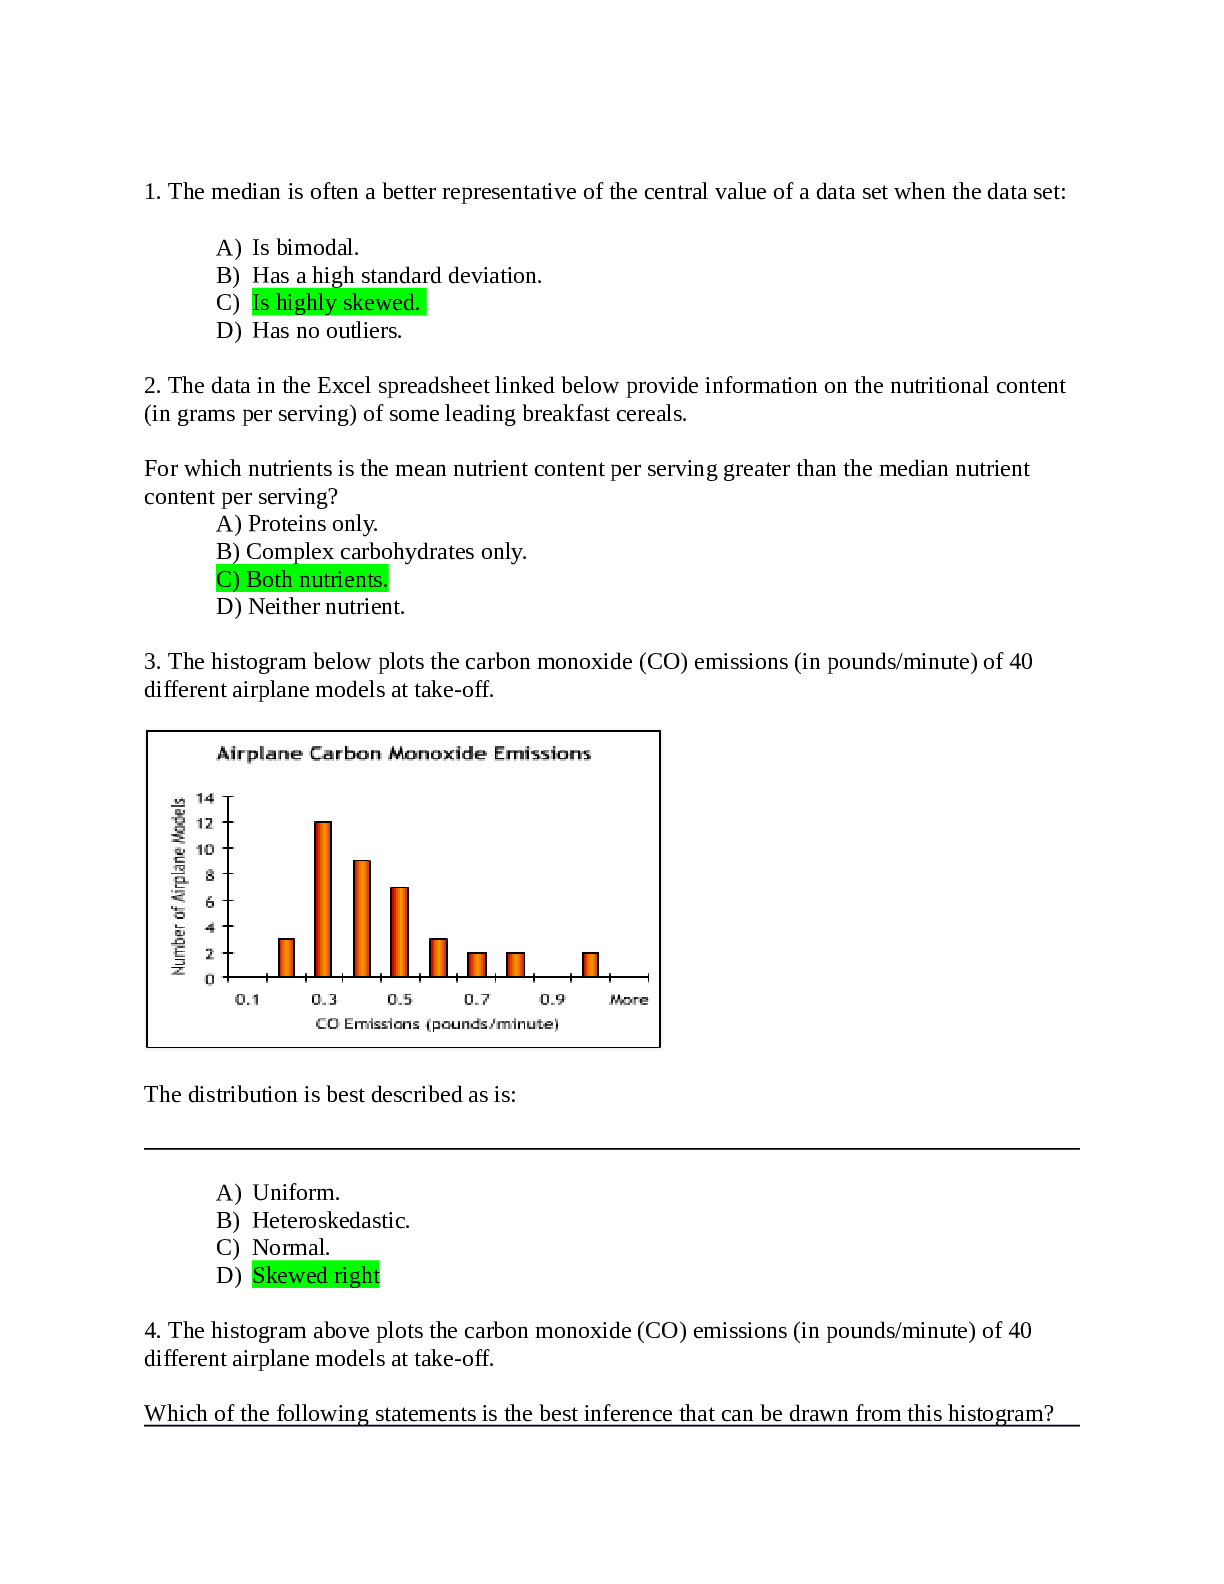
1. The median is often a better representative of the central value of a data set when the data set: ⦁ Is bimodal. ⦁ Has a high standard deviation. ⦁ Is highly skewed. ⦁ Has no outliers... . 2. The data in the Excel spreadsheet linked below provide information on the nutritional content (in grams per serving) of some leading breakfast cereals. For which nutrients is the mean nutrient content per serving greater than the median nutrient content per serving? A) Proteins only. B) Complex carbohydrates only. C) Both nutrients. D) Neither nutrient. 3. The histogram below plots the carbon monoxide (CO) emissions (in pounds/minute) of 40 different airplane models at take-off. The distribution is best described as is: ⦁ Uniform. ⦁ Heteroskedastic. ⦁ Normal. ⦁ Skewed right 4. The histogram above plots the carbon monoxide (CO) emissions (in pounds/minute) of 40 different airplane models at take-off. Which of the following statements is the best inference that can be drawn from this histogram? ⦁ The mean amount of carbon monoxide emissions is greater than the median amount of carbon monoxide emissions. ⦁ The mean amount of carbon monoxide emissions is less than the median amount of carbon monoxide emissions. ⦁ The mean and median amounts of carbon monoxide emissions are about equal. ⦁ The relative sizes of the mean and median amounts of carbon monoxide emissions cannot be inferred from the histogram. 5. In the data set shown below, the correlation coefficient of the two variables is: A) -1.0. B) -0.5 C) 0.0 D) None of the above. 6. The data in the Excel spreadsheet linked below give the ages and salaries of the chief executive officers of 59 companies with sales between $5 million and $350 million. The correlation between age and salary can be characterized as: ⦁ Strong and positive. ⦁ Strong and negative. ⦁ Weak and positive. ⦁ Weak and negative. 7. For a given set of data, the standard deviation measures: ⦁ The difference between the mean and the data point farthest from the mean. ⦁ The difference between the mean and the data point nearest to the mean. ⦁ The difference between the mean and the median. ⦁ None of the above. 8. The data in the Excel spreadsheet linked below give the average exchange rates of four currencies to the US dollar during October 2002. Over this period, which currency was most volatile relative to the US dollar, as measured by the coefficient of variation? A) The Brazilian Real. B) The Euro. C) The Japanese Yen. D) The South Korean Won. 9. A national business magazine intends to survey its subscribers to determine who they think is the "CEO of the Century." Subscribers are invited to complete an online survey. Based only on this information, which of the following can be inferred about the survey results? ⦁ They will be biased because the magazine's subscribers are unqualified to determine who the CEO of the century is. ⦁ They will accurately reflect the opinion of the nation as a whole about who the CEO of the century is. ⦁ They will be unbiased because the respondents will be self-selected. ⦁ They will be biased because subscribers who have access to the online survey are not representative of the population of subscribers as a whole. 10. A political consultant conducts a survey to determine what position the mayoral candidate she works for should take on a proposed smoking ban in restaurants. Which of the following survey questions will deliver an unbiased response? ⦁ Should the city ban smoking in restaurants to protect our children from second-hand smoke? ⦁ Should tobacco smoke, a known cause of lung cancer, be banned from public spaces such as restaurants? ⦁ Does the city have the right to restrict recreational activities, such as moderate consumption of alcohol or tobacco, on the premises of privately-owned businesses? ⦁ None of the above. 11. In a recently administered IQ test, the scores were distributed normally, with mean 100 and standard deviation 15. What proportion of the test takers scored between 70 and 130? ⦁ About 68%. ⦁ About 84%. ⦁ About 95%. ⦁ About 99.5%. [Show More]
Last updated: 1 year ago
Preview 1 out of 14 pages
Instant download
Instant download
Reviews( 0 )
Document information
Connected school, study & course
About the document
Uploaded On
Mar 24, 2021
Number of pages
14
Written in

Additional information
This document has been written for:
Uploaded
Mar 24, 2021
Downloads
0
Views
58
.png)
.png)
 (1)_removed.png)
_removed.png)

.png)


-converted.png)