Biology > GIZMOS > Questions and Answers > GIZMOS: Student Exploration: Hardy-Weinberg Equilibrium (All)
Questions and Answers > GIZMOS: Student Exploration: Hardy-Weinberg Equilibrium
Document Content and Description Below
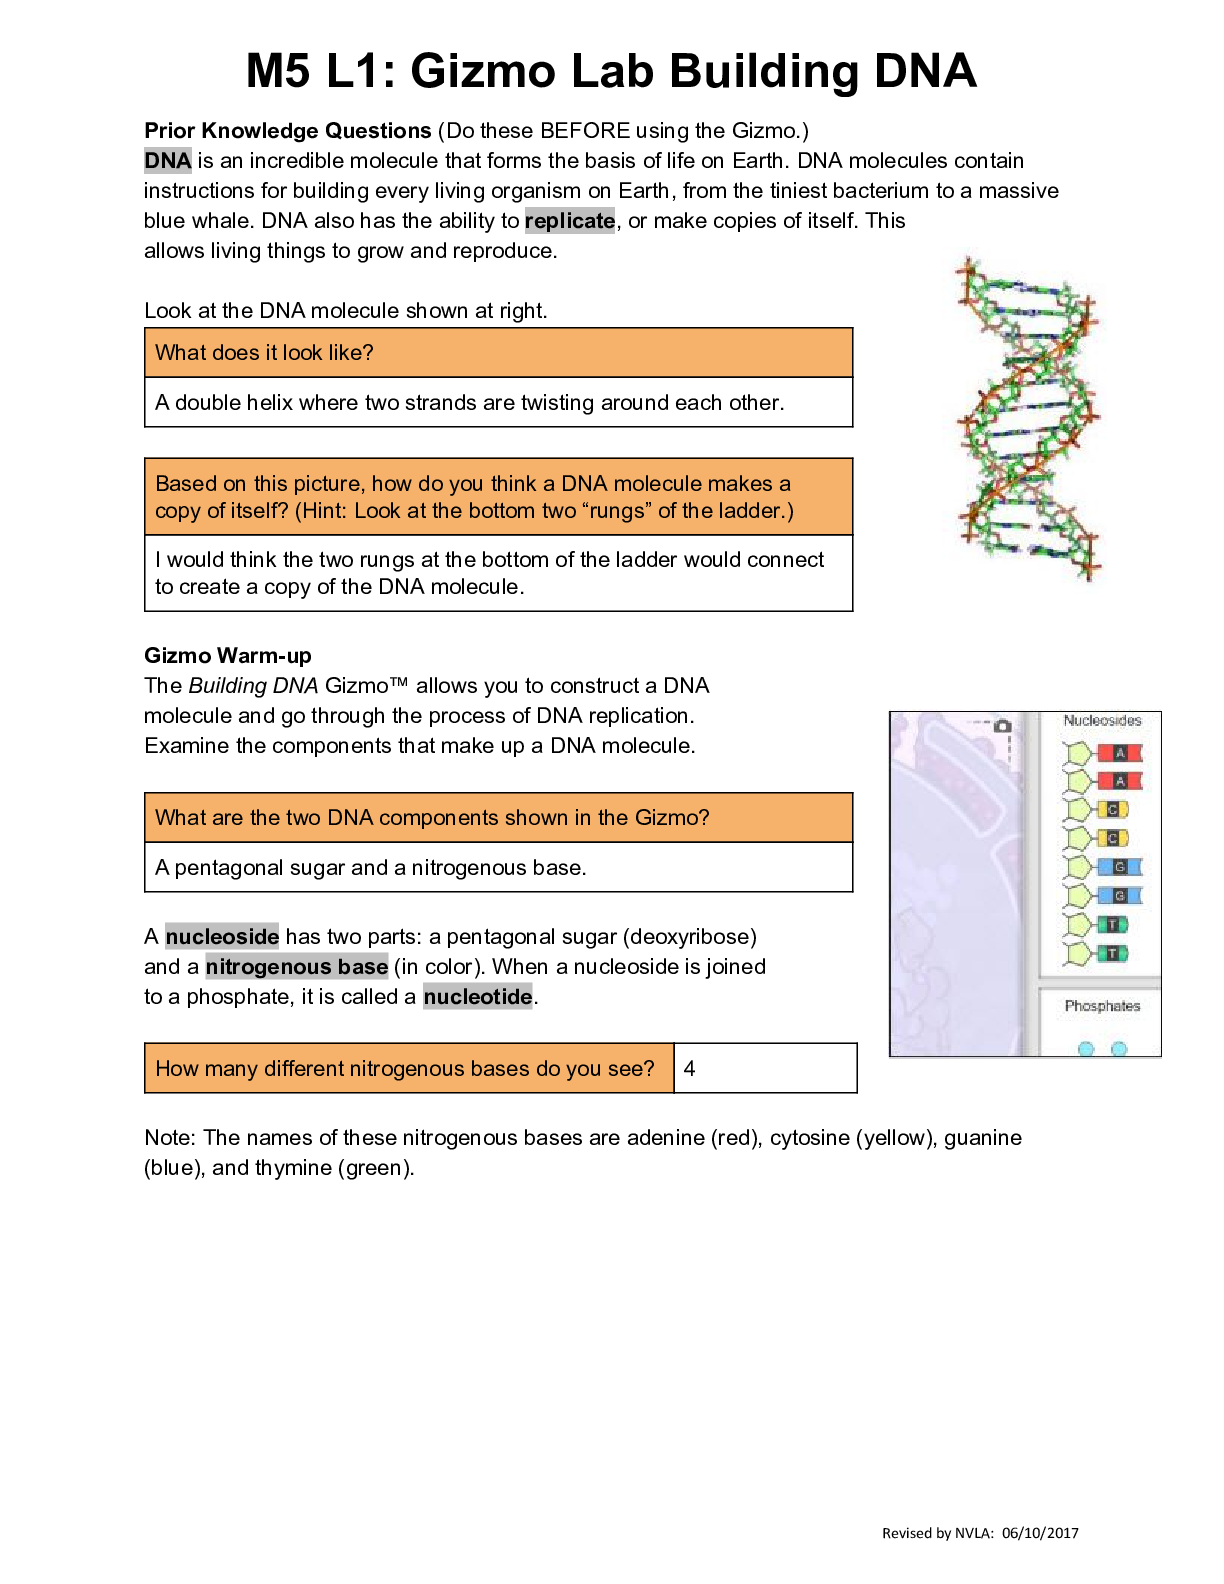
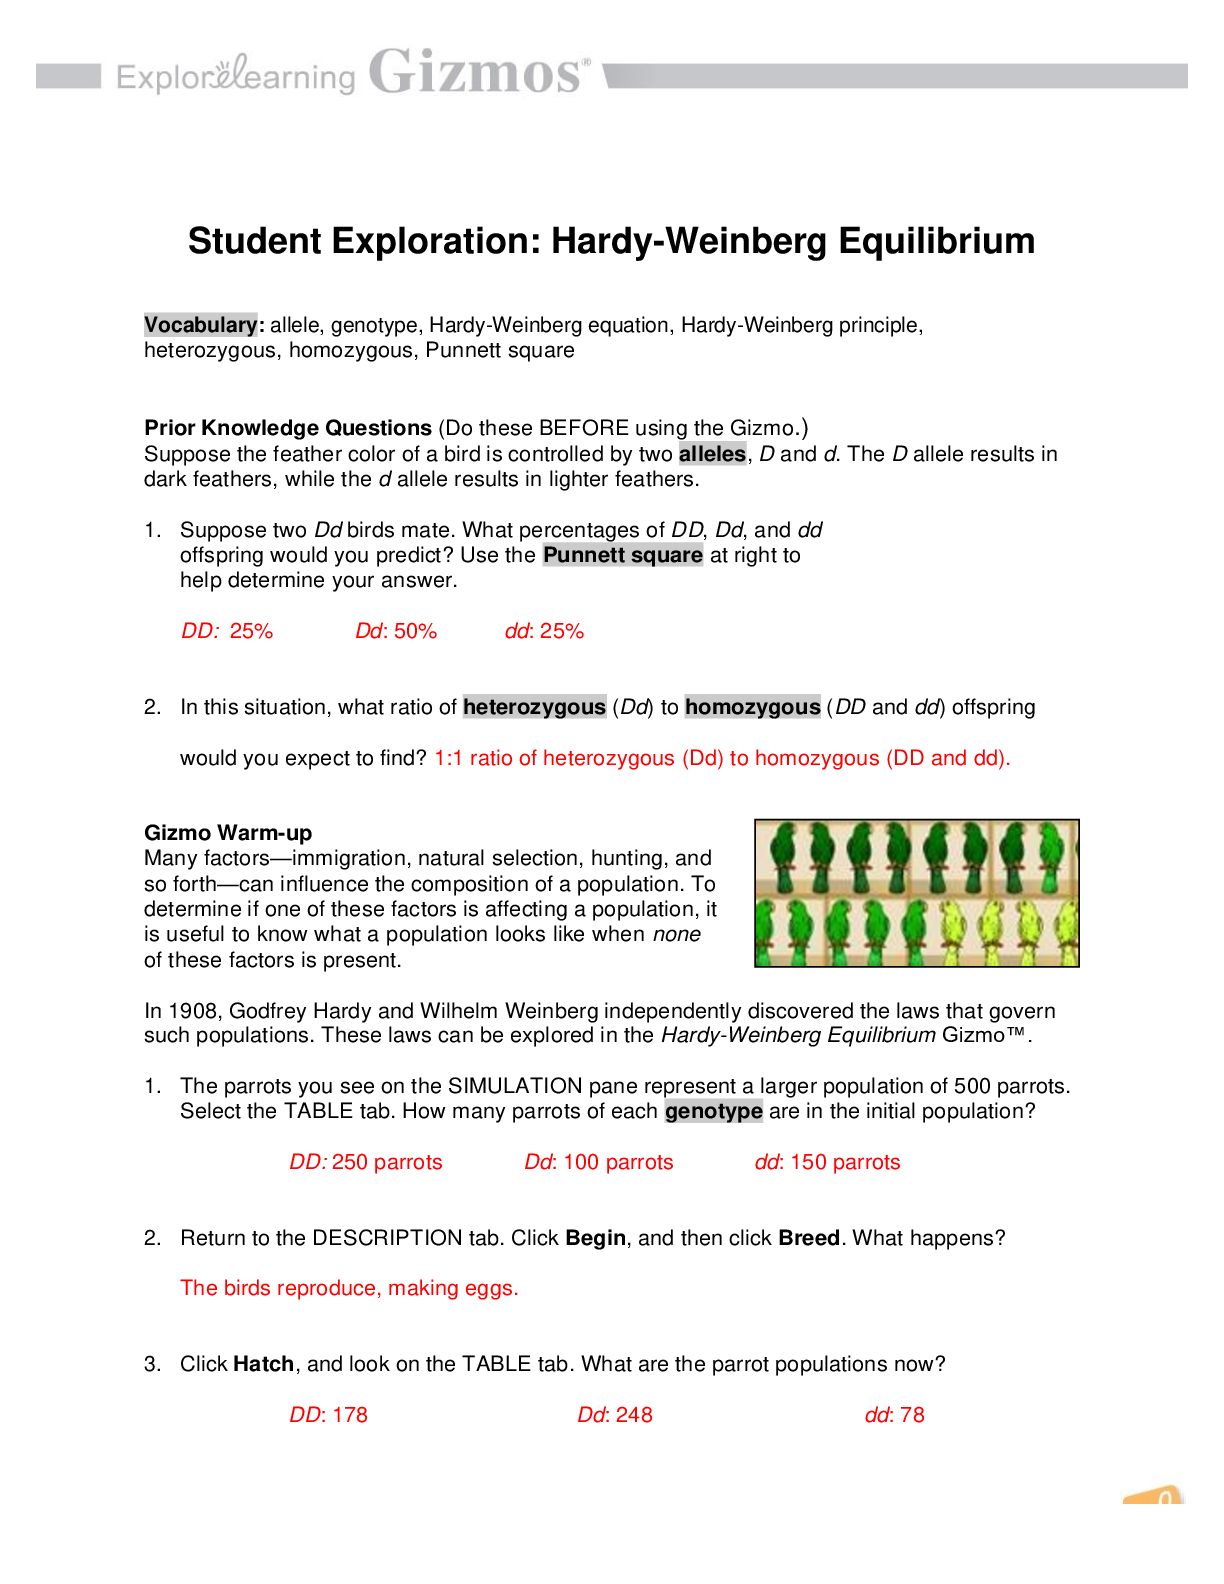
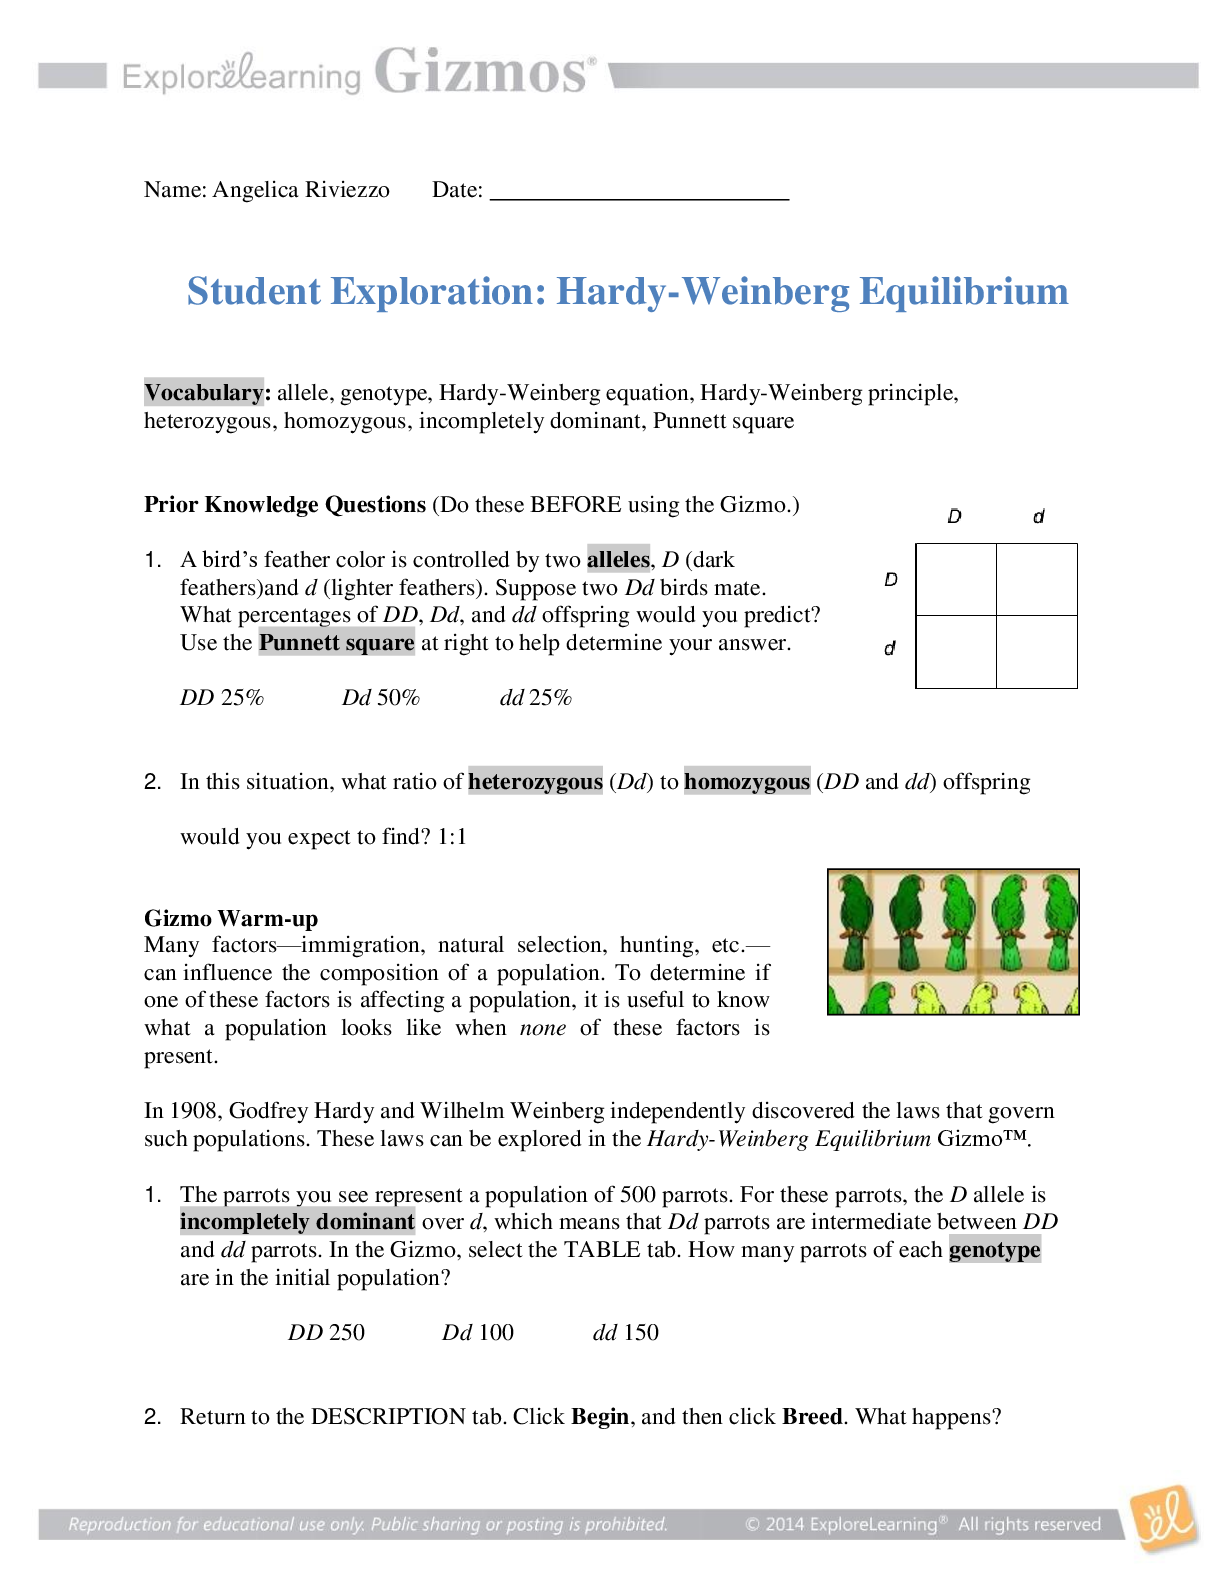
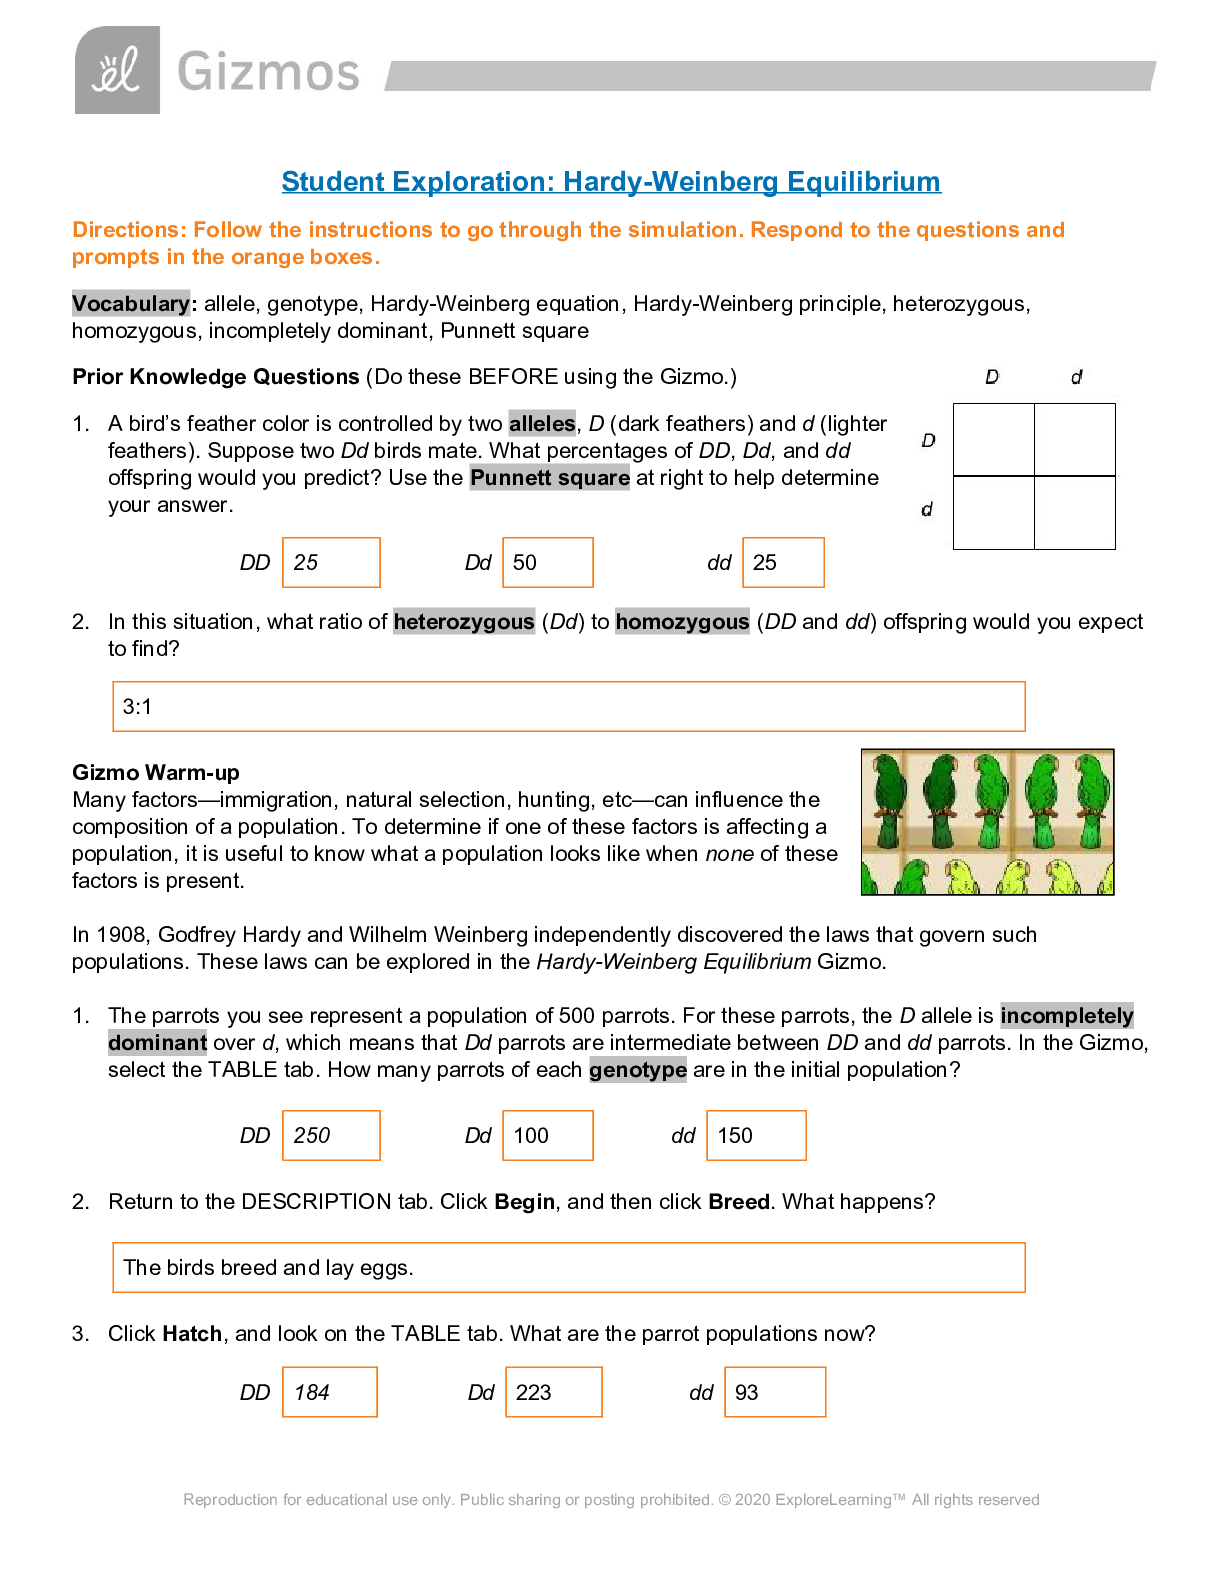
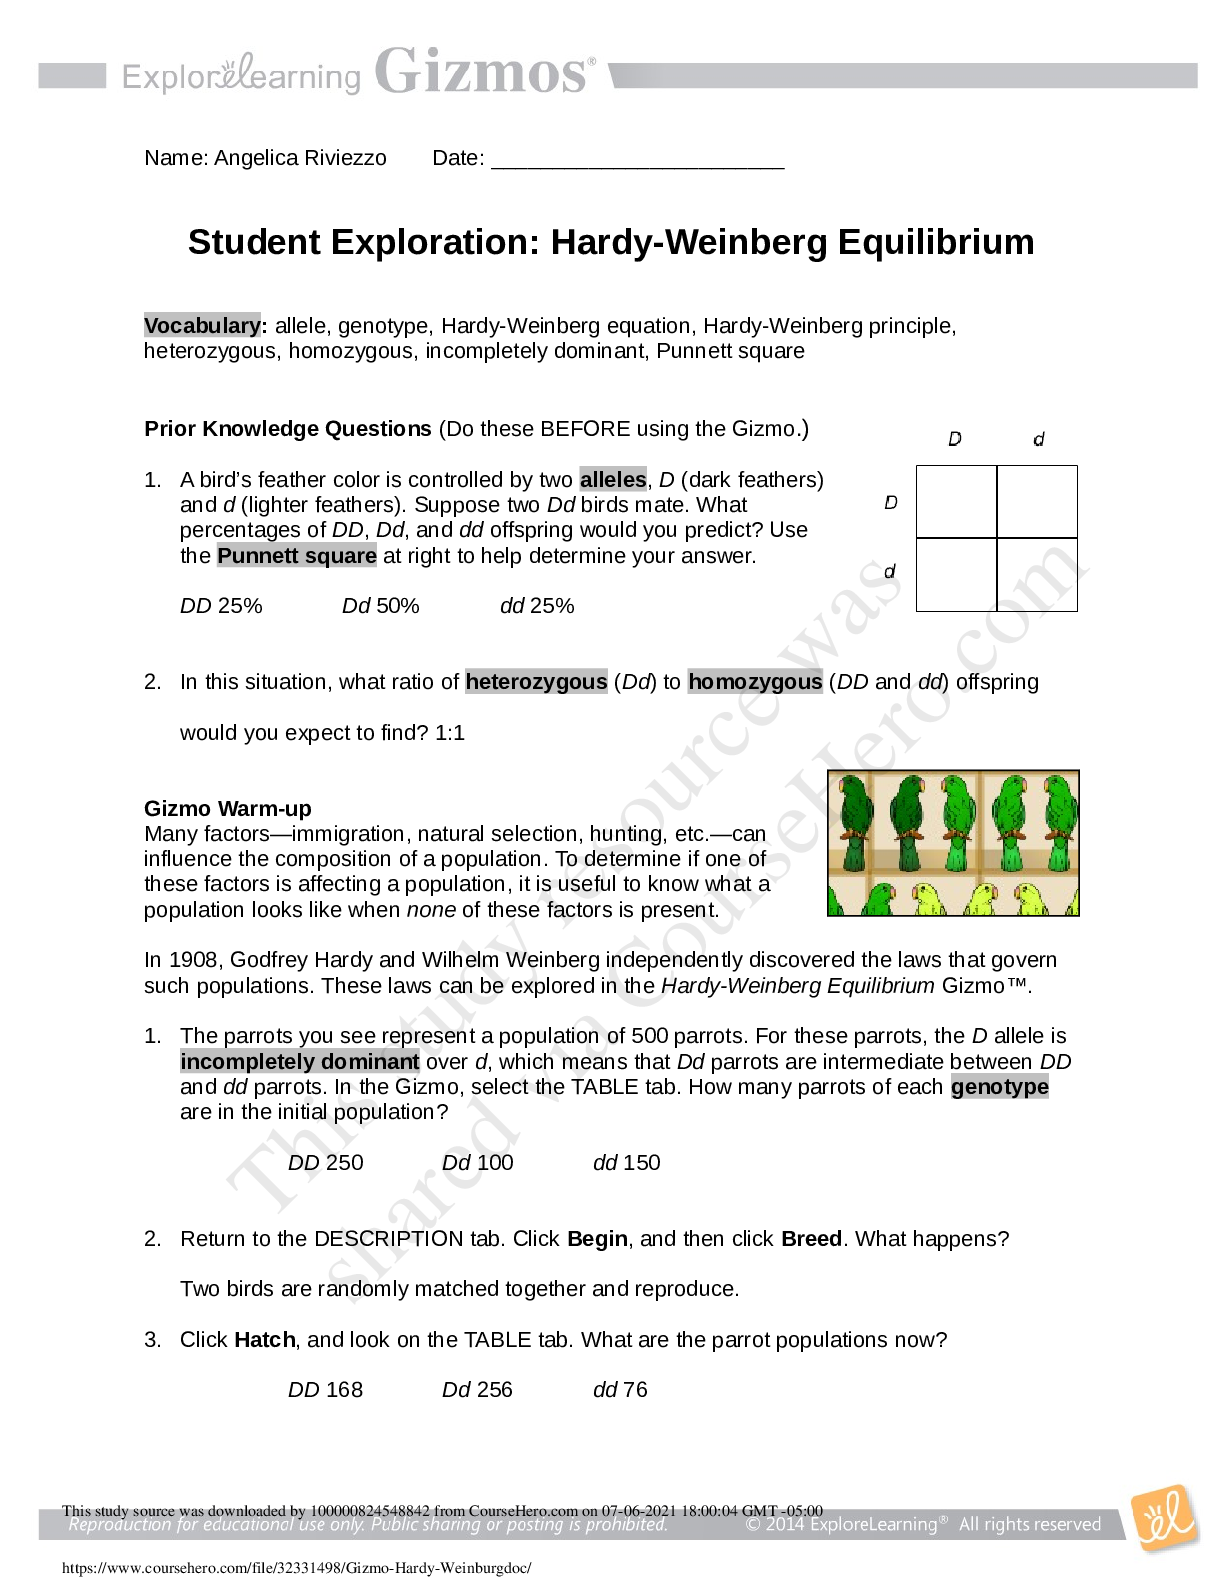
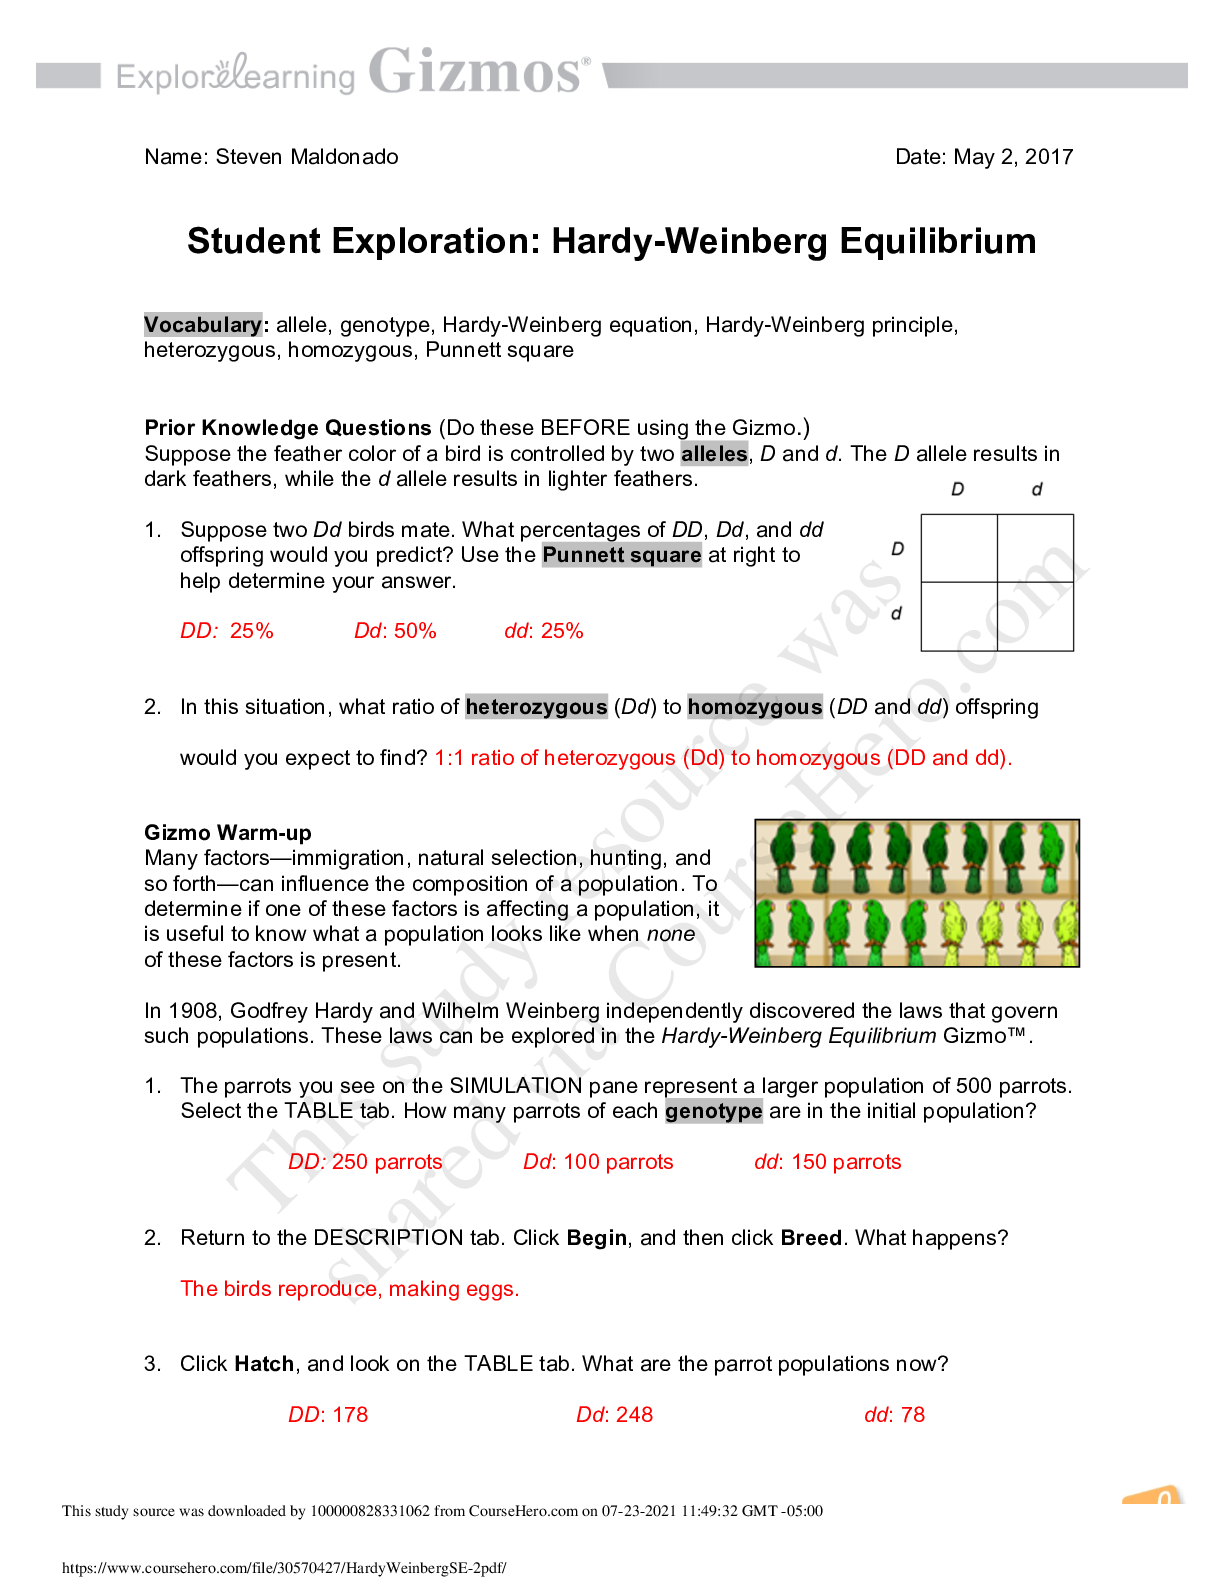
Name: Steven Maldonado Date: May 2, 2017 Student Exploration: Hardy-Weinberg Equilibrium Vocabulary: allele, genotype, Hardy-Weinberg equation, Hardy-Weinberg principle, heterozygous, homozy gous, Pun... nett square Prior Knowledge Questions (Do these BEFORE using the Gizmo.) Suppose the feather color of a bird is controlled by two alleles, D and d. The D allele results in dark feathers, while the d allele results in lighter feathers. 1. Suppose two Dd birds mate. What percentages of DD, Dd, and dd offspring would you predict? Use the Punnett square at right to help determine your answer. 2. In this situation, what ratio of heterozygous (Dd) to homozygous (DD and dd) offspring would you expect to find? ] Gizmo Warm-up Many factors—immigration, natural selection, hunting, and so forth—can influence the composition of a population. To determine if one of these factors is affecting a population, it is useful to know what a population looks like when none of these factors is present. In 1908, Godfrey Hardy and Wilhelm Weinberg independently discovered the laws that govern such populations. These laws can be explored in the Hardy-Weinberg Equilibrium Gizmo™. 1. The parrots you see on the SIMULATION pane represent a larger population of 500 parrots. Select the TABLE tab. How many parrots of each genotype are in the initial population? 2. Return to the DESCRIPTION tab. Click Begin, and then click Breed. What happens? 3. Click Hatch, and look on the TABLE tab. What are the parrot populations now? Activity A: Alleles and genotypes Get the Gizmo ready: • On the DESCRIPTION tab, click Reset. • Check that DD is 50% and dd is 30%. Question: How will the proportion of genotypes and alleles change over time when mating is random and no natural selection is occurring? 1. Predict: How do you expect the proportions of D and d alleles to change over time? I expect there to be a change from homozygous making the overall population of the heterozygous parrots increase (Dd). 2. Gather data: Run a generation in the Gizmo. After clicking Hatch, fill in the allele and genotype percentages for generation 1. Repeat this process for 5 generations. 3. Analyze: What patterns do you see in your data? 4. Interpret: Select the ALLELE GRAPH tab. What does this graph show? 5. Interpret: Select the GENOTYPE GRAPH tab. What does this graph show? (Activity A continued on next page) Activity A (continued from previous page) 6. Gather data: On the DESCRIPTION tab, click Reset. generations. Record the allele and genotype percentages for each generation in the table below. 7. Analyze: Do the patterns you noticed in the first experiment appear in the second? Explain. Yes the patterns does appear in the second one, there is are increases and increases after every generation. 8. Draw conclusions: The Hardy-Weinberg principle states that the proportions How well does the Hardy-Weinberg principle describe this population of parrots? 9. Think and discuss: Would you say that this parrot population is evolving? Explain. Question: How do genotype percentages relate to allele percentages? 1. Calculate: You can use the laws of probability to predict how many DD, Dd, and dd offspring will result from this parent population. A. What is the current percentage of D alleles in the population? B. What is the current percentage of d alleles in the population? C. What is the probability of inheriting a D allele from a parent? (Hint: Convert the percentage of D alleles to a decimal.) D. What is the probability of inheriting a d allele? 2. Explain: If a trait is determined by two alleles, the sum of p and q is 1. Why is this true? 3. Calculate: Fill in the current p and q values next to the D and d alleles around the Punnett square at right. Then calculate the probability of each offspring genotype. Write these values into the individual squares. For example, the upper left box in the square represents the probability of a DD offspring. The probability of inheriting a D allele from each parent is p, so the probability of DD is p 2. What is the sum of the probabilities in the four squares? p2+2pq+q2 4. Manipulate: Now determine an algebraic expression for the probability of each genotype in terms of p (the probability of inheriting D) and q (the probability of inheriting d). Use the Punnett square above as a guide. A. In terms of p and q, what is the probability of a DD offspring? B. In terms of p and q, what is the probability of a dd offspring? C. In terms of p and q, what is the probability of a Dd offspring? (Activity B continued on next page) Activity B (continued from previous page) 5. Calculate: The Hardy-Weinberg equation states that the sum of the probabilities of each genotype is equal to 1: Why is the probability of Dd equal to 2pq? 6. Predict: Check that DD is still set to 30% and dd is still set to 70%. Predicted percentages: 7. Test: Click Begin, Breed, and Hatch. What are the resulting genotype percentages? Actual percentages: How close are these to the predicted values? They were very close the predicted values. 8. Apply: For a dominant/recessive gene, it is often difficult to determine the percentages of dominant and recessive alleles in a population because individuals that express the dominant trait may be either homozygous (DD) or heterozygous (Dd). The only thing that is known for certain is the percentage of individuals that are homozygous recessive (dd). A. Suppose that 16% of a population is homozygous recessive (dd). According to the Hardy-Weinberg equation, what is the value of q 2? The value of q2 is B. If you know q 2, you can calculate q. What is the value of q? C. Recall that p + q is equal to 1. What is the value of p? D. Based on the values of p and q, calculate the percentages of the DD and Dd genotypes: 9. Check: If a population is in Hardy-Weinberg equilibrium, genotype percentages will remain stable over time. Set DD to the value given in part D above and dd to 16%. Run several generations in the Gizmo. Do the genotype percentages remain relatively constant? Explain. Question: How can you determine if a population is in Hardy-Weinberg equilibrium? 1. Manipulate: The Hardy-Weinberg equation is p 2 + 2pq + q 2 = 1, where p = probability of D, q = probability of d, p2 = probability of DD, 2pq = probability of Dd, and q2 = probability of dd. A. Look under Show Hardy-Weinberg quantities. Notice there are two terms: Dd•Dd and DD•dd. Rewrite each of these in terms of the variables p and q. B. The third line of the table is the ratio (Dd•Dd) / (DD•dd). Rewrite this ratio in terms of p and q, and then simplify the expression. Show your work. (2pq)(2pq)/ (p2)(q2) Simplified C. If a population is in Hardy-Weinberg equilibrium, what would you expect to be the ratio of Because this ratio is usually close to 4 when a population is in Hardy-Weinberg equilibrium, finding the ratio can be used as a quick test to see if a population is in equilibrium or not. (Note: In most populations, the ratio will range from about 2 to 8.) 2. Experiment: With Dd set to 0%, the initial value of Dd•Dd / DD•dd is 0. Click Begin, Breed, and Hatch. Record the percentage of DD, Dd, dd, and Dd•Dd / DD•dd for 5 generations in the table below. 3. Calculate: What is the mean value of While the value of Dd•Dd / DD•dd may vary a bit, it will tend to stay fairly close to the expected value of 4 as long as a population is in Hardy-Weinberg equilibrium. If the value of Dd•Dd / DD•dd differs significantly from 4 (for example, below 2 or above 8), it is a sign that the population is not in equilibrium and selection may be taking place. [Show More]
Last updated: 1 year ago
Preview 1 out of 7 pages
Reviews( 0 )
Document information
Connected school, study & course
About the document
Uploaded On
Jul 23, 2021
Number of pages
7
Written in

Additional information
This document has been written for:
Uploaded
Jul 23, 2021
Downloads
0
Views
105