Statistics > QUESTIONS & ANSWERS > STAT 200 QUIZ 2 ANSWERS (UMUC) / STAT 200 STAT200 Quiz 2 Answers (UMUC) Answered_2021 (All)
STAT 200 QUIZ 2 ANSWERS (UMUC) / STAT 200 STAT200 Quiz 2 Answers (UMUC) Answered_2021
Document Content and Description Below
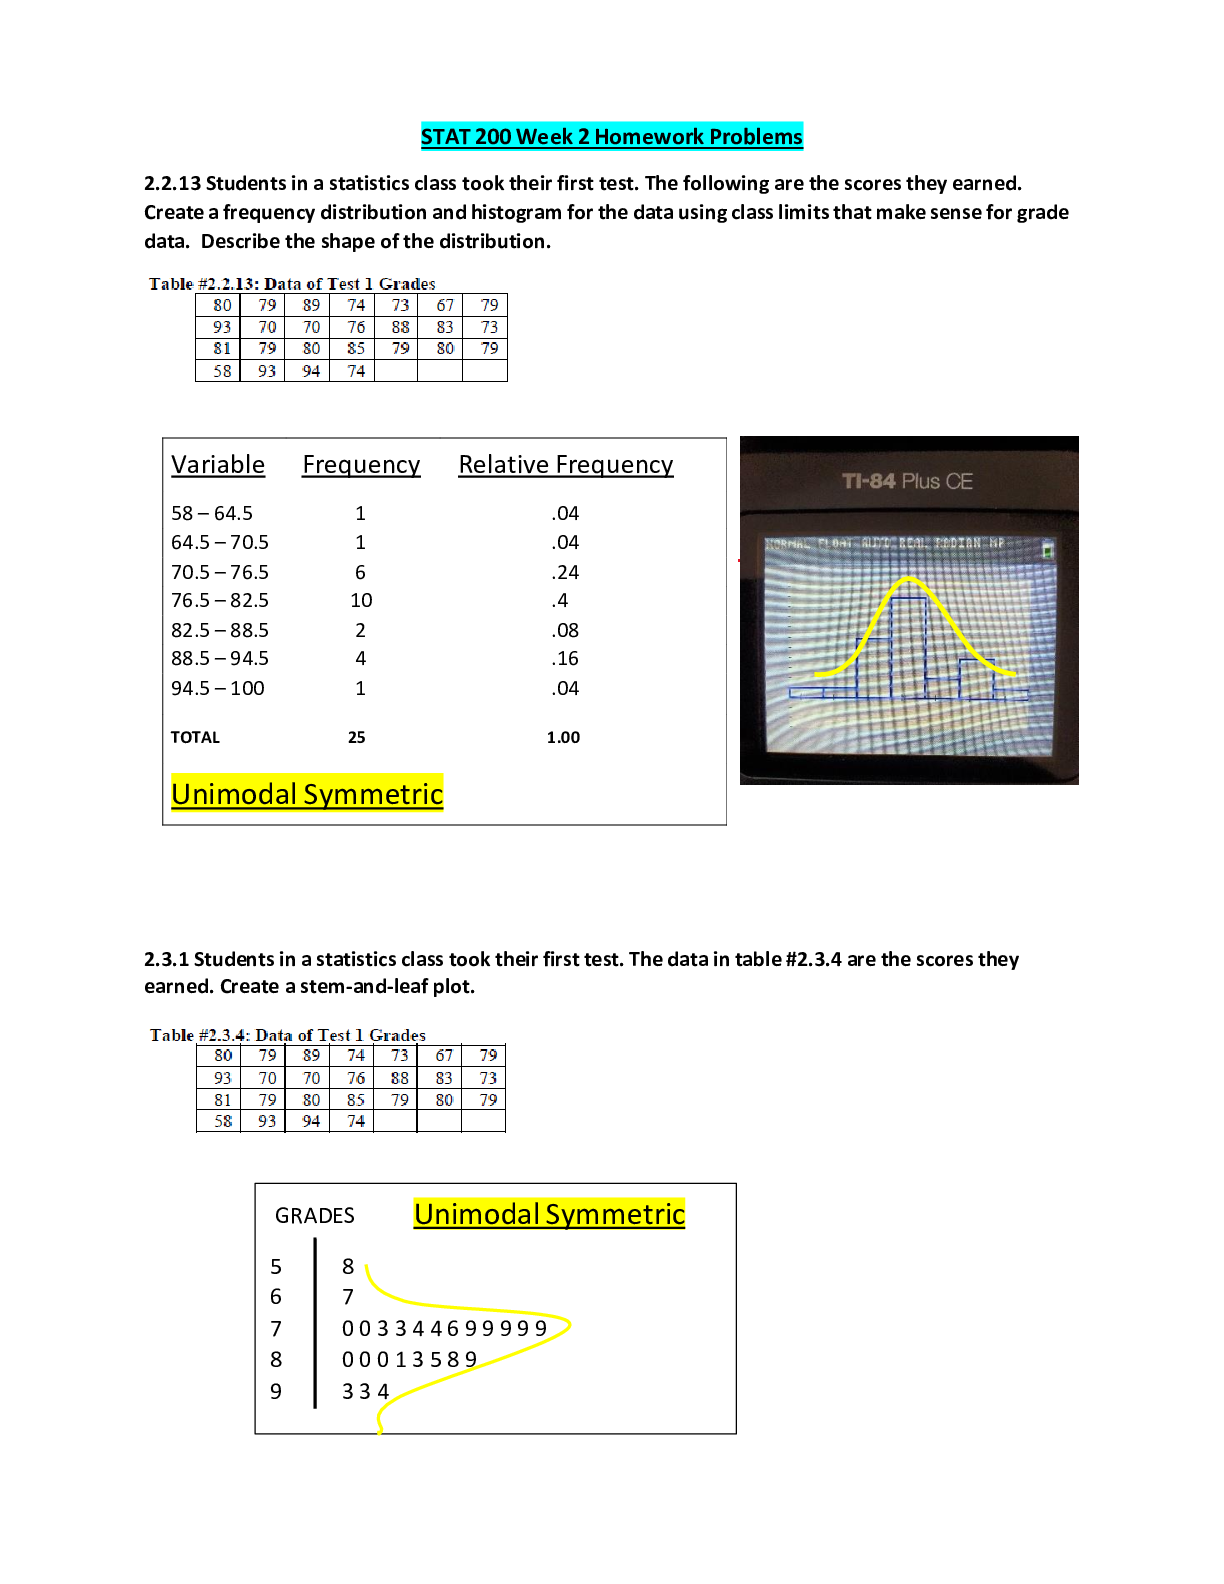
STAT 200 Week 2 Homework Problems 2.2.13 Students in a statistics class took their first test. The following are the scores they earned. Create a frequency distribution and histogram for the data u... sing class limits that make sense for grade data. Describe the shape of the distribution. 2.3.1 Students in a statistics class took their first test. The data in table #2.3.4 are the scores they earned. Create a stem-and-leaf plot. 2.3.3 When an anthropologist finds skeletal remains, they need to figure out the height of the person. The height of a person (in cm) and the length of one of their metacarpal bone (in cm) were collected and are in table #2.4.6 ("Prediction of height," 2013). Create a scatter plot and state if there is a relationship between the height of a person and the length of their metacarpal. 3.1.2 The lengths (in kilometers) of rivers on the South Island of New Zealand that flow to the Pacific Ocean are listed in table #3.1.8 (Lee, 1994). Find the mean, median, and mode. Table #3.1.8: Lengths of Rivers (km) Flowing to Pacific Ocean 3.1.5 Print-O-Matic printing company’s employees have salaries that are contained in table #3.1.11. a.) Find the mean and median. b.) Find the mean and median with the CEO’s salary removed. c.) What happened to the mean and median when the CEO’s salary was removed? Why? d.) If you were the CEO, who is answering concerns from the union that employees are underpaid, which average of the complete data set would you prefer? Why? e.) If you were a platen worker, who believes that the employees need a raise, which average would you prefer? Why? 3.1.10 Looking at graph #3.1.2, state if the graph is skewed left, skewed right, or symmetric and then state which is larger, the mean or the median? 3.2.6 Print-O-Matic printing company spends specific amounts on fixed costs every month. The costs of those fixed costs are in table #3.2.13. Table #3.2.13: Fixed Costs for Print-O-Matic Printing Company 3.3.2 Suppose your child takes a standardized test in mathematics and scores in the 96th percentile. What does this percentile mean? Can you say your child passed the test? Explain. 3.3.3 Suppose your child is in the 83rd percentile in height and 24th percentile in weight. Describe what this tells you about your child’s stature. 3.3.10 A study was conducted to see the effect of exercise on pulse rate. Female subjects were taken who do not smoke, but do drink. Their pulse rates were measured ("Pulse rates before," 2013). Then they ran in place for one minute, and after measured their pulse rate again. Graph #3.3.8 is of box-and- whiskers plots that were created of the before and after pulse rates. Discuss any conclusions you can make from the graphs. [Show More]
Last updated: 1 year ago
Preview 1 out of 5 pages
Buy this document to get the full access instantly
Instant Download Access after purchase
Add to cartInstant download
We Accept:

Reviews( 0 )
$15.00
Document information
Connected school, study & course
About the document
Uploaded On
Apr 28, 2021
Number of pages
5
Written in

Additional information
This document has been written for:
Uploaded
Apr 28, 2021
Downloads
0
Views
34
.png)
.png)


, Latest Questions and Answers with Explanations, All Correct Study Guide, Download to Score A.png)
, Latest Questions and Answers with Explanations, All Correct Study Guide, Download to Score A.png)
, Latest Questions and Answers with Explanations, All Correct Study Guide, Download to Score A.png)
.png)