Mathematics > EXAM > MATH 110 Combination of Exam (GRADED A) Questions and Answers- Portage Learning | GUARANTEED PASS. (All)
MATH 110 Combination of Exam (GRADED A) Questions and Answers- Portage Learning | GUARANTEED PASS.
Document Content and Description Below
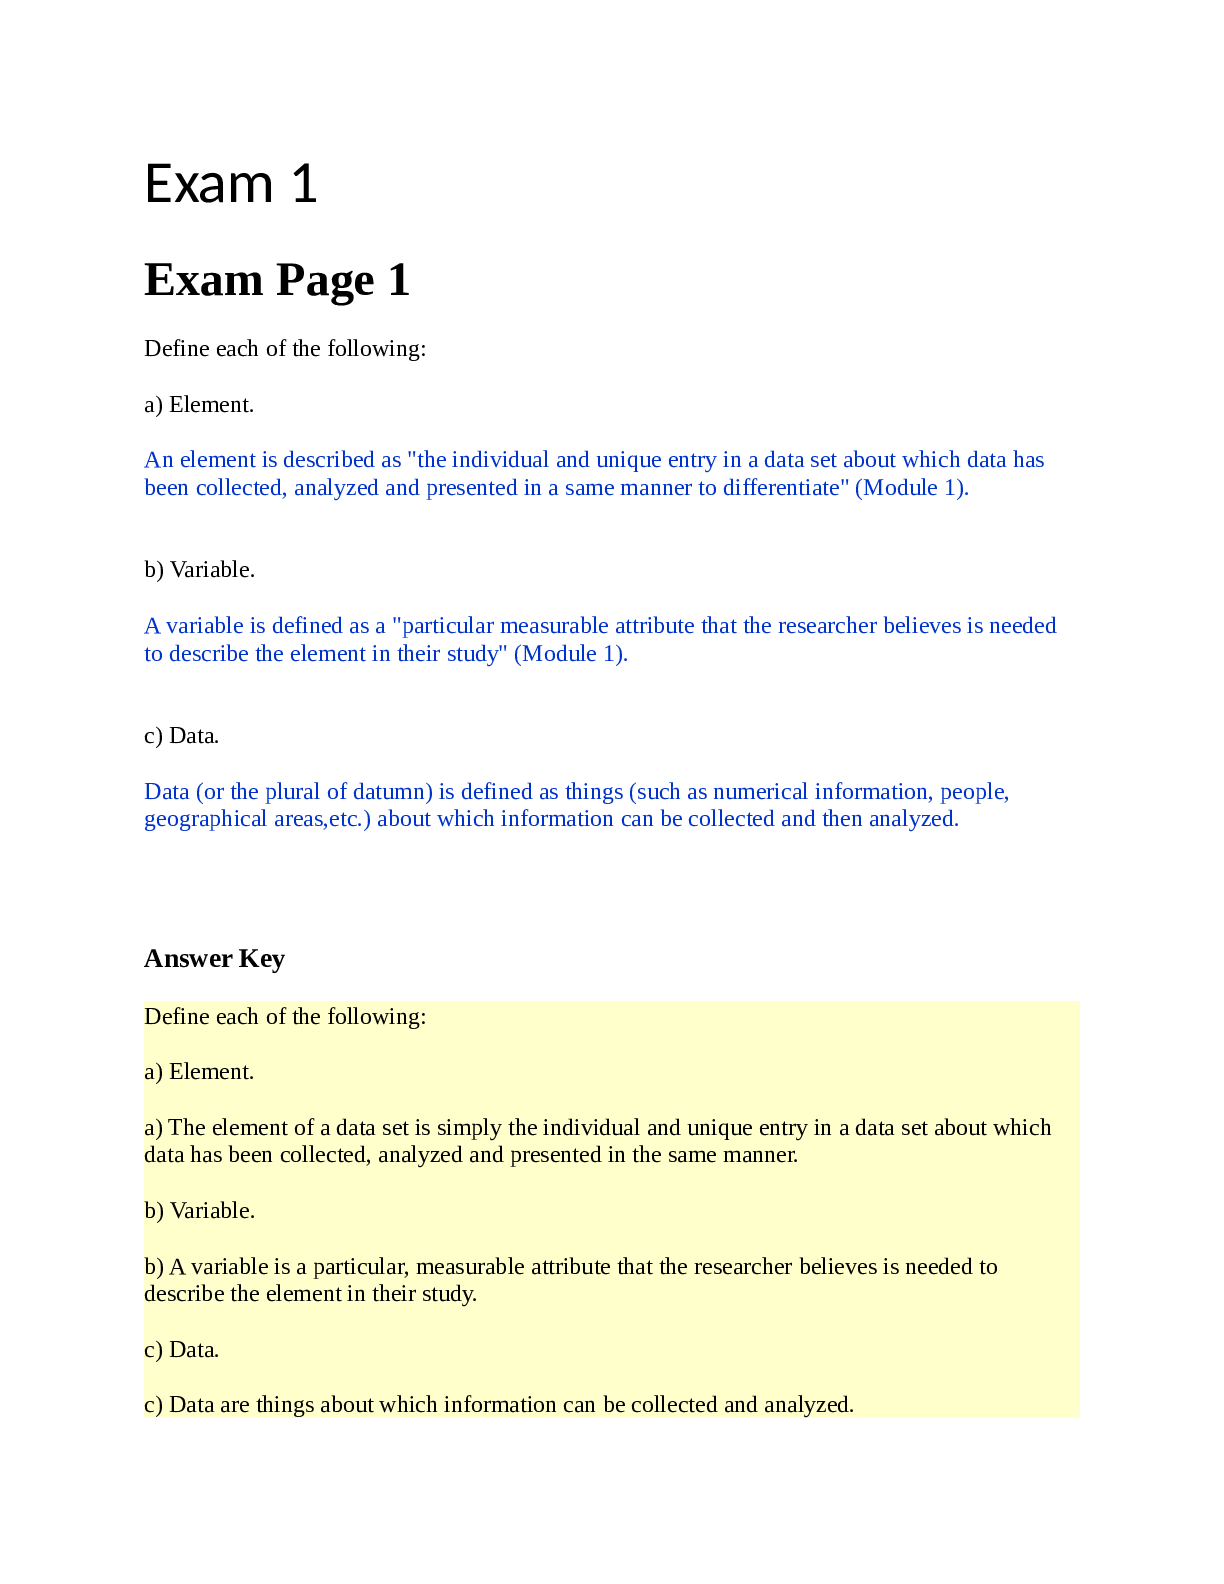
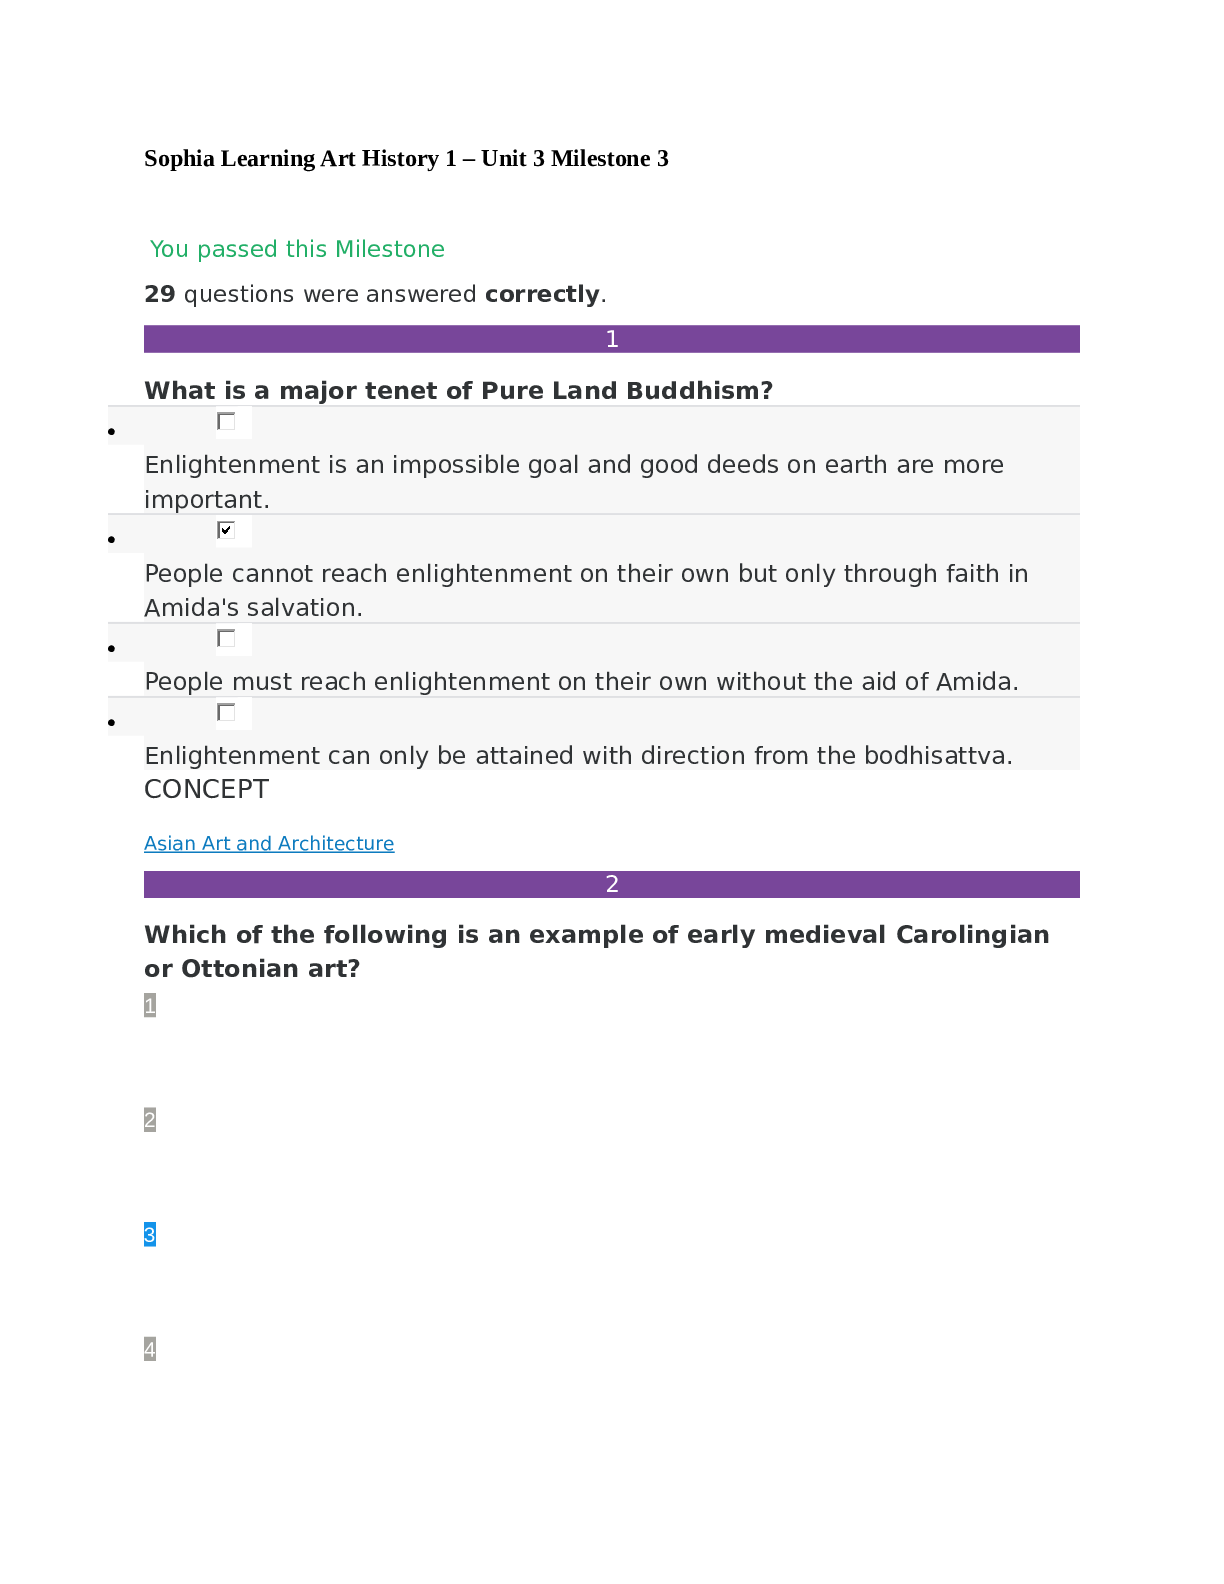
Exam 1 Exam Page 1 Define each of the following: a) Element. An element is described as "the individual and unique entry in a data set about which data has been collected, analyzed and present... ed in a same manner to differentiate" (Module 1). b) Variable. A variable is defined as a "particular measurable attribute that the researcher believes is needed to describe the element in their study" (Module 1). c) Data. Data (or the plural of datumn) is defined as things (such as numerical information, people, geographical areas,etc.) about which information can be collected and then analyzed. Answer Key Exam Page 2 Explain the difference between population and sample. "The entire number of items in a large group" would be defined as the population. (Module 1) The sample is then taken from the population by a researcher and is studied.The sample taken from the population is, in fact, the subset of the population. You need the population to get the sample and without the population, there can be no sample. Instructor Comments Very good definitions. Answer Key Exam Page 3 Look at the following data and see if you can identify any outliers: 65 71 55 69 3 77 67 70 246 61 277 3, 246, 277 Instructor Comments Very good. Answer Key Exam Page 4 The following pie chart shows the percentages of total items sold in a month in a certain fast food restaurant. A total of 4900 fast food items were sold during the month. How many were burgers? How many were french fries? 4900(.32)=1568 32% or 1,568 burgers were sold during the month. 4900(.18)=882 18% or 882 french fries were sold during the month. Instructor Comments Very good. Answer Key Exam 2 Exam Page 1 During an hour at a fast food restaurant, the following types of sandwiches are ordered: Turkey Hamburger Cheeseburger Fish Hamburger Turkey Fish Chicken Fish Chicken Turkey Fish Hamburger Fish Cheeseburger Fish Cheeseburger Hamburger Fish Fish Cheeseburger Hamburger Fish Turkey Turkey Chicken Fish Chicken Cheeseburger Fish Turkey Fish Fish Hamburger Fish Fish Turkey Chicken Hamburger Fish Cheeseburger Chicken Chicken Turkey Fish Chicken Hamburger Chicken Fish Chicken a) Make a frequency distribution for this data. Types of Frequency Sandwiches Turkey 8 Chicken 10 Cheeseburger 6 Fish 18 Hamburger 8 Total 50 b) Make a relative frequency distribution for this data. Include relative percentages on this table. Types of Frequency Relative Relative Sandwiches Frequency Percentage Turkey 8 (8/50)= .16 (.16)100= 16% Chicken 10 (10/50)= .20 (.20)100= 20% Cheeseburger 12% Fish 6 18 (6/50)= (18/50)= .12 .36 (.12)100= (.36)100= 36% Hamburger 8 (8/50)= .16 (.16)100= 16% Total 50 1 100% Exam Page 2 Consider the following data: 422 389 414 401 466 421 399 387 450 407 392 410 440 417 490 Find the 20th percentile of this data. 387,389,392,399,401,407,410,414,417,421,422,440,450,466,490 i=(p n = (20) *15= 3 100 ) 100 i=3 392 is the 20th percentile of this data. Exam Page 3 Consider the following data: {29, 20, 24, 18, 32, 21} a) Find the sample mean of this data. x* = ∑xi n x*=(29+20+24+18+32+21) =144=24 6 6 b) Find the range of this data. {18,20,21,24,29,32} Range is 14 (32-18)=14 c) Find the sample standard deviation of this data. s2=∑(xi-x)2 = (18-24)2 + (20-24)2+(21-24)2+(24-24)2+(29-24)2+(32-24)2 = 36+16+9+0+25+64= 150=30 n-1 6-1 5 5 s=√s2 = √30 = 5.477 d) Find the coefficient of variation. cov=standard deviation*100=5.477*100 =22.82 mean 24 Exam Page 4 Suppose that you have a set of data that has a mean of 65 and a standard deviation of 10. a) Is the point 75 above, below, or the same as the mean. How many standard deviations is 75 from the mean. x*65 z=x-u= 75-65=1 o 10 z=1 The point 75 is above the mean (because it is a positive number), meaning that the data point is one standard deviation above the mean. b) Is the point 85 above, below, or the same as the mean. How many standard deviations is 85 from the mean. x*65 z=x-u= 85-65=2 o 10 z=2 The point 85 is above the mean (because it is a positive number), meaning that the data point is two standard deviations above the mean. c) Is the point 57.5 above, below, or the same as the mean. How many standard deviations is 57.5 from the mean. x*65 z=x-u= 57.5-65=-0.75 o 10 z=-0.75 The point 57.5 is below the mean (because it is a negative number), meaning that the data point is .75 standard deviations below the mean. d) Is the point 107 above, below, or the same as the mean. How many standard deviations is 107 from the mean. x*65 z=x-u= 107-65=4.2 o 10 z=4.2 The point 107 is above the mean (because it is a positive number), meaning that the data point is 4.2 standard deviations above the mean. Exam Page 5 Consider the following set of data: {22, 14, 35, 49, 8, 18, 30, 44} a) Find the median. {8,14,18,22,30,35,44,49} Median=22+30=26 26 b) Find the mode of this set. {8,14,18,22,30,35,44,49} No mode (no number appears more than once). Exam 3 Exam Page 1 Suppose A and B are two events with probabilities: P(A)=.35,P(Bc )=.45,P(A∩B)=.25. Find the following: a) P(A∪B). P(AUB)=P(A)+P(B)-P(AnB) P(Bc)=> P(B)=1-P(Bc)=1-.45=.55 P(AUB)=.35+.55-.25=0.65 b) P(Ac ). P(Ac)=> P(A)=1-P(Ac)=> P(Ac)=1-P(A)= 1-.35=.65 c) P(B). P(Bc)=> P(B)=1-P(Bc) P(B)=1-.45=.55 Exam Page 2 Suppose you are going to make a password that consists of 4 characters chosen from {2,7,8,c,f,k,t,z}. How many different passwords can you make if you cannot use any character more than once in each password? n=8 (only 8 characters to choose from) r=4 (four character passwords P(n,r)= n!= (n-r)! P(8,4)= 8!= 8! =8(7)(6)(5)=1680 different passwords 8-4! 4! Exam Page 3 Find the answer to each of the following by first reducing the fractions as much as possible: a) P(490,2)= P(n,r)=n! (n-r)! P(490,2)= 490! = 490!= 490(498)=244,020 (490-2)! 488! b) C(670,665)= C(n,r)= n! r!(n-r)! C(670,665)= 670! = 670! = 670(669)(668)(667)(666)=1,108,399,190,634 665!(670-665)! 665!5! 5(4)(3)(2)(1) -1.0 points Instructor Comments In (a) you multiplied by 498 instead of 489. Answer Key Exam Page 4 Suppose A and B are two events with probabilities: P(Ac )=.20,P(B)=.30,P(A∩B)=.20. a) What is (A│B) ? P(AlB)= P(AnB) = .20 =.666 P(B) .30 b) What is (B│A) ? P(Ac)= P(A)=1-P(Ac)=1-.20=.80 P(BlA)= P(AnB) = .20 =.25 P(A) .80 Exam Page 5 In a manufacturing plant, three machines A, B, and C produce 45 %, 35 %, and 20 %, respectively, of the total parts production. The company's quality control department determined that 1.5 % of the parts produced by machine A, 2 % of the parts produced by machine B, and 1 % of the parts produced by machine C are defective. If a part is selected at random and found to be defective, what is the probability that it was produced by machine A? Machine A=P(A) Machine B=P(B) Machine C=P(C) Def=P(Def) P(A)=.45, P(B)=.35, P(C)=.20 P(DeflA)=.015, P(DeflB)=.02. P(DeflC)=.01 P(AlDef)= P(A)*P(DeflA) = .45*.015 =0.4286 (P(A)*P(DeflA))+(P(B)*P(DeflB))+(P(C)*P(DeflC)) .45*.015+.35*.02+.20*.01 Exam Page 6 The probability that a certain type of battery in a smoke alarm will last 4 years or more is .65. The probability that a battery will last 7 years or more is .10. Suppose that the battery is 4 years old and is still working, what is the probability that the battery will last at least 7 years? P(E)=.65 P(F)=.10 (smoke alarm lasting more than 4 years) = E (smoke alarm lasting more than 7 years) = F If the smoke alarm has lasted 7 years, it would have lasted for 4 years already, so P(EnF)=.10 P(EnF)=.10 P(FlE)=P(EnF)=.10=.1538 P(E) .65 Exam Page 7 Suppose that 5 out of 11 people are to be chosen to go on a mission trip. In how many ways can these 5 be chosen if the order in which they are chosen is not important. n=11 r=5 C(n,r)= n! r!(n-r)! C(11,5)= 11! = 11(10)(9)(8)(7)(6)=2772 5!6! 5(4)(3)(2)(1) -1.0 points Instructor Comments You didn't need the 6 on top. It cancelled as part of the 6! on the bottom. Answer Key Exam 4 Exam Page 1 A factory has eight safety systems. During an emergency, the probability of any one of the safety systems failing is .08. What is the probability that six or more safety systems will fail during an emergency? For six failures: n=8, x=6, p=.08 f(x)= n! px(1-p)(n-x) = x!(n-x)! f(x)= 8! .086(1-.08)(8-6) =.000006209 6!(8-6)! For seven failures: n=8, x=7, p=.08 f(x)= n! px(1-p)(n-x) = x!(n-x)! f(x)= 8! .087(1-.08)(7-6) =.000000155 7!(8-7)! For eight failures: n=8, x=8, p=.08 f(x)= n! px(1-p)(n-x) = x!(n-x)! f(x)= 8! .088(1-.08)(8-8) =.000000002 8!(8-8)! The probability is: .000006209+.000000155+.000000002=.000006366 Instructor Comments The numbers are so small that with rounding your are fine. Answer Key Exam Page 2 Find each of the following probabilities: a. Find P(Z ≤ 1.27) . P(Z<1.27)=.89796 b. Find P(Z ≥ -.73) . P(Z>-.73)=1-P(Z<-.73)=1-.23270=.7673 c. Find P(-.09 ≤ Z ≤ .86). P(-.09<Z<.86)=P(Z<.86)-P(Z<-.09)=.80511-.46414=.34097 Exam Page 3 A company manufactures a large number of rods. The lengths of the rods are normally distributed with a mean length of 3.7 inches and a standard deviation of .35 inches. If you choose a rod at random, what is the probability that the rod you chose will be: a) Less than 3.5 inches? u= 3.7, o=.35, x=3.5 z=x-u= 3.5-3.7=-.57 o .35 P(Z<-.57)=.28434 b) Greater than 3.5 inches? u= 3.7, o=.35, x=3.5 z=x-u= 3.5-3.7=-.57 o .35 P(Z>-.57)=1-P(Z<-.57)=1-.28434=.71566 c) Between 3.4 inches and 4 inches? u= 3.7, o=.35, x=3.4 x=4 z=x-u= 3.4-3.7=-.86 z=x-u= 4-3.7=.86 o .35 o .35 P(-.86<Z<.86)=P(Z<.86)-P(Z<-.86)=.80511-.19489=.61022 Exam Page 4 A life insurance salesperson expects to sell between zero and five insurance policies per day. The probability of these is given as follows: Policies Sold Per Day Probability, f(x) 0 .04 1 .11 2 .23 3 .26 4 .19 5 .17 Find the expected number of insurance policies that the salesperson will sell per day. Also, find the variance and standard deviation of this data. E(x)=u=∑xf(x)= =0(.04)+1(.11)+2(.23)+3(.26)+4(.19)+5(.17)=2.96 The insurance salesperson can expect to sell 2.96 insurance policies per day. Variance: Var(x)=o2=∑(x-u)2f(x)= =(0-2.96)2(.04)+(1-2.96)2(.11)+(2-2.96)2(.23)+(3-2.96)2(.26)+(4-2.96)2(.19)+(5- 2.96)2(.17)=1.8984 Standard Deviation: o=√o2= o=√o2=√1.8984=1.3778 Exam Page 5 An archer is shooting arrows at a target. She hits the target 55% of the time. If she takes 14 shots at the target, what is the probability that she will hit the target exactly 7 times? n=14, x=7, p=.55 f(x)= 14! .557(1-.55)(14-7) =.286719357 14!(14-7)! -2.0 points Instructor Comments You can see in the Answer Key where you are off in the denominator, which throws your answer off. Answer Key Exam 5 Exam Page 1 Suppose that you take a sample of size 26 from a population that is not normally distributed. Can the sampling distribution of xx be approximated by a normal probability distribution? The sampling distribution of xx cannot be approximated by a normal probability distribution because if the population isn't normally distributed, the sample size has to be at least 30. Exam Page 2 Suppose that you are attempting to estimate the annual income of 1200 families. In order to use the infinite standard deviation formula, what sample size, n, should you use? n < 0.05= N n < 0.05= 1200 n < 0.05(1200) n < 60 Sample size must be less than 60. Exam Page 3 Suppose that in a large hospital system, that the average (mean) time that it takes for a nurse to take the temperature and blood pressure of a patient is 175 seconds with a standard deviation of 50 seconds. What is the probability that 35 nurses selected at random will have a mean time of 160 seconds or less to take the temperature and blood pressure of a patient? u=175, o=50, n=35, xx=160 oxx= o √n oxx= 50 = 8.4515 √35 z=xx-u= oxx z=xx-u=160-175= -1.77 oxx 8.4515 P(Z<-1.77)=.03836 Exam Page 4 Suppose that in a very large city 7.2 % of the people have more than two jobs. Suppose that you take a random sample of 80 people in that city, what is the probability that 7 % or less of the 80 have more than two jobs? . -2.0 points Instructor Comments In your calculation of the standard deviation, you didn't get the square root. That throws the rest of your calculations off. Answer Key Exam 6 Exam Page 1 A new drug is introduced that is supposed to reduce fevers. Tests are done with the drug. The drug is given to 70 people who have fevers. It is found that the mean time that it takes for the fever to get back to normal for this test group is 400 minutes with a standard deviation of 85 minutes. Find the 95% confidence interval for the mean time that the drug will take to reduce all fevers for all people. Case 1: Large population and large sample size n=70 xx=400 s=85 z=1.96 xx-z s <u< xx+z s √n √n 400-1.96 85 <u<400+1.96 85 √70 √70 380.0875<u<419.9125 Exam Page 2 A certain school has 380 male students. The school nurse would like to know how many calories the male students consume per day. So, she samples 65 male students and finds that the mean calorie consumption of the 65 is 1950 calories per day with a standard deviation of 200 calories per day. Find the 95 % confidence interval for mean calorie intake of all the male students in the school. Case 3: Finite population N=300 n=65 xx=1950 s=200 z=1.96 xx-z s √N-n<u< xx+z s √N-n √n √N-1 √n √N-1 1950-1.96 200 √ 300-65<u<1950+1.96 200 √ 300-65 √65 √300-1 √65 √ 300-1 1906.895<u<1993.105 -2.0 points Instructor Comments 1950-1.96 200 √ 300-65<u<1950+1.96 200 √ 300-65 √65 √300-1 √65 √ 300-1 300 should be 380. Answer Key Exam Page 3 In a large city, the city supervisor wants to find the average number of aluminum cans that each family recycles per month. So, she surveys 21 families and finds that these 21 families recycle an average of 160 cans per month with a standard deviation of 45 cans per month. Find the 90 % confidence interval for the mean number of cans that all of the families in the city recycle per month. Case 2: Large population and small sample size n=21 xx=160 s=45 t=1.725 xx±t s √n 160±1.725 45 √21 160±16.9392 143.0608<u<176.9392 Exam Page 4 df=n-1=21-1=20 A doctor has a large number of patients and would like to know if his patients prefer to fill in forms electronically or prefer to hand write their forms. So, he surveys 95 patients and finds that 53 prefer electronic forms while 42 prefer hand written forms. Find the 95% confidence limit for the proportion of all patients that prefer the electronic forms. Case 1: P/p=p/n=53/95=.56 n=95 z=1.96 P± z √p(1-p) √n .56± 1.96 √.56(1-.56) √95 .56±.1 .46 to .66 Exam Page 5 A shipment of 400 new blood pressure monitors have arrived. Tests are done on 55 of the new monitors and it is found that 10 of the 55 give incorrect blood pressure readings. Find the 90% confidence interval for the proportion of all the monitors that give incorrect readings. Case 2: P/p=p/n=10/55=.182 n=55 N= 400 z=1.645 P± z √p(1-p) √N-n √n √N-1 .182± 1.645 √.182(1-.182) √400-55 √55 √400-1 .182±.06191 0.12009 to 0.24391 -2.0 points Instructor Comments You have a math error in your calculation. You can see in the Answer key that the value past the ± should be 0.079587 (or round to 0.08). Answer Key Exam 7 Exam Page 1 a) Define the null and alternative hypothesis for the following. Also, explain what it would mean to make a Type I error and explain what it would mean to make a Type II error. The newspaper in a certain city had a circulation of 18,000 per day in 2010. You believe that the newspaper’s circulation is different than 18,000 today. H0=18,000 circulations. H1≠18,000 circulations. Type I Error: Reject the null hypothesis that the mean number of newspaper circulations is 18,000 per day when the mean number of newspaper circulations is 18,000 per day. Type II Error: Do not reject the null hypothesis that the mean number of newspaper circulations is 18,000 per day when the mean number of newspaper circulations is different from 18,000 per day. b) Define the null and alternative hypothesis for the following. Also, explain what it would mean to make a Type I error and explain what it would mean to make a Type II error. A certain website had 5000 hits per month a year ago. You believe that the number of hits per month is more than that today. H0=5,000 hits. H1>5,000 hits. Type I Error: Reject the null hypothesis that the mean number of website hits is 5000 per month when the mean number of website hits is not greater than 5000 per month. Type II Error: Do not reject the null hypothesis that the mean number of website hits is 5000 per month when the mean number of website hits is greater than 5000 per month. Exam Page 2 Suppose that we have a problem for which the null and alternative hypothesis are given by: H0: μ=959. H1:μ <959. Is this a right-tailed test, left-tailed test, or two-tailed test. Find the z value based on a level of significance of .13. This is a left tailed test. H0:u=959. H1:u<959. Left tailed test: P(Z<z)=a P(Z<z)=.13 z=-1.125 Exam Page 3 It is recommended that pregnant women over eighteen years old get 85 milligrams of vitamin C each day. A doctor is concerned that her pregnant patients are not getting enough vitamin C. So, she collects data on 52 of her patients and finds that the mean vitamin intake of these 52 patients is 76 milligrams per day with a standard deviation of 22 milligrams per day. Based on a level of significance of α = .001, test the hypothesis. H0:u=85. H1:u<85. Left tailed test: P(Z<z)=a P(Z<z)=.001 z=-3.09 a=.001, u=85, o=22, x-=76 n=52 z-score: o -= o = 22 =3.051 √n √52 z=x--u= 76-85=-2.94985 o - 3.051 Do not reject the null hypothesis (z-score is greater than -3.09). Exam Page 4 A mayor claims that the unemployment rate in his city is 5 %. Many people think that the unemployment rate is higher. So, 130 residents of the city are contacted and it is found that 11 of them are unemployed. Can the mayor’s claim be supported to a level of significance of α = .03, test the hypothesis. H0:p=.05. H1:p>.05. Right tailed test; P(Z>z)=a P(Z>z)=.03 z=1.88 a=.03, p=.05, n=130 x-=11 z-score: u=np u=np=130(.05)=6.5 os=√np(1-p) os=√130(.05)(1-.05)=2.48495 z score=x--u= 11-6.5 =1.8109 os 2.48495 We do not reject the null hypothesis (z score is less than 1.88). Exam 8 Exam Page 1 Suppose we have independent random samples of size n1 = 570 and n2 = 675. The proportions of success in the two samples are p1= .41 and p2 = .53. Find the 99% confidence interval for the difference in the two population proportions. n1 = 570, n2 = 675, p1= .41, p2 = .53, z=2.58 P1-P2±z√p1(1-p1) + p2(1-p2) n1 n2 .41-.53±2.58√.41(1-.41) + .53(1-.53) 570 675 -.12±2.58(.0281678) -.12± .072673 The confidence interval is (-.047327,-.192673). Instructor Comments You have your confidence interval written backwards. Answer Key So, the interval is (-.1927,-.0473). Exam Page 2 In certain hospital, nurses are required to constantly make rounds to check in on all of the patients. The nursing supervisor would like to know if there is a difference between the number of rounds completed per shift by the nurses on the day shift compared to the nurses on the night shift. So, the nursing supervisor checks the records of 77 day shift nurses and finds that they complete an average (a mean) of 32 rounds per shift with a standard deviation of 4.1 rounds per shift. The nursing supervisor also checks the records of 72 night shift nurses and finds that they complete an average (a mean) of 26 rounds per shift with a standard deviation of 6.3 rounds per shift. a) Find the 95% confidence interval for estimating the difference in the population means (µ1 - µ2). b) Can you be 95% confident that there is a difference in the means of the two populations? a) z=1.96 n1=77, n2=72, x- 32, x- =26 s1=4.1 s2=6.3 (x- -x- )-z√s 2 +s 2+<u -u <(x- -x-2)+z√s 2 +s 2 n1 n2 n1 n2 (32-26)-1.96√4.12 + 6.32 +<u1-u2< (32-26)+1.96√4.12 + 6.32 77 72 77 72 6±1.7194 4.2806<u1-u2<7.7194 b) Yes we can be 95% confident due to the fact that both values cover positive values (confidence intervals are both positive). Exam Page 3 A head librarian supervises a number of libraries in a large county. He wants to know if full-time library workers and part-time library workers re-shelve books at the same rate. So, he checks the records of 42 full-time library workers and finds that they re-shelve an average of 113 books per hour with a standard deviation of 8.1 books per hour. The records of 42 part-time library show that they re-shelve an average of 110 books per hour with a standard deviation of 10.1 books per hour. Using a level of significance of α=.05, is there enough evidence to indicate a difference in the mean number of books re-shelved by full-time workers compared to part-time workers? H0:u1-u2=0 H1:u1-u2≠0 Two Tailed Test: a=.05 P(Z<z)=a/2 P(Z>z)=a/2 P(Z<z)=.05/2=.025 P(Z>z)=a/2=.05/2=.025 z=-1.96 and z=1.96 Z-Score: z=(x- -x- )-0 √s12 + s 2 √ n1 n2 z=(113-110)-0 √8.12 + 10.12 √ 42 42 z=3/1.9978 z=1.5017. The z-score is between -1.96 and 1.96 so we do not reject the null hypothesis. There is no difference in the mean number of books re-shelved by full time and part time workers. Exam Page 4 Consider the following dependent random samples Observations 1 2 3 4 5 6 x-values 155 140 142 159 162 169 y-values 169 150 151 145 173 180 a) Determine the difference between each set of points, xi - yi b) Do hypothesis testing to see if µd < 0 at the α = .05. a) d-=d1+d2...dn=-14-10-9+14-11-11=-6.833 n 6 b) H0:ud=0 H1:ud<0 Left Tailed test (do not forget to switch t to a negative) n=6, DOF=n-1=6-1=5 t.05=2.571-->-2.571, d-=-6.833, sd=10.34 sd =√∑(d1-d-)2=10.34 √ n-1 t= d- (sd/√n) t= -6.833 =-6.833/4.22=-1.619 (10.34/√6) We do not reject that null hypothesis due to the fact that t is not less than -t.05 (because -1.619>-2.571). Exam Page 5 A new energy drink is supposed to improve a person’s time in the one mile run. The times, in seconds, of eight runners with and without the drink are given below: Runner 1 2 3 4 5 6 7 8 x-time (before) 260 273 266 265 261 247 268 271 y-time (after) 263 270 280 279 266 242 263 259 Find the 98 % confidence interval for mean of the differences, µd. DOF=n-1 DOF=8-1=7 df=7 so t=2.998 d-=-1.375 sd=9.365 d-=d1+d2...dn=-3+3-14-14-5+5+5+12 =-1.375 n 8 -5.0 points Instructor Comments You did not complete the problem. Answer Key Runner 1 2 3 4 5 6 7 8 x-time (before) 260 273 266 265 261 247 268 271 y-time (after) 263 270 280 279 266 242 263 259 Exam 9 Exam Page 1 Suppose you have 14 data points and you calculate the sample correlation coefficient and find that r = - .58. Can you be 95% confident that a linear relation exists between the variables? If so, is the relation positive or negative? Justify you answer. n=14, r=-.58, 95% confident? CVCC=.53241 We can be 95% confident that a negative linear relation exists (because the original r is negative) between the variables due to the fact that the absolute of r is │r│=.58 and is greater than .53241 (which we can find on the critical values chart). Exam Page 2 Suppose you have 40 data points and you calculate the sample correlation coefficient and find that r = - .30. Can you be 95% confident that a linear relation exists between the variables? If so, is the relation positive or negative? Justify you answer. n=40, r=-.30, 95% confident? CVCC=.31201 We can be 95% confident that a no relation exists between the variables due to the fact that the absolute of r is │r│=.30 and is less than .31201 (which we can find on the critical values chart). Exam Page 3 Compute the sample correlation coefficient for the following data: Can you be 95% confident that a linear relation exists between the variables? If so, is the relation positive or negative? Justify you answer. n=5 x-=2+3+7+9+12=6.6 5 y-=3+6+10+14+17=10 5 s 2=∑(x-x-)2= (2-6.6)2+(3-6.6)2+(7-6.6)2+(9-6.6)2+(12-6.6)2=17.3 n-1 5-1 sx=√s 2=√17.3=4.16 s 2=∑(y-y-)2= (3-10)2+(6-10)2+(10-10)2+(14-10)2+(17-10)2=32.5 n-1 5-1 sy=√s 2=√32.5=5.7 r=∑(xi-x-)2(yi-y-)2 sx sy n-1 r=(2-6.6)(3-10)+(3-6.6)(6-10)+(7-6.6)(10-10)+(9-6.6)(14-10)+(12-6.6)(17-10) ( 4.16) (5.7) (4.16) (5.7) (4.16) (5.7 ) ( 4.16) (5.7) ( 4.16 ) (5.7)=3.96074=.99. 5-1 4 n=5, Confidence=95%?, r=.99, CVCC=.87834 Absolute of r is │r│= .99 and is greater than .87834 so a positive linear relation exists. Exam Page 4 Find the best fit line for the following data: n=5 x-=1+2+5+7+9=4.8 5 y-=15+12+11+9+7=10.8 5 s 2=∑(x -x-)2= (1-4.8)2+(2-4.8)2+(5-4.8)2+(7-4.8)2+(9-4.8)2=11.2 n-1 5-1 sx=√s 2=√11.2=3.35 s 2=∑(y -y-)2= (15-10.8)2+(12-10.8)2+(11-10.8)2+(9-10.8)2+(7-10.8)2=9.2 n-1 5-1 sy=√s 2=√9.2=3.03 r=∑(xi-x-)2(yi-y-)2 sx sy n-1 r=(1-4.8)(15-10.8)+(2-4.8)(12-10.8)+(5-4.8)(11-10.8)+(7-4.8)(9-10.8)+(9-4.8)(7-10.8) ( 3.35) (3.03) (3.35) (3.03) (3.35) (3.03 ) ( 3.35) (3.03) ( 3.35 ) (3.03)=- 3.8561=-.964. 5-1 4 n=5, Confidence=95%?, r=-.964, CVCC=.87834 Absolute of r is │r│= .964 and is greater than .87834 so a negative (because original r was negative) linear relation exists. x-=4.8, y-=10.8, Sx=3.35, Sy=3.03, r=-.964 Slope: m=r Sy= -.964 3.03=-.873 Sx 3.35 Y intercept: b=y--mx-=10.8-(-.873)(4.8)=14.99 Line Equation: y=mx+b y=-.873x+14.99 Exam 10 Exam Page 1 Find the value of X2 for 13 degrees of freedom and an area of .100 in the right tail of the chi- square distribution. X2=19.812. Exam Page 2 Find the value of X2 for 17 degrees of freedom and an area of .050 in the left tail of the chi- square distribution. a=1-.050=.95 X2=8.672. Exam Page 3 Find the value of X2 values that separate the middle 80 % from the rest of the distribution for 17 degrees of freedom. a=1-.80=.20/2=.10 in each of the tails. Area to right of first X2=.80+.10=.90 X2=10.085. Area to right of second X2=.10 X2=24.769. Exam Page 4 Find the critical value of F for DOF=(6,18) and area in the right tail of .01. F=4.01 Numerator= 6, Denominator=18 <---Look up in F Distribution Table in the right tail of .01. Exam Page 5 The mayor of a large city claims that 30 % of the families in the city earn more than $ 100,000 per year; 52 % earn between $ 30,000 and $ 100,000 (inclusive); 18 % earn less than $ 30,000 per year. In order to test the mayor’s claim, 285 families from the city are surveyed and it is found that: 90 of the families earn more than $ 100,000 per year; 135 of the families earn between $ 30,000 and $ 100,000 per year (inclusive); 60 of the families earn less $ 30,000. Test the mayor’s claim based on 5 % significance level. H0: The mayor's claim is correct. H1: The mayor's claim is not correct. More than two possible outcomes: Multinomial experiment-we use the Chi-Square chart here. DOF=3-1=2, Level of Significance=5%=.05 Chi Square=5.991 Expected frequencies= Ei=npi n=285 Earn more than $100,000 per year E1= 285(.30)=85.5 Earn between $ 30,000 and $ 100,000 per year E2=285(.52)=148.2 Earn less than $ 30,0001941 to 1970 E3=285(.18)=51.3 Observed Frequencies: Earn more than $100,000 per year=90 Earn between $ 30,000 and $ 100,000 per year=135 Earn less than $ 30,000=60 Test Statistics Calculation: X2=∑(Oi-Ei-)2=(90-85.5)2+(135-148.2)2+(60-51.3)2= 2.888. Ei 85.5 148.2 51.3 X2 is smaller than the critical value of 5.991 so we do not reject the null hypothesis. Exam Page 6 A trucking company wants to find out if their drivers are still alert after driving long hours. So, they give a test for alertness to two groups of drivers. They give the test to 475 drivers who have just finished driving 4 hours or less and they give the test to 635 drivers who have just finished driving 8 hours or more. The results of the tests are given below. Passed Failed Drove 4 hours or less 365 110 Drove 8 hours or more 440 195 Is there is a relationship between hours of driving and alertness? (Do a test for independence.) Test at the .5 % level of significance. H0: There is a relationship between hours of driving and alertness. H1: There is not a relationship between hours of driving and alertness. # of Rows= 2, # of Columns=2 DOF=(# of rows-1)(# of columns-1)=(2-1)(2-1)=1 LOS=.005 CSCV=7.879 Passed Failed Row Totals Drove 4 hours or less 365 110 475 Drove 8 hours or more 440 195 635 Column Totals 805 305 1110 Expected Values Calculation: Eij= (TRi)(TCj) Total number in sample E for drove 4 hours or less and Passed E11=(475)(805)/1110=344.48 E for drove 4 hours or less and Failed E12=(475)(305)/1110=130.52 E for drove 8 hours or more and Passed E21=(635)(805)/1110=460.52 E for drove 8 hours or more and Failed E22=(635)(305)/1110=174.48 X2=∑ (Oij-Eij)2= (365-344.48)2+(110-130.52)2+(440-460.52)2+(195-174.48)2=7.776 Eij 344.48 130.52 460.52 174.48 X2 is less than the CV of 7.879 so we do not reject the null hypothesis. -1.0 points Instructor Comments Your null and alternative hypotheses are switched. The calculations are correct. Answer Key Passed Failed Drove 4 hours or less 365 110 Drove 8 hours or more 440 195 [Show More]
Last updated: 1 year ago
Preview 1 out of 34 pages
Instant download
Buy this document to get the full access instantly
Instant Download Access after purchase
Add to cartInstant download
Also available in bundle (1)

MATH 110 Module 1-10 Exams and FINAL EXAM BUNDLE (LATEST) - Portage Learning | Download To Score A.
MATH 110 Module 1-10 Exams and FINAL EXAM BUNDLE (LATEST) - Portage Learning | Download To Score A.
By A+ Solutions 2 years ago
$14.5
12
Reviews( 0 )
Document information
Connected school, study & course
About the document
Uploaded On
Aug 23, 2021
Number of pages
34
Written in

Additional information
This document has been written for:
Uploaded
Aug 23, 2021
Downloads
0
Views
58

.png)