Mathematics > EXAM > MATH 534 Week 7 Course Project Part C: Regression and Correlation Analysis (Summer 2019) (All)
MATH 534 Week 7 Course Project Part C: Regression and Correlation Analysis (Summer 2019)
Document Content and Description Below
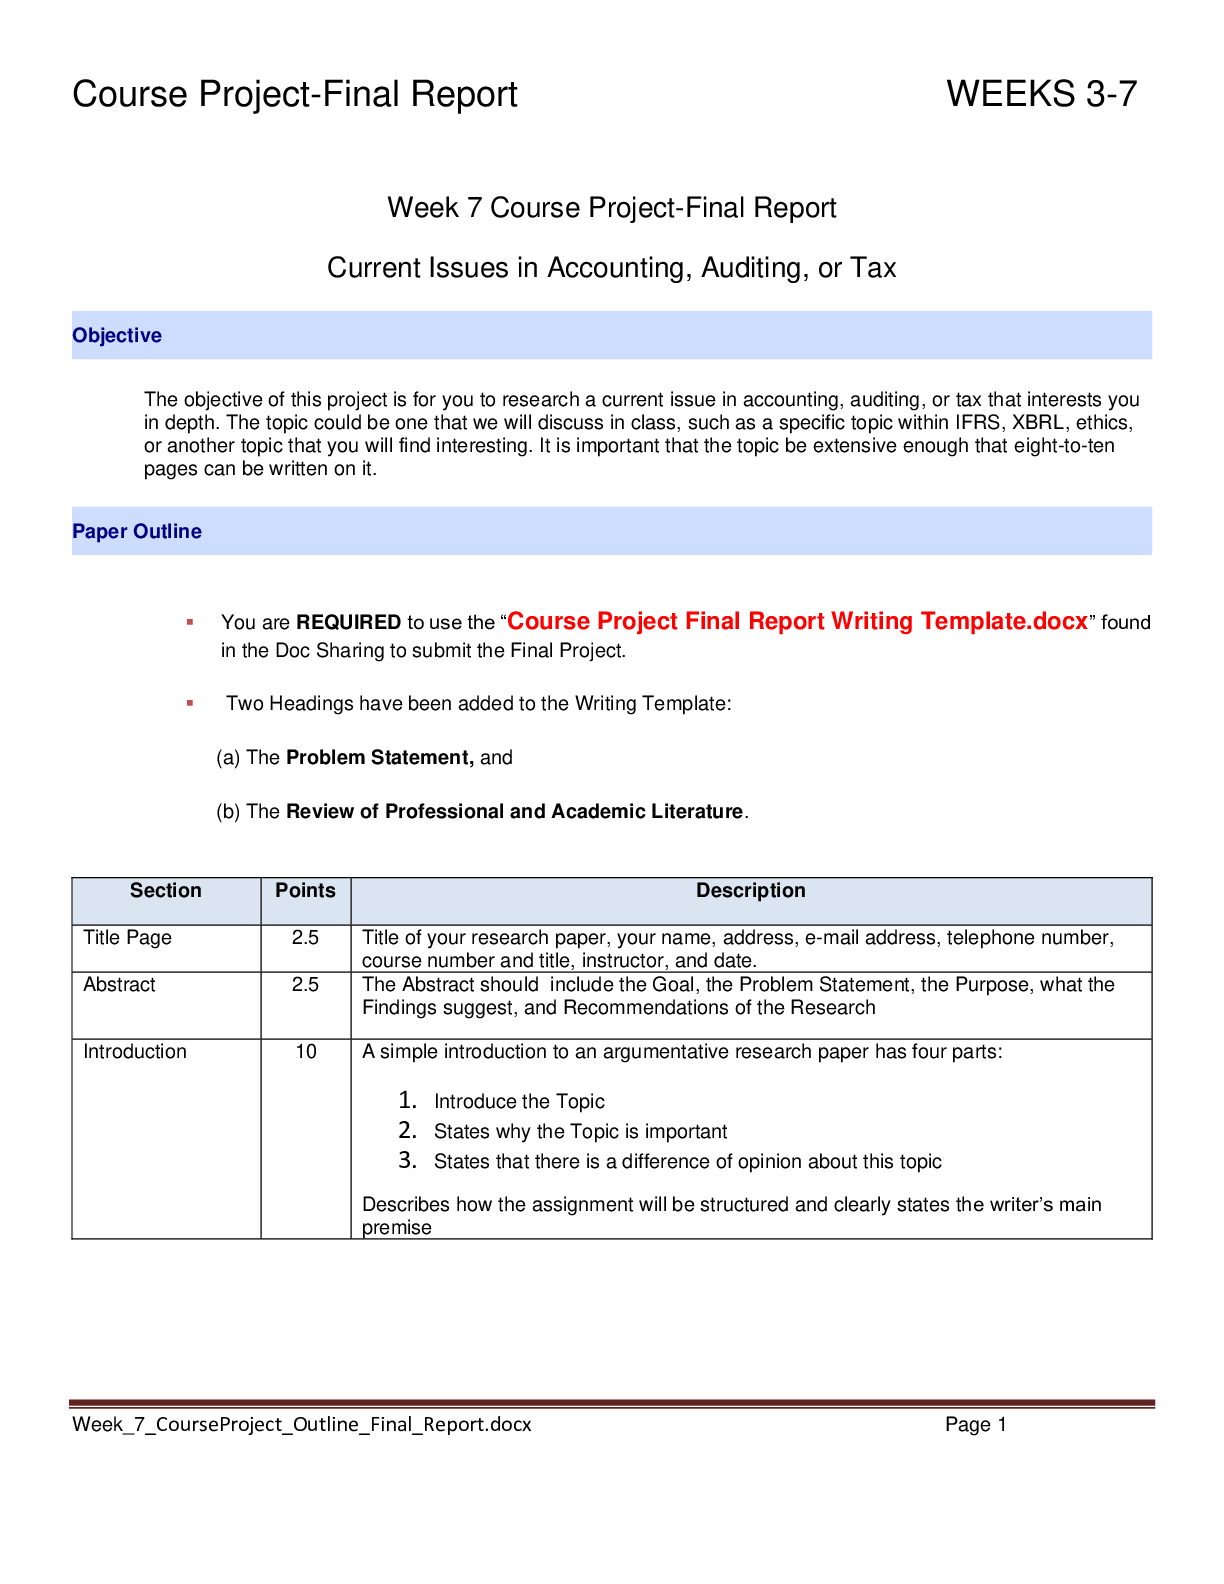
Table of Contents Summary Report Sales is the driving force behind any economy, no matter where on the planet one resides. Therefore, in most businesses, it is pertinent to the success and lifespa... n of the company to track the number of sales. In this analysis, we chose three independent variables to produce a model that would be able to predict the number of sales in a given equation. Assuming the population mean to be unknown, we collected a random sample of 100 data points of sales with respect the number of calls made, the average time per call, and the years of experience in this call center. This regression analysis served to further support the old adage that sales……..continue Appendix Generate a scatterplot for the specified dependent variable (Y) and the X1 independent variable, including the graph of the “best fit” line. Interpret……..continue [Show More]
Last updated: 1 year ago
Preview 1 out of 10 pages
Instant download

Buy this document to get the full access instantly
Instant Download Access after purchase
Add to cartInstant download
Reviews( 0 )
Document information
Connected school, study & course
About the document
Uploaded On
Sep 09, 2021
Number of pages
10
Written in

Additional information
This document has been written for:
Uploaded
Sep 09, 2021
Downloads
0
Views
36


.png)