Statistics > EXAM > MATH 1280 Self-Quiz Unit 3 (100%) – University of the People | MATH1280 Self-Quiz Unit 3 (100%) wi (All)
MATH 1280 Self-Quiz Unit 3 (100%) – University of the People | MATH1280 Self-Quiz Unit 3 (100%) with Rationale
Document Content and Description Below
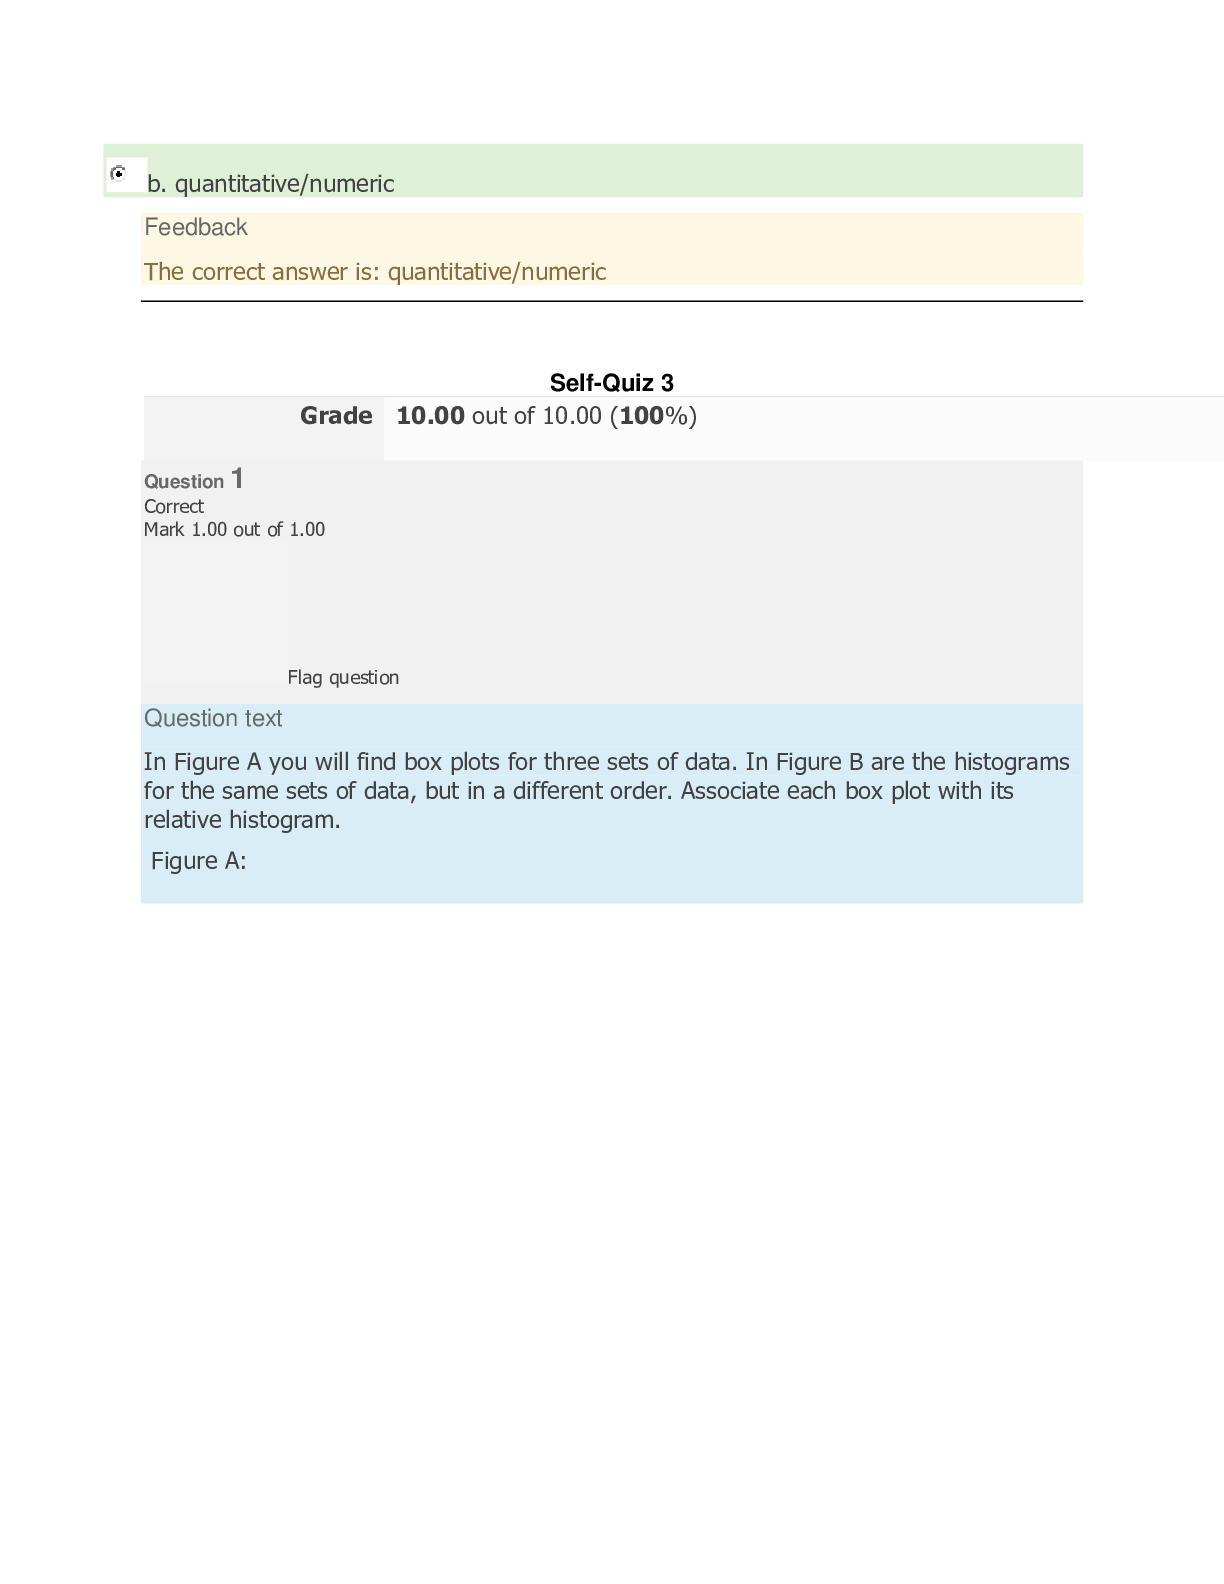
MATH 1280 Self-Quiz Unit 3 (100%) – University of the People Grade 10.00 out of 10.00 (100%) Top of Form Question 1 Correct Question text In Figure A you will find box plots for three ... sets of data. In Figure B are the histograms for the same sets of data, but in a different order. Associate each box plot with its relative histogram. Figure A: Figure B: Box plot 1 Answer 1 Box plot 2 Answer 2 Box plot 3 Answer 3 Feedback Question 2 Correct Question text Consider the box plots in Figure A. Which of the data has a smaller inter-quartile range (IQR)? Figure A Select one: a. Box plot 1 b. Box plot 2 c. Box plot 3 d. Cannot tell based on the box plots. InformationFlag question Information text For the next 3 question deal with the following data: 11.9, 11.0, 12.4, 16.9, 16.3, 13.3, 9.1, 17.0, 11.0, 9.3, 25.3, 17.4, 17.4 Question 3 Correct Question text The median is equal to: Select one: a. 9.1 b. 13.3 c. 14.8 d. Cannot tell based on the given information. Feedback Question 4 Correct Question text The largest value in the data is an outlier: Select one: a. True b. False c. Cannot tell based on the given information. Feedback Question 5 Correct Question text The smallest value in the data is an outlier: Select one: a. True b. False c. Cannot tell based on the given information. Feedback Question 6 Correct Question text Create an R data frame with the name "ex.2" that contains the data in the file "ex2.csv" (Select the file name to download it). Compute the standard deviation of each of the numeric variables. Among the following, the variable with the largest standard deviation is: Select one: a. age b. bmi c. systolic d. diastolic Information Flag question Information text Twenty-one randomly selected students were asked the number of pairs of sneakers they owned. The number of pairs of sneakers owned by each student was recorded in an R object by the name "x". The frequency table of the data "x" is: > table(x) x 1 2 3 4 5 6 4 7 3 3 2 2 Based on this table compute: Question 7 Correct Question text The sample mean () is Answer: Feedback Question 8 Correct Question text The sample standard deviation (s) is Answer: Feedback Run the code: > x.val <- c(1,2,3,4,5,6) > freq <- c(4,7,3,3,2,2) > rel.freq <- freq/sum(freq) > x.bar <- sum(x.val*rel.freq) > var.x <- sum((x.val-x.bar)^2*freq)/(sum(freq)-1) > sqrt(var.x) [1] 1.609496 The correct answer is: 1.609496 Question 9 Correct Question text The first quartile (Q1) is Answer: Feedback Run the code: > x.val <- c(1,2,3,4,5,6) > freq <- c(4,7,3,3,2,2) > rel.freq <- freq/sum(freq) > data.frame(x.val,cumsum(rel.freq)) x.val cumsum.rel.freq. 1 1 0.1904762 2 2 0.5238095 3 3 0.6666667 4 4 0.8095238 5 5 0.9047619 6 6 1.0000000Observe that more than 25% of the distribution has accumulated at value "2" but less than that at value "1". The correct answer is: 2 Question 10 Correct Question text The median is Answer: Feedback Question 11 Correct Question text The third quartile (Q3) is Answer: Feedback "3". Question 12 Correct Question text The distribution is skewed to the left? (True or False) Answer: Feedback Question 13 Correct Question text The relative frequency of the students that owned more than one but less than 5 sneakers is is Answer: Feedback Information Flag question Information text Following are the possible weights (in pounds) of some football team members. 232, 251, 257, 268, 238, 222, 265, 263, 252, 246, 253, 248, 256, 248, 230, 219, 224, 267, 259, 254, 254, 261, 248, 221, 252, 269, 269, 273, 273, 259, 251, 222, 248, 224 Question 14 Correct Question text The sample mean () is Answer: Feedback Question 15 Correct Question text The sample standard deviation (s) is Answer: Feedback Question 16 Correct Question text The first quartile (Q1) is Answer: Feedback Question 17 Correct Question text The median is Answer: Feedback Question 18 Correct Question text The third quartile (Q3) is Answer: Feedback Question 19 Correct Question text The USC quarterback Matt Barkley weighed 220 pounds in the spring of 2010. How many standard deviations above or below the mean was he in comparison to the data given above? (Give the answer in the format x.xxx, without the plus/minus sign) Answer: Question 20 Correct Question text The following frequency table shows the lengths of 42 international phone calls using a $5 prepaid calling card. The data was stored in an object by the name "x": x 4 14 24 34 44 54 2 6 13 13 6 2 Using the data, and without computing the mean and the median, determine which ONE of the answers is correct: Select one: a. The mean and the median are equal. b. The mean is smaller than the median. c. The mean is larger than the median. Feedback Question 21 Correct Question text Consider the following data set: 4, 6, 6, 12, 18, 18, 18, 200. What value is (approximately) 0.75 standard deviations below the mean? Select one: a. There is not enough information b. Approximately -15 c. Approximately 4 d. Approximately 34.5 Feedback Bottom of Form [Show More]
Last updated: 1 year ago
Preview 1 out of 14 pages
 – University of the People.png)
Reviews( 2 )

by Korso · 3 years ago
Thanks for the rating and feedback. by Martin Freeman. 3 years ago

by Martin Freeman · 3 years ago
Document information
Connected school, study & course
About the document
Uploaded On
Sep 14, 2020
Number of pages
14
Written in
Additional information
This document has been written for:
Uploaded
Sep 14, 2020
Downloads
1
Views
405





 – CHAMBERLAIN COLLEGE OF NURSING.png)
