Mathematics > EXAM > MAT 300 Foundations of statistics Sophia Final Milestone 2020/2021 Questions/Answers With Rationale (All)
MAT 300 Foundations of statistics Sophia Final Milestone 2020/2021 Questions/Answers With Rationale Strayer University
Document Content and Description Below
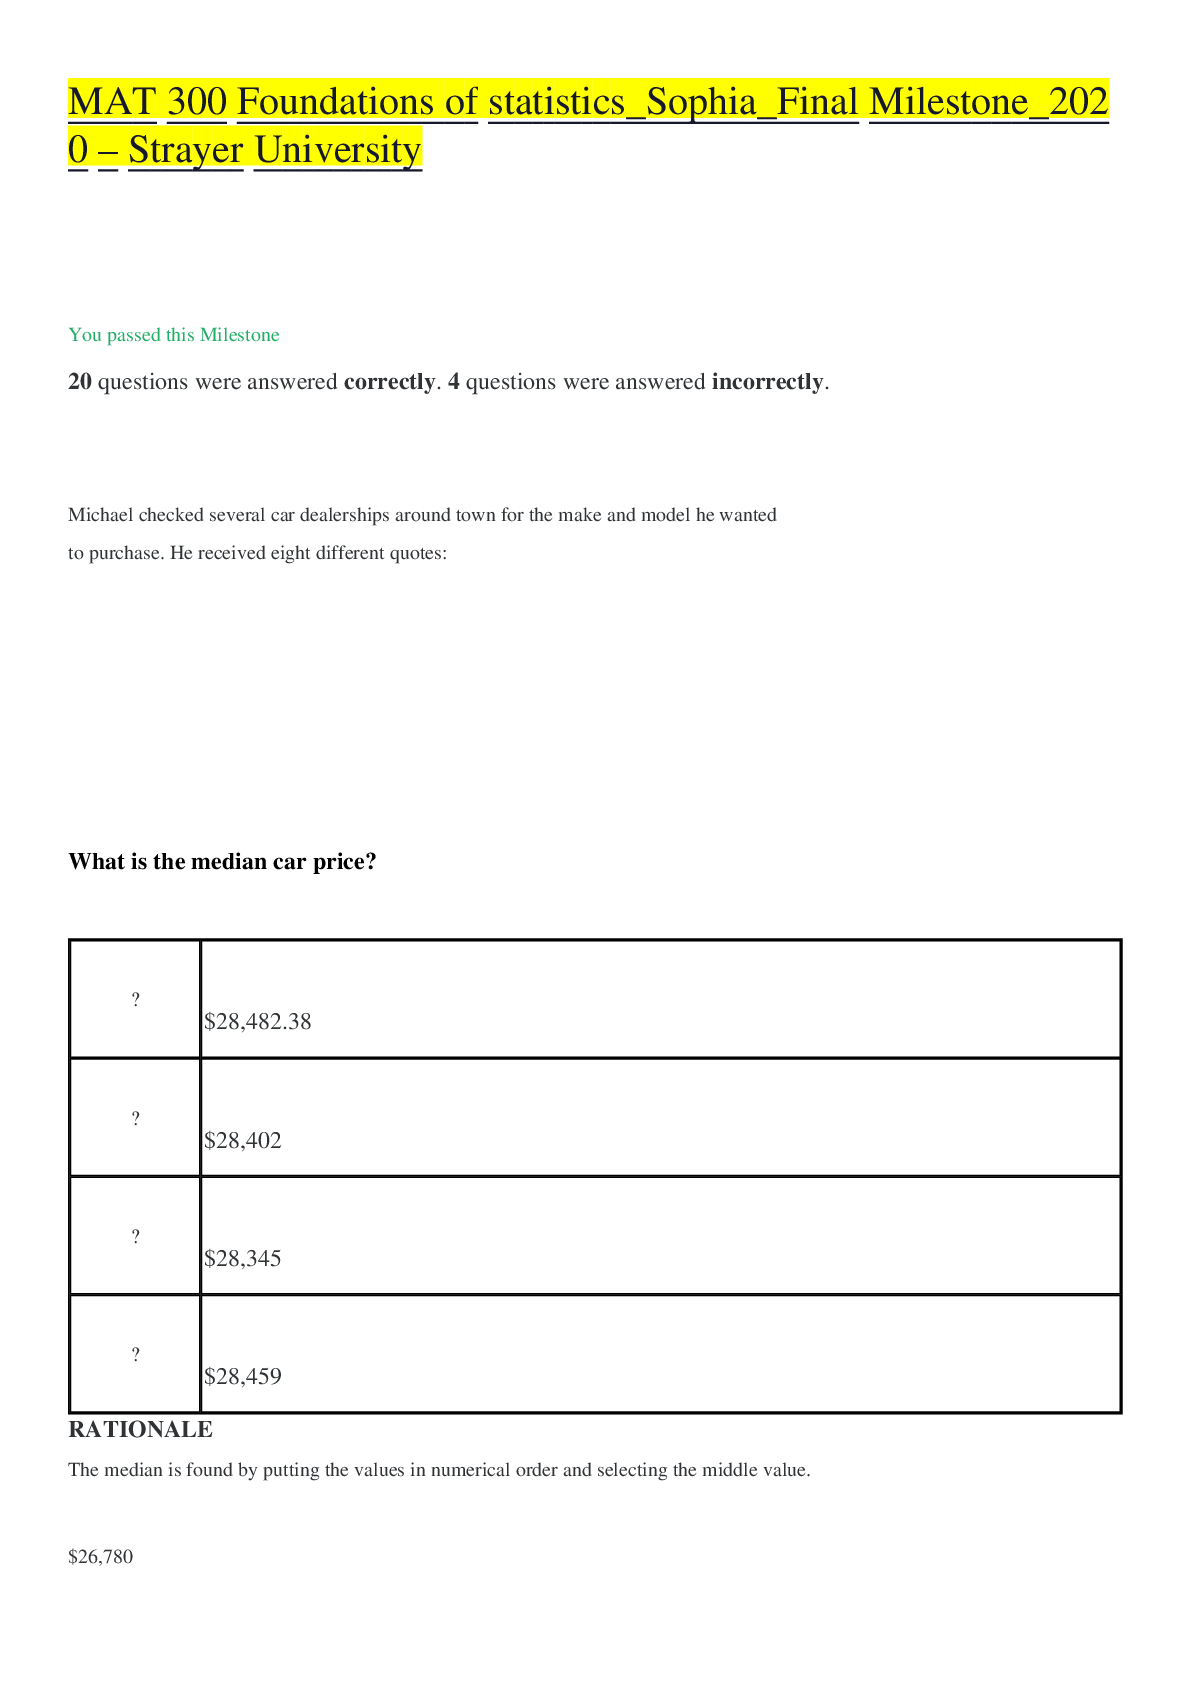
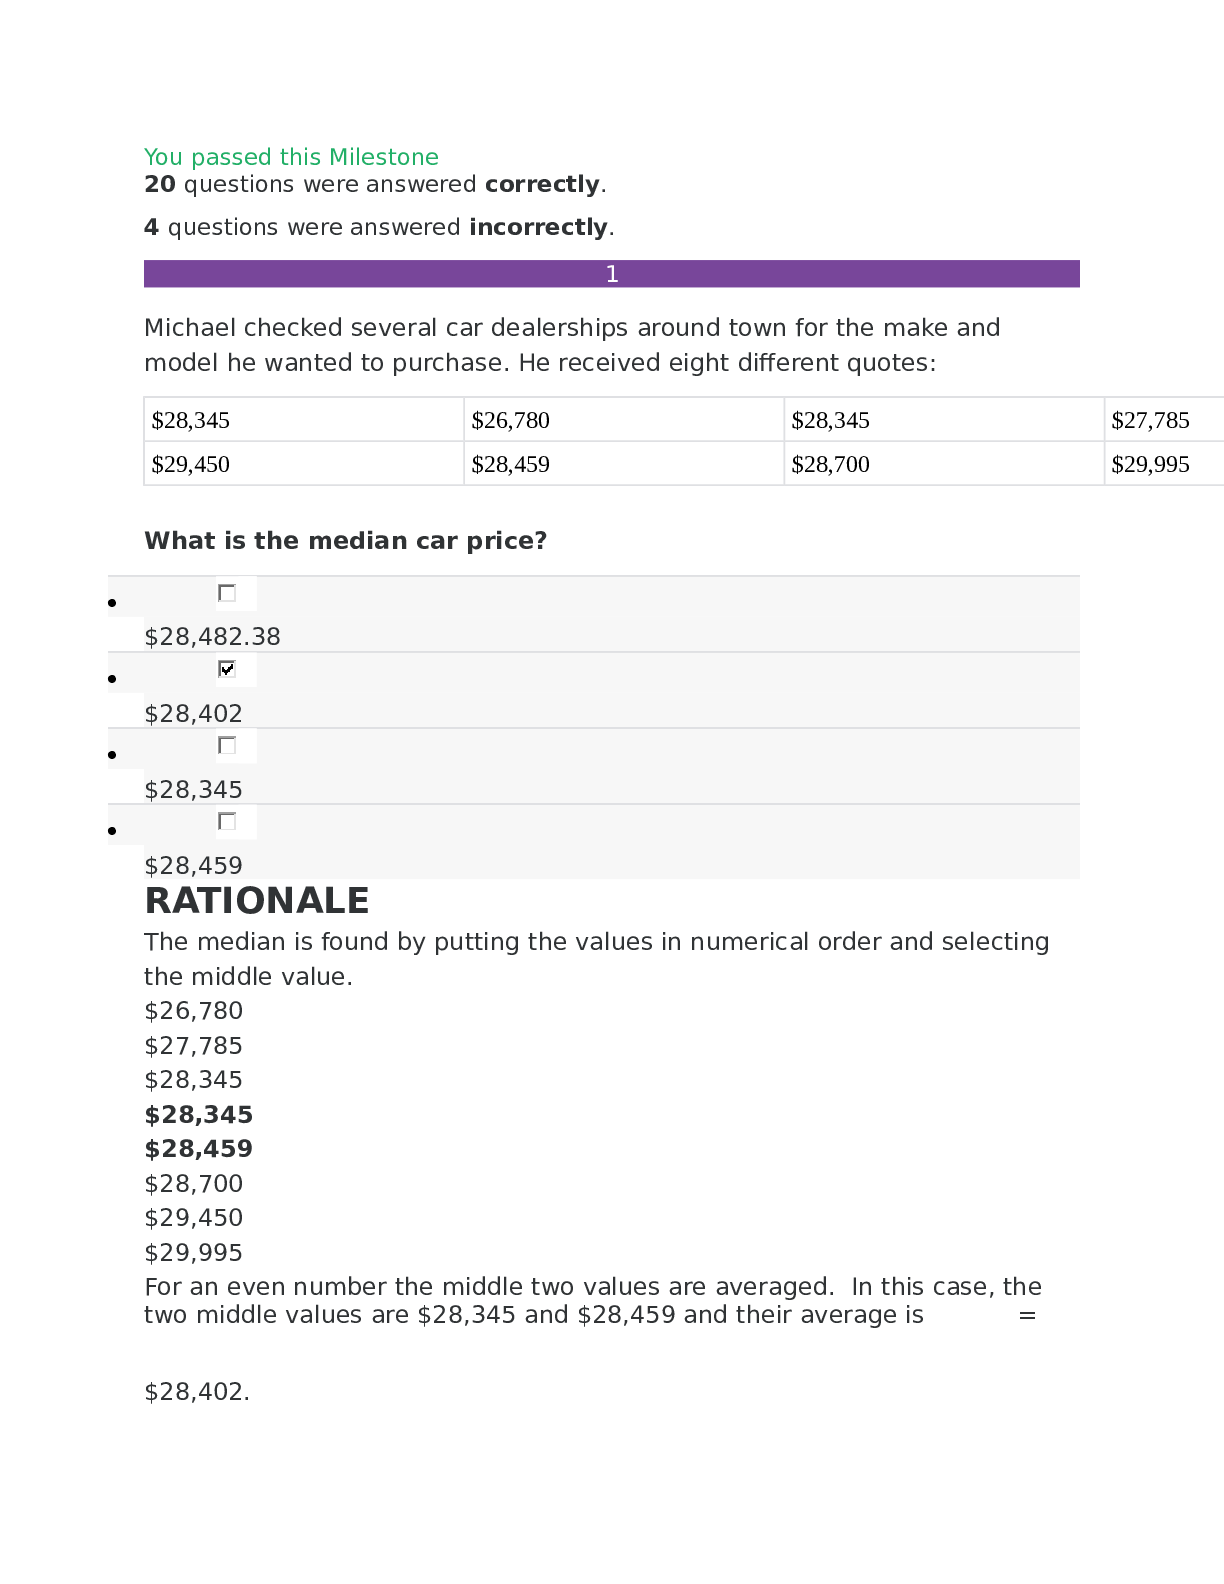
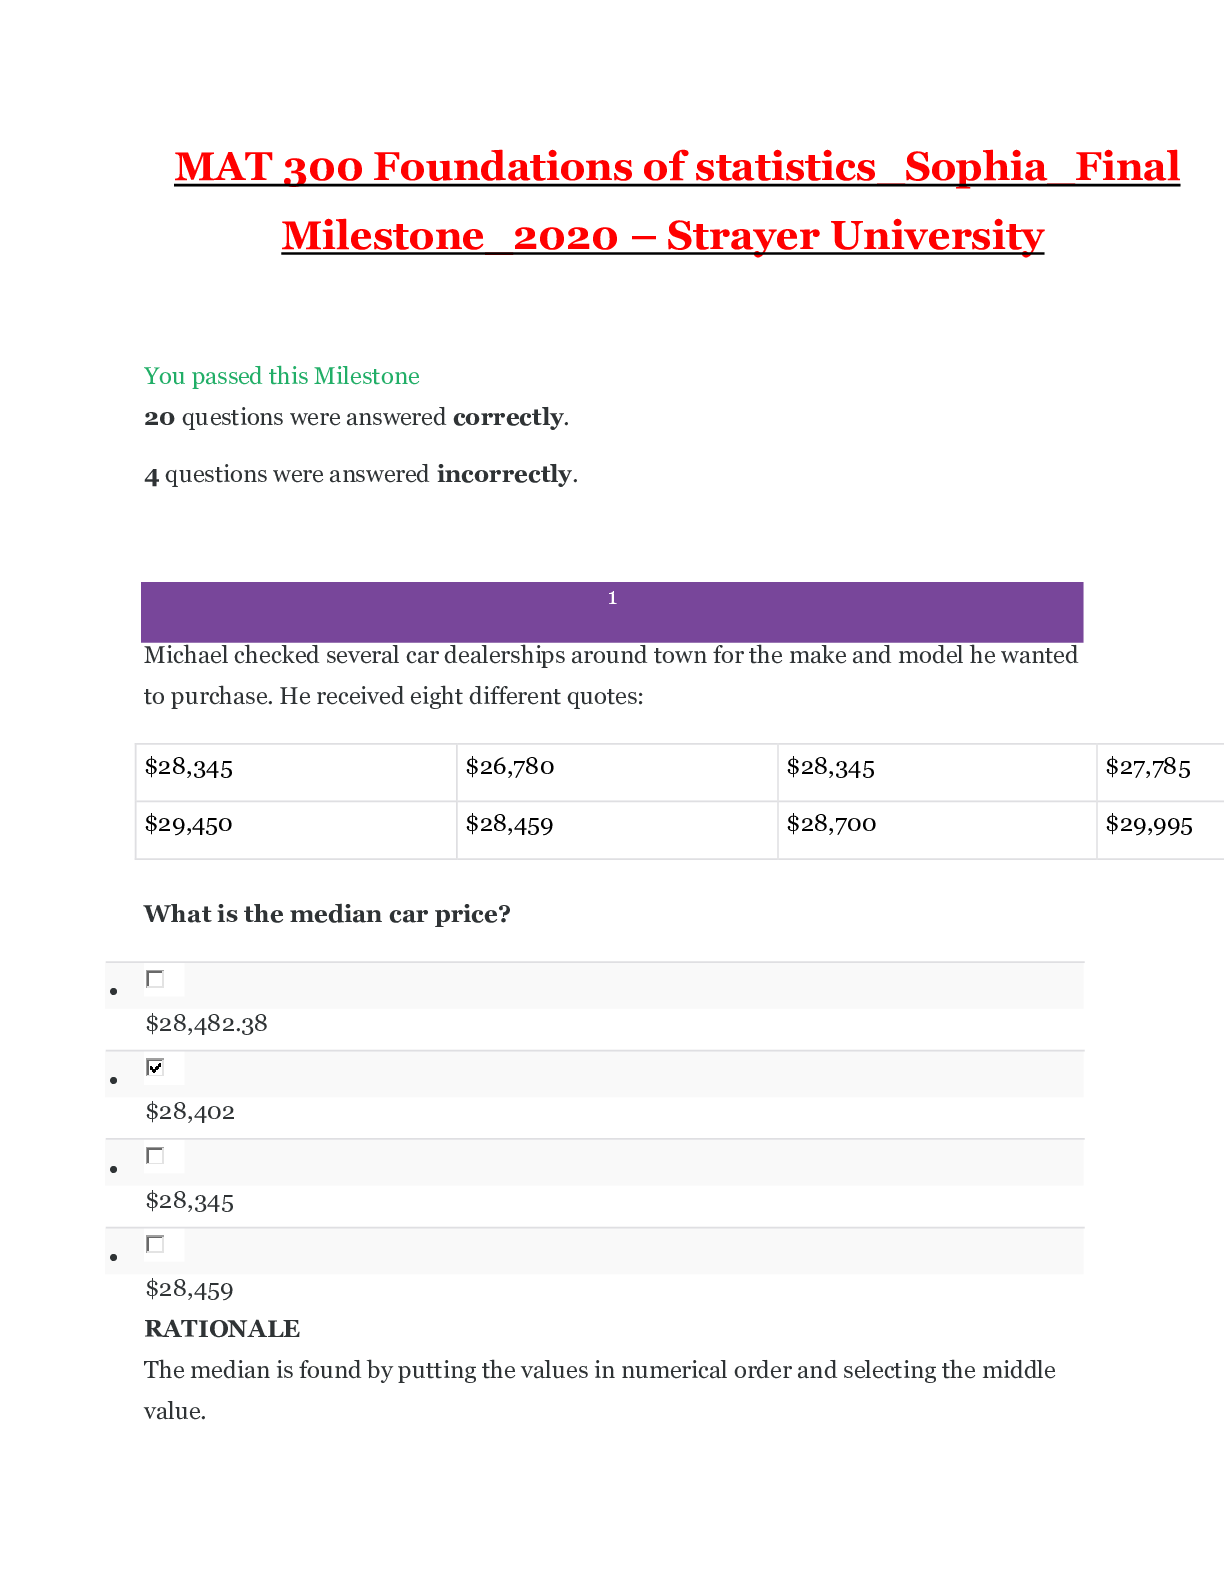
MAT 300 Foundations of statistics_Sophia_Final Milestone_2020 – Strayer University You passed this Milestone 20 questions were answered correctly. 4 questions were answered incorrectly. ... Michael checked several car dealerships around town for the make and model he wanted to purchase. He received eight different quotes: What is the median car price? • $28,482.38 • $28,402 • $28,345 • $28,459 RATIONALE The median is found by putting the values in numerical order and selecting the middle value. $26,780 $27,785 $28,345 $28,345 $28,459 $28,700 $29,450 $29,995 For an even number the middle two values are averaged. In this case, the two middle values are $28,345 and $28,459 and their average is = $28,402. CONCEPT Calculating the Center of Data Derek recently took up gardening. To determine what type of fertilizer would keep his plants their healthiest, he took three identical plants and applied a different type of fertilizer to each. Next, Derek observed how much each plant grew. Derek is in effect performing an experiment that contains explanatory and response variables. Which statement best describes the explanatory and response variables involved in this experiment? • Plant type is the response variable and fertilizer is the explanatory variable, because different plants will require different amounts of fertilizer. • Plant growth is the explanatory variable and fertilizer is the response variable, because fertilizer manipulates plant growth. • Fertilizer is the response variable and plant growth is the explanatory variable, because Derek measures plant growth as he changes fertilizers. • RATIONALE Since each plant is identical, Derek is assuming the amount of growth is dependent on the type of fertilizer used. This means that plant growth is the response (dependent) variable and the fertilizer is the explanatory (independent) variable that explains the plant growth. CONCEPT Importance of Experiments Anthony recently graduated with a bachelor's degree in nursing (BSN) and was looking for a job at a local hospital. As part of his research, he gathered data on the national average pay for a BSN by looking at nursing salaries at hospitals countrywide. Then he looked at the average pay for BSNs at hospitals in his city, as well as cities nearby. What is the sample in Anthony's scenario? • The local average salary for a BSN • The total number of hospitals in the country • The number of hospitals in Anthony's area • The national average salary for a BSN RATIONALE The population in the experiment is all the hospitals in the US and the sample are the ones in Anthony's area (in his city, as well as cities nearby). The national average salary and local average salary would be the parameter and statistic of the experiment. CONCEPT Classifying Data by Who You Are Testing What percent of a data set is represented by the total area under a normal distribution curve? • 75% • 25% • 50% • 100% RATIONALE Recall that the total area under any distribution curve must equal 1. CONCEPT Normal Distributions and Probability Which probability value indicates that there is statistical significance? • 0.2356 • 0.015 • 0.9756 • 0.9078 RATIONALE Recall that the region of rejection for a 5% significance level falls below 2.5% and above 97.5% when considering probabilities. CONCEPT Determining Significance Based on Probability Jean works for the government and was conducting a survey to determine the income levels of a number of different neighborhoods in a metropolitan area. Based on national data, Jean knows that the mean income level in the country is $40,000, with a standard deviation of $2,000. Jean selected three neighborhoods and determined the average income level. What is the probability that the average income level in the neighborhoods was less than $38,000? • 16% • 84% • 90% • 10% RATIONALE First we need to find the z-score. The mean is $40,000, the value we are looking for is $38,000, and the standard deviation is $2,000, so the z-score is: Next, we need to find this probability in our z-table. A z-score of -1 corresponds with a probability of 0.1587. This is the probability that the value is LESS THAN $38,000, which is about 16%. CONCEPT Application of z-Scores In a normal distribution, which statement best describes the relationship between mean, median, and mode? • The mean is the smallest value, the mode is the largest value, and the median lies between the mean and mode. • The mode is the most common value, the median is the smallest, and the mean is the middle value. • The mean and median are the same, while the mode is always larger than either the mean or median. • The mean, median, and mode are the same. RATIONALE In a normal distribution, all the measures of center (mean, median, mode) are the same. CONCEPT Representing How Data is Normally Distributed This graph shows survey results on the average sale price of restored 1969 Camaros. What type of data does this graph represent? • Interval • Ratio • Nominal • Ordinal RATIONALE Remember ratio data is like interval data, so it provides numbers that we can base other ones against except the value of zero does mean that something doesn't exist. Ratio data occurs in most types of measurements, such as length, width, and weight, and in this case, number of responses. Nominal data provides categories and is based on characteristics that do not have direction or magnitude. Ordinal data also is based on characteristics but they need to be able to be put in a meaningful order. CONCEPT Data Comes in Different Types Which statement best describes the strength, direction, and correlation coefficient of the scatter plot shown here? • Strong negative association with correlation coefficient close to 1 • Weak association with correlation coefficient close to 0 • Strong positive association with correlation coefficient close to 0 • Strong association with correlation coefficient close to -1 RATIONALE The closer the data looks to a straight line, the stronger the relationship is. Here, the data is very scattered. A negative relationship is identified when, as one variable decreases, the second variable increases, while a positive relationship is when one variable increases, the second variable also increases. Here, there is no trend that can be identified. If the data is very scattered and shows no trend, then the correlation coefficient is close to 0. CONCEPT Using Data to Identify a Relationship Between Variables Because her current dishwasher detergent wasn't getting her dishes as clean and clear as she wanted them to be, Gwen decided to change brands. Before she washed her next load of dishes, she made a hypothesis as to the outcome of using a new detergent. Which of the following would be the null hypothesis? • There is no difference between the performance of one brand compared to the other. • The new and old detergents will both clean the dishes. • The old detergent will not clean the dishes as well as the new detergent. • The new detergent will not be as good as the old detergent. RATIONALE Gwen is not sure that the new detergent will make them cleaner or less clean so we always set the null hypothesis to say that there is no difference between the two. CONCEPT Identifying a Reason for Performing an Experiment A researcher read that singing to plants causes them to grow an extra 0.5 inches on average per month. He tests this with 20 of his own plants by bringing 10 to work and leaving 10 at home. The ones at home he sings to each day and he does not sing to the ones at his office. Which would be a control variable he could use in this experiment? • Fertilizing the ones at his office since they will receive less water. • Ensuring that the two sets of plants will receive the same amount of water and light. • Putting all the flowering plants in his office and the non-flowering plants at home. • Having someone different sing to the plants each day. RATIONALE A control variable is something that we use to ensure that one group is not manipulated or treated differently than the other group, therefore making sure they both have the same amount of water and light is a control variable. CONCEPT Setting up an Experiment Gaurav was conducting a test to determine if the average amount of medication his patients were taking was similar to the national average. He wants to use a 5% significance level for his test to help ensure that his patients do not receive too little or too much medication. If Gaurav were to conduct a test, what probability value would indicate that his null hypothesis (that there is no significant difference between the amount of medication Gaurav's patients are receiving and the national average) would be rejected? • 45.69% • 92.18% • 0.45% • 10.27% RATIONALE If we are considering a 5% significance level, then this means that we are accounting for 95% of the data. If we picture this on a normal distribution curve, we would say that 2.5% of the data in the left tail is not accounted for and 2.5% of the data in the right tail is not accounted for. Therefore, probability values that are below 2.5% or above 97.5% indicate that the null hypothesis should be rejected. This is because if the null hypothesis were true for a 5% significance level, then it is very unlikely that we would get probabilities below 2.5% or above 97.5% by accident. CONCEPT Introduction to Significance Levels Clarice was in the process of creating a report on the performance of her students and was trying to determine the z-score related to overall student scores. If the mean percentage of students was 75% and the standard deviation was 10%, what z-score would correspond to a student that ended the course with a 95%? • -1 • -3 • -2 • 1 • RATIONALE Remember the formula for z-score is: For this problem these values are as follows: Plugging these values into the formula for a z-score gives the following: CONCEPT Calculating z-Scores If the sum of squares for a sample containing 51 items equals 400, what is the standard deviation? RATIONALE The standard deviation is found by dividing the sum of squares by (n-1) and taking the square root so here it would be: CONCEPT Calculating Standard Deviation and Variance The data set below represents the heights (in inches) of students in a particular high school class: What is the range of the data set? • 75 inches • 16 inches • 18 inches • 12 inches RATIONALE The range is the largest value minus the smallest value. The largest value is 75 and the smallest value is 59. The range is 75 - 59 = 16 inches in this case. CONCEPT Calculating the Range of Data The data on this graph represents the number of sales for several types of vehicles in 2015. Which vehicle represents the mode? • Mustang • F-150 • Camaro • Corvette • Challenger • Accord RATIONALE The mode is the value that occurs most often, or has the highest frequency. The tallest bar on this bar chart is F-150, which indicates the mode. CONCEPT Identifying Measures of Center on a Graph Which statement explains what the slope tells you about the variables in this graph? The graph shows that there is a positive relationship between running and calories burned. • The graph shows that for every calorie consumed, the amount of time running will be reduced. • The graph shows that there is a negative relationship between time spent running and calories burned. • The graph shows that for every minute spent running, the runner must consume more calories. RATIONALE If one variable increases as the other variable also increases, the two share a positive slope. Here, as the time spent running increases, so do the calories burned; therefore, there is a positive slope or positive relationship. CONCEPT Representing How Two Data Sets are Related Web designer Rachel developed an interactive website and wanted to test its ease of use. To gather some data, Rachel asked her co-workers to test the site and give her feedback. Rachel presented her design on her personal blog and left a survey for feedback from her readers. Which of the following is an example of selection bias? • The people who fill out Rachel's survey are able to choose whether or not they take the survey. RATIONALE Since Rachel's co-workers all work with her and are also web-designers or similar, this represents selection bias since they all share a particular characteristic, important to the research question. CONCEPT Issues with Performing Experiments Which statement regarding the region of rejection for a 5% significance level is TRUE? • The region of rejection lies between the z-scores -2 and 2. • The region of rejection indicates that the null hypothesis is true. • If a z-score falls within the region of rejection, this means that the alternate hypothesis should be rejected. • A z-score above 2 is part of the region of rejection. RATIONALE Remember that the region of rejection would be any value that is less than the significance level. When that occurs, we reject the null hypothesis. For a 5% significance level, that indicates a z-score of anything less than -1.96 (-2) or greater than 1.96 (2) would be cause for rejection. CONCEPT Determining Significance Given this z-table and the standard normal distribution shown in the graph, which z-score represents a value that is likely to occur? • 3.24 • 1.49 • 2.34 • -3.50 RATIONALE Since the graph shows a highlighted area from -2 to 2, the possible z-scores must lie within that range. CONCEPT Determining Likelihood of a Mean Part of Patrick's job as manager of an indoor pool at the local community center was to determine what gender used the pool most, what age group used the pool most, and what days the pool was busiest. Patrick wants to create either a bar graph or a histogram of his data. For what data would the histogram be the best way to represent Patrick's information? • What gender used the pool most • What age group used the pool most • What days the pool was busiest • All of the data is best graphed using a histogram RATIONALE Histograms are best used with interval or ratio variables. Gender and days of the week are categorical data, not interval or ratio data, so age is the best for a histogram. CONCEPT Graphing Data Which statement is true regarding a 95% confidence interval? • Only 2.5% of the data will indicate a significant value. • There is a 2.5% chance that the alternate hypothesis will not be rejected. • There is a 95% chance that the null hypothesis will be rejected. • There is a 5% chance that the population mean will not fall in the range given by the confidence interval. RATIONALE Remember, confidence intervals are used to provide a range to an estimate of a particular population value so they can be used to estimate a range for the population mean. Since we cannot always sample the whole population, we provide an estimate and a range in which it most likely lies. We set a percent of likelihood of the confidence interval, for example 95% confidence and that means we are 95% certain that the population mean lies in that interval and 5% certain that it does not fall in that range. CONCEPT Applying Confidence Intervals Ahmad was conducting some tests to determine if there was a relationship between taking sleeping pills and the amount of sleep a person gets. His null hypothesis was that taking sleeping pills did not have any effect on the amount of sleep a person receives. Ahmad's alternate hypothesis was that taking sleeping pills increases the amount of sleep a person will get. If Ahmad completed his study, which of the following statements would indicate a Type II error? • Ahmad's results showed that sleeping pills did not affect the amount of sleep participants were getting when in fact sleeping pills were increasing the sleep people were getting. • Ahmad's results showed that sleeping pills did not affect the amount of sleep participants were getting when in fact there was not a cause and effect relationship between the two variables. • Ahmad's results showed that sleeping pills caused people to get more sleep, and in fact sleeping pills and the amount of sleep people were getting did have a positive cause and effect relationship. • Ahmad's results showed that taking sleeping pills did increase the amount of sleep people were getting when in fact sleeping pills were not affecting sleep. RATIONALE Recall that Type II error is when we fail to reject the null when it is false. In this case, if we determined that the pills had no effect on the amount of sleep, when they really did, it would be a Type II error. CONCEPT Type I and Type II Errors A teacher wanted to understand how his students' grades were distributed on the final exam. The grades were: What is the interquartile range of the grades? • 18 • 15 • 4 • 38 RATIONALE Remember the Interquartile Range (IQR) is the third quartile minus the first quartile. Sort the data in ascending order and find Q1 and Q3. Note that the median is $32,000. Since there are 9 values, Q1 is found by the median of the first 4 values and Q3 is found by the median of the last 4 values. We can find both values by taking the averages in these ranges: So the IQR is equal to: [Show More]
Last updated: 1 year ago
Preview 1 out of 20 pages
Buy this document to get the full access instantly
Instant Download Access after purchase
Add to cartInstant download
We Accept:

Reviews( 0 )
$15.00
Document information
Connected school, study & course
About the document
Uploaded On
Sep 19, 2020
Number of pages
20
Written in

Additional information
This document has been written for:
Uploaded
Sep 19, 2020
Downloads
0
Views
43


.png)