Glo -Bus-How Company Performance Is Scored__xid-6298584_2,GRADED A
Document Content and Description Below
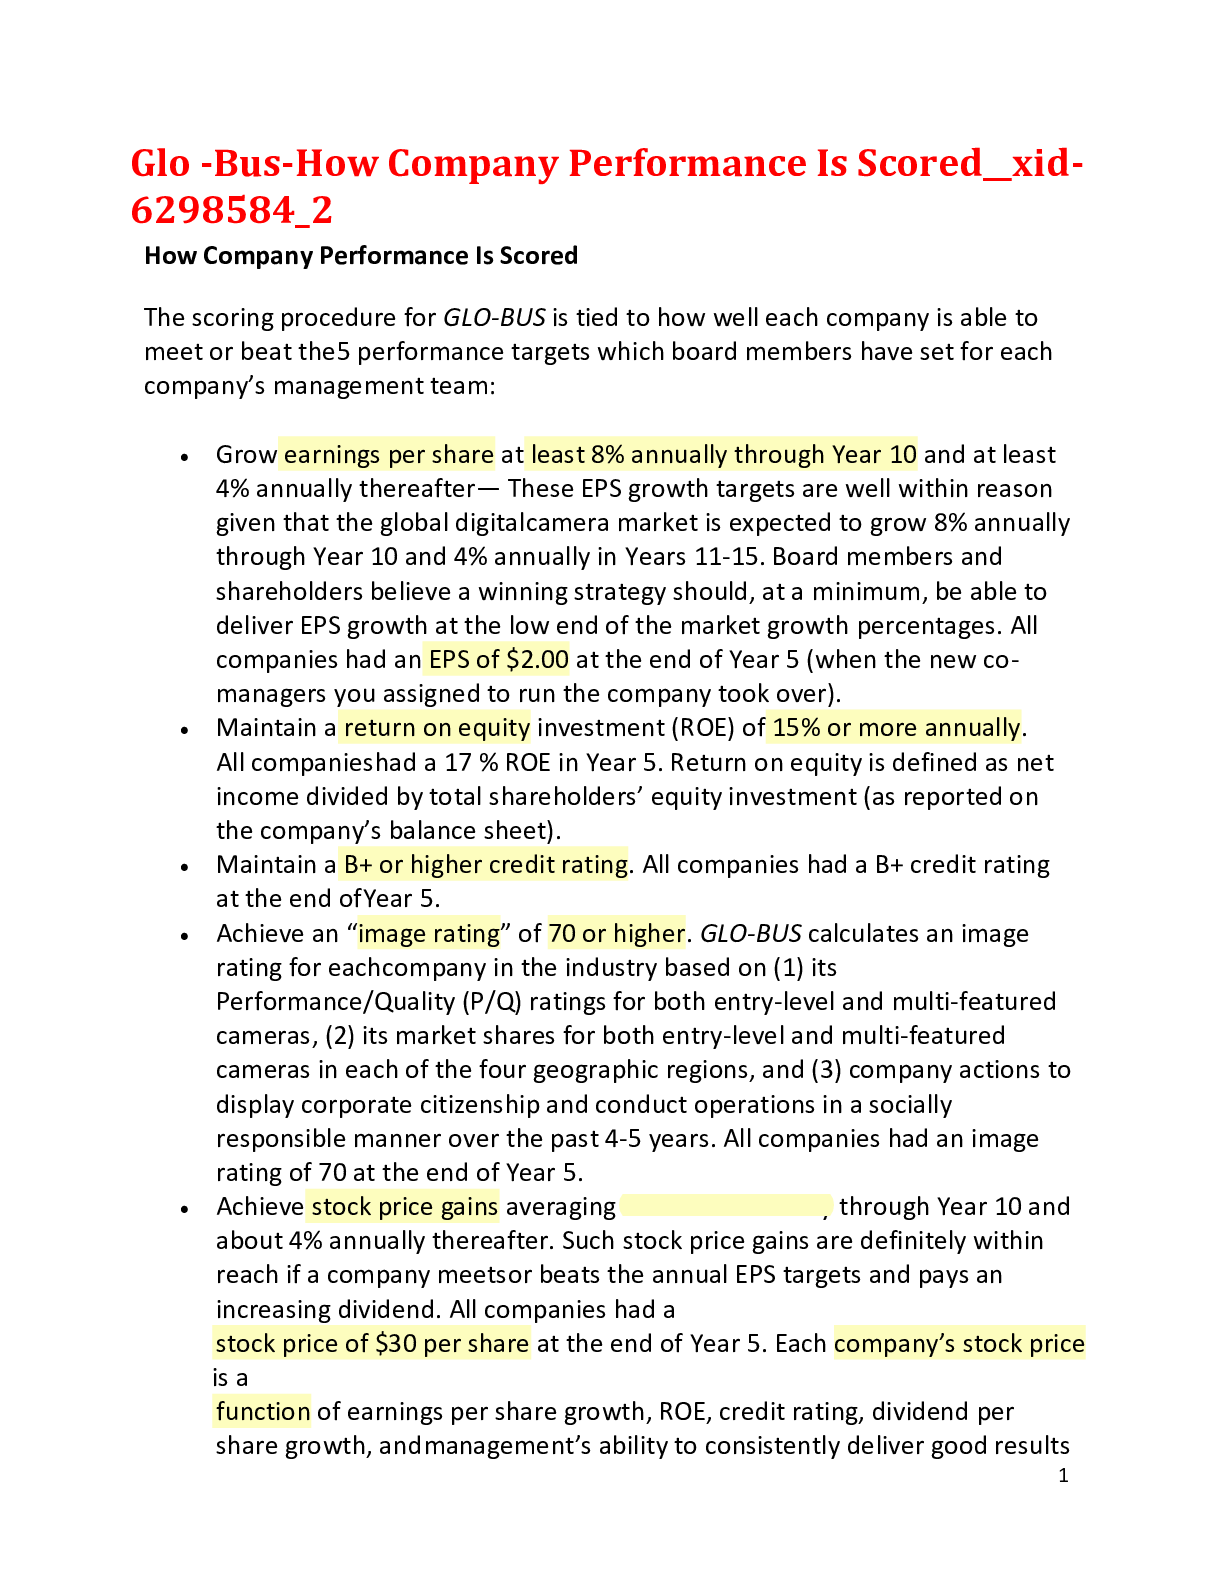
Glo -Bus-How Company Performance Is Scored__xid-6298584_2 How Company Performance Is Scored The scoring procedure for GLO-BUS is tied to how well each company is able to meet or beat the 5 performan... ce targets which board members have set for each company’s management team: • Grow earnings per share at least 8% annually through Year 10 and at least 4% annually thereafter— These EPS growth targets are well within reason given that the global digital camera market is expected to grow 8% annually through Year 10 and 4% annually in Years 11-15. Board members and shareholders believe a winning strategy should, at a minimum, be able to deliver EPS growth at the low end of the market growth percentages. All companies had an EPS of $2.00 at the end of Year 5 (when the new co- managers you assigned to run the company took over). • Maintain a return on equity investment (ROE) of 15% or more annually. All companies had a 17 % ROE in Year 5. Return on equity is defined as net income divided by total shareholders’ equity investment (as reported on the company’s balance sheet). • Maintain a B+ or higher credit rating. All companies had a B+ credit rating at the end of Year 5. • Achieve an “image rating” of 70 or higher. GLO-BUS calculates an image rating for each company in the industry based on (1) its Performance/Quality (P/Q) ratings for both entry-level and multi-featured cameras, (2) its market shares for both entry-level and multi-featured cameras in each of the four geographic regions, and (3) company actions to display corporate citizenship and conduct operations in a socially responsible manner over the past 4-5 years. All companies had an image rating of 70 at the end of Year 5. • Achieve stock price gains averaging about 8% annually through Year 10 and about 4% annually thereafter. Such stock price gains are definitely within reach if a company meets or beats the annual EPS targets and pays an increasing dividend. All companies had a stock price of $30 per share at the end of Year 5. Each company’s stock price is a function of earnings per share growth, ROE, credit rating, dividend per share growth, and management’s ability to consistently deliver good results (as measured by the percentage of these 5 performance targets that each company achieves over all completed decision rounds). The default weight placed on all five performance targets is 20%. The five weights translate into 20 points out of 100 for each of the 5 performance measures, with the sum of the points adding to a total of 100 points. There is an option on your Administrative Menu for each “industry” that allows you to alter these weights however you see fit. The scoring weights selected are reported to all company co-managers in the narratives at the bottom page 1 of the GLO-BUS Statistical Review and also in the narratives showing the company scores on each scoring variable on pages 2 and 3 of the GLO-BUS Statistical Review. Hence, class members will be well aware of what the weights are. Using the assigned weights (or corresponding number of points out of 100), each company’s performance on the 5 measures is tracked annually and company performance scores are calculated from two different angles: the “investor expectations” standard and the “best-in- industry” standard. Special Note: The scoring procedures described below may seem more complicated than they really are because we are providing full details and explanations of how the scoring works—in truth a company’s overall performance cannot be fairly or accurately gauged by “keeping it simple” and looking at just a couple of performance measures. A “balanced scorecard” for determining how well a company is doing financially and strategically has to be multi-faceted and somewhat sophisticated in order to look at a company’s performance from several perspectives and angles. The GLO-BUS scoring methodology, introduced in 2003 and now used for tens of thousands of participants, has a time-tested track record of working exceptionally well. The scoring synopsis provided to co-managers on the company scoreboard (pages 1, 2, and 3 of the GLO-BUS Statistical Review) is straightforward and easily grasped—we get very few questions about how the scoring works. Company co-managers can discern exactly why their scores are high or low relative to the other companies, and it is always indisputably clear which companies are the industry leaders and which companies are being outperformed. The Investor Expectations (I.E.) Standard for Company Scoring. The Investor Expectations Standard involves calculating an annual “Investor Expectation Score” based on a company’s success in meeting or beating the five investor-expected performance targets each year. There is also a Game-to-Date or “all-years” Investor Expectation Score that shows a company’s success in achieving or exceeding the expected performance targets over all years of the exercise completed so far. Some important aspects of how the Investor Expectation (I.E.) Scores are calculated are summarized below: • Meeting each expected performance target is worth some number of points based on the scoring weight you select (the default scoring weights—which we recommend using— are 20% or 20-points each). For instance, if the scoring weight for EPS (or ROE or stock price or image rating or credit rating) is 20%, meeting the EPS (or ROE or stock price or image rating or credit rating) target earns a score of 20 on the EPS (or ROE or stock price or image rating or credit rating) performance measure. • Beating the EPS, ROE, stock price, and/or image rating targets are worth point bonuses of 0.5% for each 1.0% that a company’s actual performance exceeds the expected performance for EPS, ROE, stock price, and image rating, up to a maximum 20% bonus for each measure. For example, if a company achieves an EPS of $6.00 when the target is $4.00 and if EPS carries a 20-point weighting, then the company will receive an EPS score of 24 (because it beat the target by 50% and qualifies for the maximum 20% bonus over the 20-points awarded for just matching the EPS target). Bonus points are also awarded for credit ratings above B+, with a full 20% point bonus being given for an A+ rating. • Failure to achieve the investor-expected target for EPS or ROE or stock price or image rating results in a score for that performance measure between 0 and the point maximum for that measure, with the score depending on the percentage of the target achieved. For instance, if a company achieves a stock price of $22 at a time when the stock price target is $50, then the company’s score on the stock price target (assuming a 20% weight and thus 20 possible points) would be 9 points ($22 divided by $50 = 0.44 or 44%; 44% of the 20 points awarded for meeting the stock price target translates into a point score of 9 points, rounded to the nearest whole number). • If a company’s EPS is negative, no points are awarded toward meeting investor expectations for EPS. • If in a given year a company loses money and has a negative ROE, no points are awarded on the ROE measure. • If the point weighting for credit rating is 20 (which equates to a maximum of 24 points including the bonus), then the various possible credit rating scores are as follows: • A+ 24 points • A 23 points • A- 22 points • B+ 20 points • B 16 points • B- 12 points • C+ 8 points • C 4 points • C- 0 points • • The sum of a company’s scores (including bonus points) on each of the 5 investor- expected targets equals its annual I.E. Score. Exactly meeting each of the 5 performance targets produces an I.E. Score of 100. Beating the EPS, ROE, stock price, and image rating targets by 20% or more and earning an A+ credit rating results in a maximum achievable I.E. Score of 120. • A company’s Game-to-Date Investor Expectation Score (for all years completed so far) is based on (1) its weighted-average EPS for all years completed versus the average of the EPS targets for all years completed, (2) its weighted-average ROE for all years completed versus an all-year or ongoing ROE average of 15%, (3) an average of its image rating for the 3 most recent years as compared to an ongoing, every-year image-rating target of 70, (4) its most recent year’s stock price versus the most recent year’s stock price target, and (5) its most recent year’s credit rating versus the ongoing credit rating target of B+, as summarized below: o Game-to-Date I.E. Scoring for EPS is based on how each company’s weighted- average EPS for all years completed stacks up against the average of the EPS targets for all years completed. Companies that meet the all-year weighted- average EPS target receive a score equal to the EPS point weighting; companies that beat the weighted-average EPS target receive bonus points of up to 20%, and companies that fall short of the weighted-average EPS target receive scores equal to the fraction of the EPS target that was achieved. o Game-to-Date I.E. Scoring for ROE is linked to how each company’s weighted average ROE for all years completed stacks up against the all-year ROE average target of 15%. Companies that meet the all-year 15% average ROE target receive a score equal to the ROE point weighting; companies that beat the 15% ROE target receive bonus points of up to 20%, and companies that fall short of the 15% target receive scores equal to the fraction of the 15% ROE target that was achieved. o Game-to-Date I.E. Scoring for Stock Price hinges only on each company’s most recent year’s stock price, not some all-year average. The latest stock prices of companies in the industry are used to measure the game-to-date I.E. score for stock price because a company’s latest stock price is a function of EPS growth, ROE, credit rating, dividend per share growth, and management’s ability to consistently deliver good results (as measured by the percentage of these 5 performance targets that each company achieves over all completed decision rounds) and thus includes a heavy long-term element. Companies that meet the most recent year’s stock price target receive a score equal to the stock price point weighting; companies that beat the most recent year’s stock price target receive bonus points of up to 20%, and companies that fall short of the most recent year’s stock price target receive scores equal to the fraction of the stock price target that was achieved. o Game-to-Date I.E. Scoring for Credit Rating is keyed to how each company’s latest credit rating compares against the ongoing rating of B+. The latest year’s credit rating is used to measure the game-to-date credit rating score, as opposed to an all-year average credit rating, because a company’s latest credit rating is largely reflective of management’s entire multi-year record of finance-related actions/decisions and the overall financial condition and balance sheet strength that management has engineered to date. The game-to-date I.E. scores for credit rating are always the same as for the current-year scores because both are based on the most recent year’s credit rating. o Game-to-Date I.E. Scoring for Image Rating is based on how each company’s average image rating for the most recent three years stacks up against the all-year average target of 70. A 3-year average image rating is used to measure game-to- date performance, as opposed to an all-year average, so as not to burden a company’s performance by image ratings that are not representative of the image and reputation it has recently achieved with its strategy. Companies whose average image rating for the most recent 3 years equals the 70 image rating target receive a score equal to the image rating point weighting; companies having 3-year average image ratings above 70 receive bonus points of up to 20%, and companies having 3-year average image ratings below 70 receive scores equal to the fraction of the image rating target of 70 that was achieved. The sum of a company’s Game-to-Date scores on each of the five scoring measures equals its total Game-to-Date I.E. Score. Special Note: The Game-to-Date I.E. scores are thus definitely not equal to an average of the annual I.E. scores. • Both annual and Game-to-Date Scores of 100 to 120 are quite excellent, scores of 90-99 are very good, scores of 80-89 are good, scores of 70-79 are fair, and scores below 70 reflect consistently “sub-par” results in meeting the targets that investors expect and that company Board of Directors set for management to achieve. The Best-in-Industry (B-I-I) Standard for Company Scoring. The best-in-industry or B-I-I standard concerns how well each company performs relative to the “best-in industry” performer on 4 measures—EPS, ROE, image rating, and stock price and how close each company comes to the ultimate credit rating of A+. Again, the performance scores are based on the weights/points assigned to each of the 5 performance measures, with the sum of the points on the 5 measures adding to 100. The Best-in-Industry Standard entails assigning the best-performing company the highest number of points and then assigning each remaining company a lesser number of points according to what percentage of the leader’s performance they were able to achieve. For instance, if ROE is given a weight of 20% (20 points), an industry-leading ROE performance of 25% gets a score of 20 points and a company with an ROE of 20% (which is 80% as good as the leader’s 25%) gets a score of 16 points (80% of 20 points)?the B-I-I scores for EPS, stock price and image rating work in precisely the same manner. The procedure is slightly different for the credit rating measure—each credit rating grade is tied to the number of points the instructor assigns to the credit rating (an A+ rating always gets a best-in-industry score equal to the instructor-chosen maximum, with the grades for other credit ratings scaled down all the way to 0 for a C- rating). Each company’s Best-in-Industry (B-I-I) Score is equal to its combined point total on the five performance measures. In order to receive a score of 100, a company must (1) be the best-in- industry performer on EPS, ROE, stock price, and image rating, (2) achieve the targets for EPS, ROE, stock price and image rating set by the company’s Board of Directors, and (3) have an A+ credit rating. B-I-I scores of 80 to 100 reflect good-to-excellent performance; scores under 50 should cause company co-managers great concern and signal the need for immediate strategy improvement. Some important aspects of how the Best-in-Industry Scores for a given year are calculated are summarized below: • The best-in-industry scoring standard is based on a maximum score of 100 points, with each scoring variable carrying a 20-point rating (unless you alter the 20% default weights). To get a score of 100, a company has to be the highest performing company— termed the best-in-industry performer—on all five performance measures during the year, meet or beat the EPS, ROE, stock price, and image rating targets, and have an A+ credit rating. • The best-in-industry performer on each measure earns a perfect score (the full number of points based on the chosen point weightings—provided the industry leader’s performance on that measure equals or exceeds the performance target established by company Boards of Directors). Each remaining company earns a fraction of the points earned by the best- in-industry performer that is equal to its performance (on EPS, ROE, stock price, and image rating) divided by the performance of the industry-leading company (on EPS, ROE, stock price, and image rating). For instance, if EPS is given a weight of 20 points and if the EPS target is $4.00, an industry-leading EPS performance of $5.00 gets a score of 20 points and a company with an EPS of $2.00 (which is 40% as good as the leader’s $5.00) gets a score of 8 points (40% of 20 points). Likewise, if stock price is given a weight of 20 points, an industry-leading stock price performance of $75 at a time when the target stock price is $50 gets a score of 20 points and a company with a stock price of $60 (which is 80% as good as the leader’s $75) gets a score of 16 points (80% of 20 points). • Whenever the best-in-industry performer’s EPS, ROE, stock price, or image rating is below the corresponding target for the year, the industry-leading company is not awarded a perfect score (the maximum number of points) but rather a percentage of the maximum score that equals the leader’s EPS, ROE, stock price, or image rating as a % of the corresponding target for the year. Thus if the best performing company has an ROE of 13.5% (versus the every-year target of 15%) and if ROE carries a 20-point weighting, the best-performer earns an ROE score of 18 points (13.5% divided by 15% = 0.90 or 90%, and 90% of 20-points is 18 points). This is done to prevent a company with the highest average EPS, ROE, stock price, or image rating from being awarded the equivalent of an A+ Best-in-Industry Score when its performance on EPS, ROE, stock price, or image rating actually falls short of the level established by company Boards of Directors. In all such instances, each remaining company will earn a fraction of the points earned by the best-in-industry performer, with that fraction being equal to its performance (on EPS, ROE, stock price, and image rating) divided by the performance of the industry-leading company (on EPS, ROE, stock price, and image rating). Hence, if the industry best- performer has a 13.5% ROE and earns an ROE score of 18 points, a company with an ROE of 12% will receive a score of 16 points (12% divided by 13.5% = 0.889 or 88.9% and 88.9% of 18 points = 16 points). • The procedure for assigning best-in-industry scores is a bit different for the credit rating measure. Each credit rating grade from A+ to C- carries a certain number of points that scales down from the maximum number of points for an A+ credit rating to 1 point for a C- rating. If the credit rating weight is 20 points out of 100, the B-I-I point awards for credit rating are as follows: • A+ 20 points (or 100% of the point weighting) • A 19 points (or 95% of the point weighting) • A- 18 points (or 90% of the point weighting) • B+ 17 points (or 85% of the point weighting) • B 14 points (or 70% of the point weighting) • B- 11 points (or 55% of the point weighting) • C+ 8 points (or 40% of the point weighting) • C 4 points (or 20% of the point weighting) • C- 1 point (or 5% of the point weighting) • • All companies that lose money in any given year and end up with a negative EPS automatically receive a best-in-industry EPS score of 0 points. • Similarly, companies with a negative ROE receive a best-in-industry ROE score of 0 points. • Each company’s B-I-I score equals its combined point total on the five performance measures. • Best-in-Industry performance scores of 90-99 are excellent, scores of 80-89 are good to very good, scores of 70-79 are fair to good, scores of 60-69 are weak to fair, and scores below 60 reflect a performance roughly 40% or more below that of companies with scores in the 90s—which says that such companies were outperformed by other companies in the industry by a significant margin. The highest possible Best-in-Industry (B-I-I) Score is 100, earned only if a company is the best- in-industry performer on EPS (with an EPS equal to or above the target), the best-in-industry performer on ROE (with an ROE of at least 15%), the best-in-industry performer on stock price (with a stock price equal to or above the yearly target), and the best-in-industry performer on image rating (with an image rating of at least 70) and also has an A+ credit rating. Combining the Annual and Game-to-Date I.E. Scores and B-I-I Scores into Overall Scores. The scoring includes both an annual and a game to date “Overall Score” for each company. These scores are determined by combining each company’s Investor Expectation Score and the Best-in- Industry Score into a single score using whatever weighting you wish (the default weighting— which we strongly recommend—is 50-50). The Annual Overall Scores for the various companies are a weighted average of their respective annual I.E. scores and the annual B-I-I scores, while the Game-to-Date Overall Scores are a weighted average of the game-to-date I.E. scores and the game-to-date B-I-I scores. Since I.E. scores can range as high as 120, it is common for the Overall Scores of the very best- performing companies to be greater than 100. Overall Scores greater than 100 are clearly indicative of superior company performance and are definitely worthy of an A or A+. As a general rule, we think that companies with an overall performance score of 90 or above at the conclusion of the decision rounds should get anywhere from an A— to an A+ on this portion of the GLO-BUS exercise. Companies with overall game-to-date scores of 80-89 should get a B— to a B+ (or higher if there are no companies with scores of 90 or more). Companies with an overall performance score of 70-79 above should get a grade in the C range (or higher depending on how many companies have higher scores). You may find it desirable to scale the company grades if competition turns out to be so fierce or cutthroat that companies in the industry can’t earn profits that meet investors’ performance expectations and thus end up with “low” overall game-to-date scores. In most of our classes, we end up scaling the performance scores of companies with overall scores below 70, but there is usually at least one company with a score above 90 (clearly meriting an A)—hence scaling the grades on the upper end of the industry rankings is typically unnecessary. The latest Game-to-Date I.E. scores, Game-to-Date B-I-I scores, Game-to-Date Overall Scores, and industry rankings (based on the Overall Scores) are shown in your Instructor Center—on the screen that shows the Administration Menus for each “industry” you have created for your class or classes. A Scoreboard Box containing the same information is always prominently displayed on each company’s Corporate Lobby page (the first screen they see when they log on at www.glo-bus.com). Moreover, after each decision round, all company co-managers can view or print a complete Company Scoreboard showing each company’s performance on every aspect of the scoring, including all the scoring weights; this complete scoreboard is provided on the first three pages of the GLO-BUS Statistical Review (a report that every company co-manager can view/print after each decision round is completed). The Help sections for each page of the 3-page Company Scoreboard provide detailed, easy-to-understand explanations of the scoring so company co-managers should encounter no “mystery” factor about how the scoring works or where each company stands in the industry performance rankings. Bonus Point Scoring Awards. Company co-managers have the opportunity to qualify for two special bonus point awards that can boost their company’s overall game-to-date score. Both bonus awards are a part of the simulation scoreboard, are calculated and awarded automatically to qualifying companies, and shown as an addition or adjustment to a company’s overall score. Here’s what the two bonus point awards involve: • Bull’s Eye Award (awarded annually for accurately projecting the company’s performance) -- One bonus point is added to a company’s game-to-date score when (1) the company’s actual total revenues are within &plusmin;5% of projected total revenues, (2) the company’s actual EPS is within 10¢ or &plusmin;5% of projected EPS, and (3) the company’s actual image rating is within &plusmin;4 points of the projected image rating. To qualify for the Bull’s Eye Award in a given year a company must achieve all three of the above requirements for that year. o Standard rounding rules apply to the &plusmin;5% calculations for revenues and EPS. There are no decimal points involved in the calculation and reporting of a company’s Image Rating. o No partial bonus points are awarded when just one or two of these three conditions are met. o There are as many 1-point Bulls Eye bonus point awards as there are companies that meet all three conditions. o There is no limit on the number of Bull’s Eye Awards a given company can receive. Hence receiving a Bulls Eye Award for each of the various decision rounds can significantly impact a company’s overall score o While Bull’s Eye Award statistics are provided during the practice rounds for illustrative purposes, any awards are erased after the practice rounds—in other words, any Bull Eye Awards during the practice rounds “do not count” and will not be included in the bonus-point additions to a company’s final game-to-date score. o The total bonus points accumulated by each company and the bonus-point- adjusted overall score for each company are shown in the bottom section of page 1 of the GLO-BUS Statistical Review where the Overall Game-to-Date company scores appear. • Leap Frog Award (awarded annually for most improved overall performance) — Beginning in Year 12, one bonus point is added to a company’s overall game-to-date score when the company’s current-year score shows the biggest improvement over its prior year’s score (based on number of points, rather than percentage improvement) in comparison to the score gains of all other companies in the industry. In the rare instance where all companies fail to improve their current scores from one year to the next, a Leap Frog bonus is not awarded. o The first Leap Frog Award is given in Year 12 (since it takes two years of results for a company to show improvement over its prior year’s results). o In case two or more companies tie for the biggest point-improvement in overall score, each company will receive a 1-point Leapfrog Award bonus. o In the rare instance where all companies fail to improve their current scores from one year to the next (indicated by a negative year-to-year change in overall score for all companies in the industry), a Leap Frog bonus is not awarded. o The total bonus points accumulated by each company and the bonus-point- adjusted overall score (including both Bull’s Eye and Leap Frog bonuses) for each company are shown in the bottom section of page 1 of the GLO-BUS Statistical Review where the Overall Game-to-Date company scores appear. • The Bull’s Eye and Leap Frog awards accomplish three worthwhile purposes: 1. Add heightened interest and excitement when the performance outcomes of each decision-making round become available. 2. Spur company co-managers to put more thought and analysis into making accurate projections of upcoming-year outcomes and searching for a strategy and decision combination with the most realistic chance of producing good year-over- year overall improvement (just as occurs in real-world companies). Students will certainly appreciate being rewarded when their efforts to accurately anticipate their company’s performance or to achieve a bigger jump in overall score than rivals are successful. 3. Give grade-conscious company-teams an opportunity to enhance their overall scores via measures outside the five standard simulation scoring variables (EPS, ROE, Stock Price, Credit Rating, and Image Rating). There’s a page on the Industry Scoreboard (p. 3b of the GLO-BUS Statistical Review) devoted exclusively to reporting the bonus points awarded to all companies across all the decision rounds—the accompanying Help pages provide students with detailed explanations of how the Bonus Point awards are calculated. Since the total bonus points accumulated by each company and the bonus-point-adjusted overall score for each company are shown on page 1 of the Footwear Industry Report, all class members and the Instructor can readily track the status and impact of the bonus point awards throughout the simulation exercise. By default, both Bonus Point Awards are enabled when you complete the Course Setup procedure and set up the simulation exercise for your class. However, if you wish, you can disable the awarding of bonus points by unchecking the Bonus Awards box that appears in the Company Performance Grade Book (which is accessed from your Administration Menu). We strongly urge that you utilize the bonus point scoring feature at least initially—even if you are skeptical about its value. We are quite confident that your class members will enthusiastically applaud its use and that you will come to see the merits of the bonus point awards!!!! What to Do If You Decide to Alter the Default Scoring Weights. The “default weights” for the five performance measures on which each company is scored were set at 20% each because a 20% weight for each of the five variables constitutes a “balanced scorecard” that is in reasonably close accord with judging the performance of real-world companies. However, you can alter these weights any time you see fit, using the Simulation Scoring Weights under Grade Books and Scoring in the Administration Menu—the details are presented in the following section. What to Do If You Want to Change the 50-50 Default Weights for the Two Scoring Standards. As explained above, the default weights for the 2 scoring standards in GLO- BUS are 50% for the Investor Expectations Standard and 50% for the Best-in-Industry Standard. Other alternatives include 67%-33%, 33%-67%, 75%-25%, 25%-75%, 80%- 20%, or 20%-80%. Of course, if you want to use just one of the standards, you can place a weight of 100% on that standard and a 0% weight on the other. To select weights other than 50-50, you will need to go to the online grade book, click on the Company Grade Book link, enter the desired weights for the 2 scoring standards in the boxes near the top of the grade book, and press the “Save” button—the weighted average performance scores in the right column of the grade book will automatically be recalculated and the Overall Scores in the Scoreboard box on your Industry Menu page and on each company’s Corporate Lobby page will be based on the new weights. Concluding Comments about Scoring Company Performance. One very important point about the GLO-BUS scoring methodology warrants emphasis: it is a company’s overall score that matters (how close a company scores are to 100-120 in the case of the Investor Expectations Standard and how close they are to 100 in the case of the Best-in-Industry Standard), not whether a company is in first or third or fifth or tenth place. There will always be a last place company, but what is truly telling is whether it is in last place with a score of 85 (which clearly signals a strong performance and a deservedly good grade) or in last place with a score of 37 (which signals a poor performance and possibly a disappointing grade). As a general rule, we think that companies with an overall performance score of 90 or above should get an A on this portion of the GLO-BUS exercise. Companies with an overall performance score of 80-89 should get a B (or better if there are no companies with scores of 90 or more). Companies with an overall performance score of 70-79 above should get a C (or better depending on how many teams have higher scores). You may find it desirable to scale the company performance scores if competition turns out to be so fierce or cutthroat that companies in the industry can’t earn profits that meet investors’ performance expectations. In most of our classes, we end up scaling the performance scores of companies with final scores below 70, but there is usually at least one company with a score above 90 (clearly earning an A) and thus there is little need for scaling the grades on the upper end. You will find that there is plenty of information in the company performance section of your online grade book to decide whether to either alter the scoring weights in a manner that results in higher scores or simply scale the overall performance scores. [Show More]
Last updated: 1 year ago
Preview 1 out of 20 pages
Instant download
Buy this document to get the full access instantly
Instant Download Access after purchase
Add to cartInstant download
Reviews( 0 )
Document information
Connected school, study & course
About the document
Uploaded On
Oct 08, 2021
Number of pages
20
Written in

Additional information
This document has been written for:
Uploaded
Oct 08, 2021
Downloads
0
Views
47