Statistics > STUDY GUIDE > MATH 225N Week 5 Lab Assignment (Version 2) Summer 2019/2020, complete solution guide, Chamberlain. (All)
MATH 225N Week 5 Lab Assignment (Version 2) Summer 2019/2020, complete solution guide, Chamberlain.
Document Content and Description Below
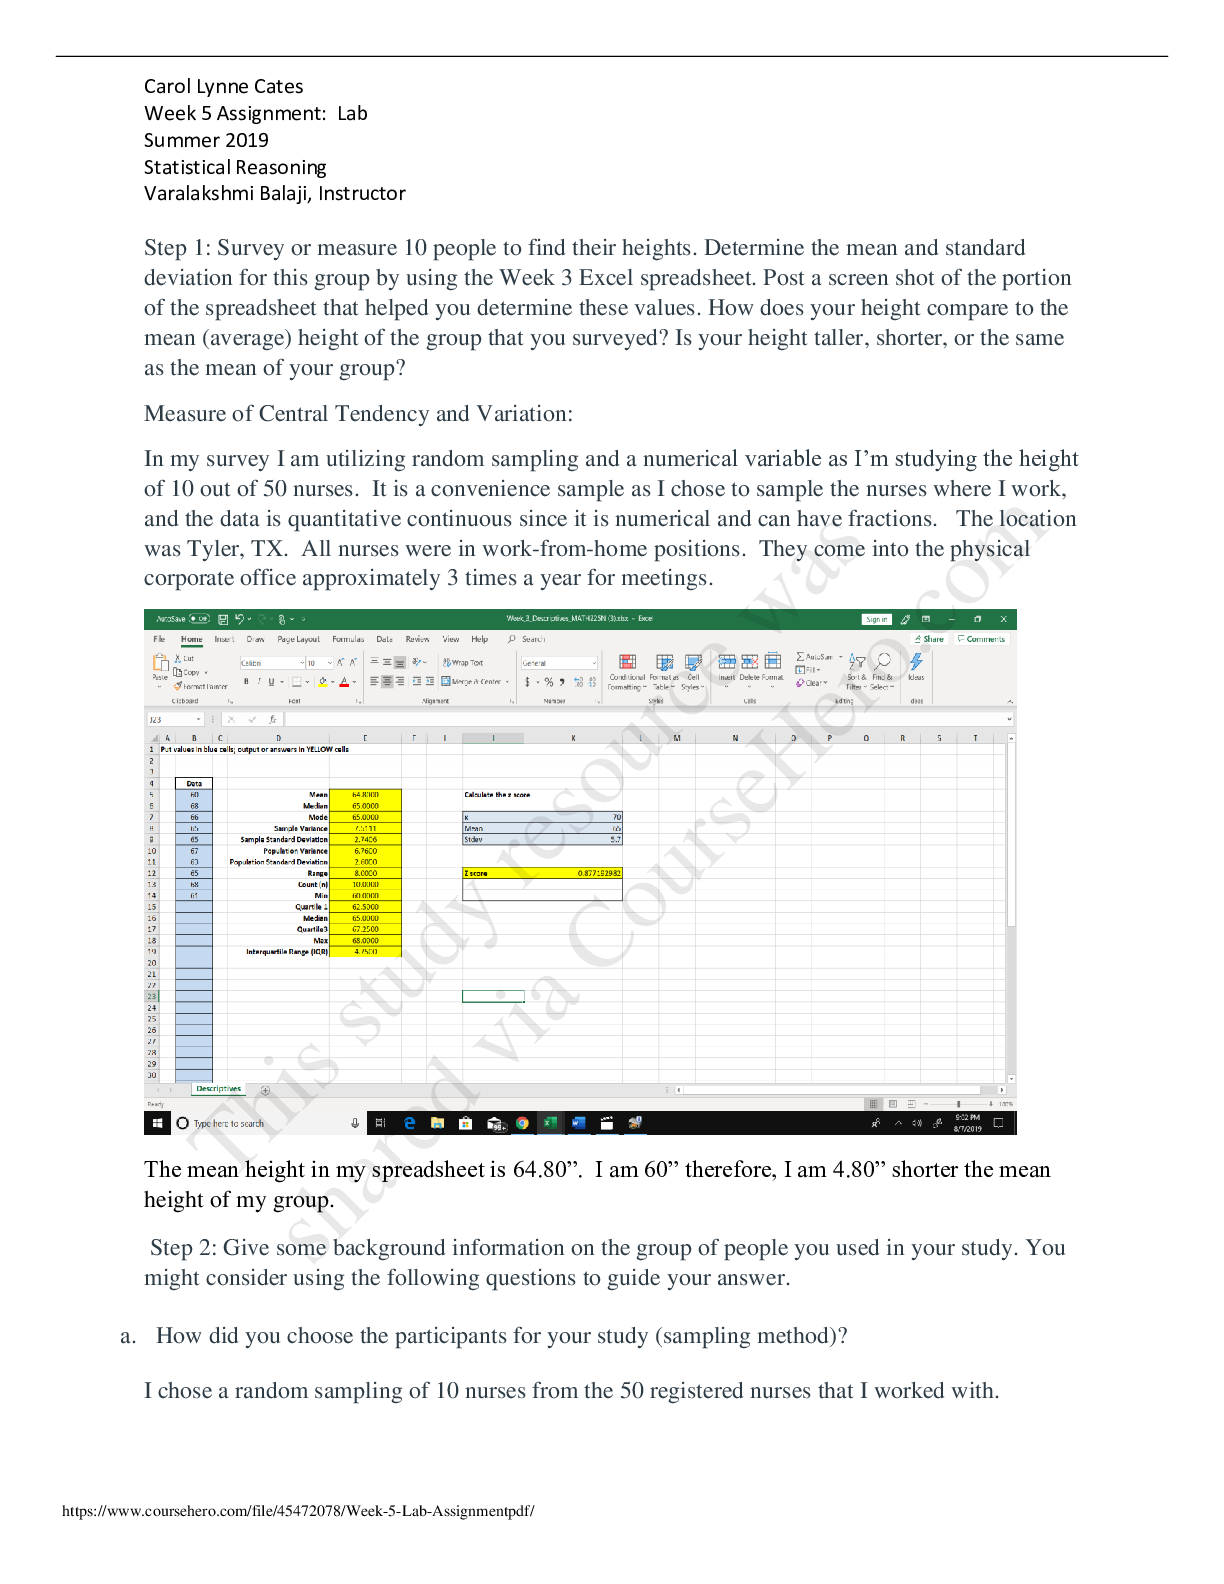
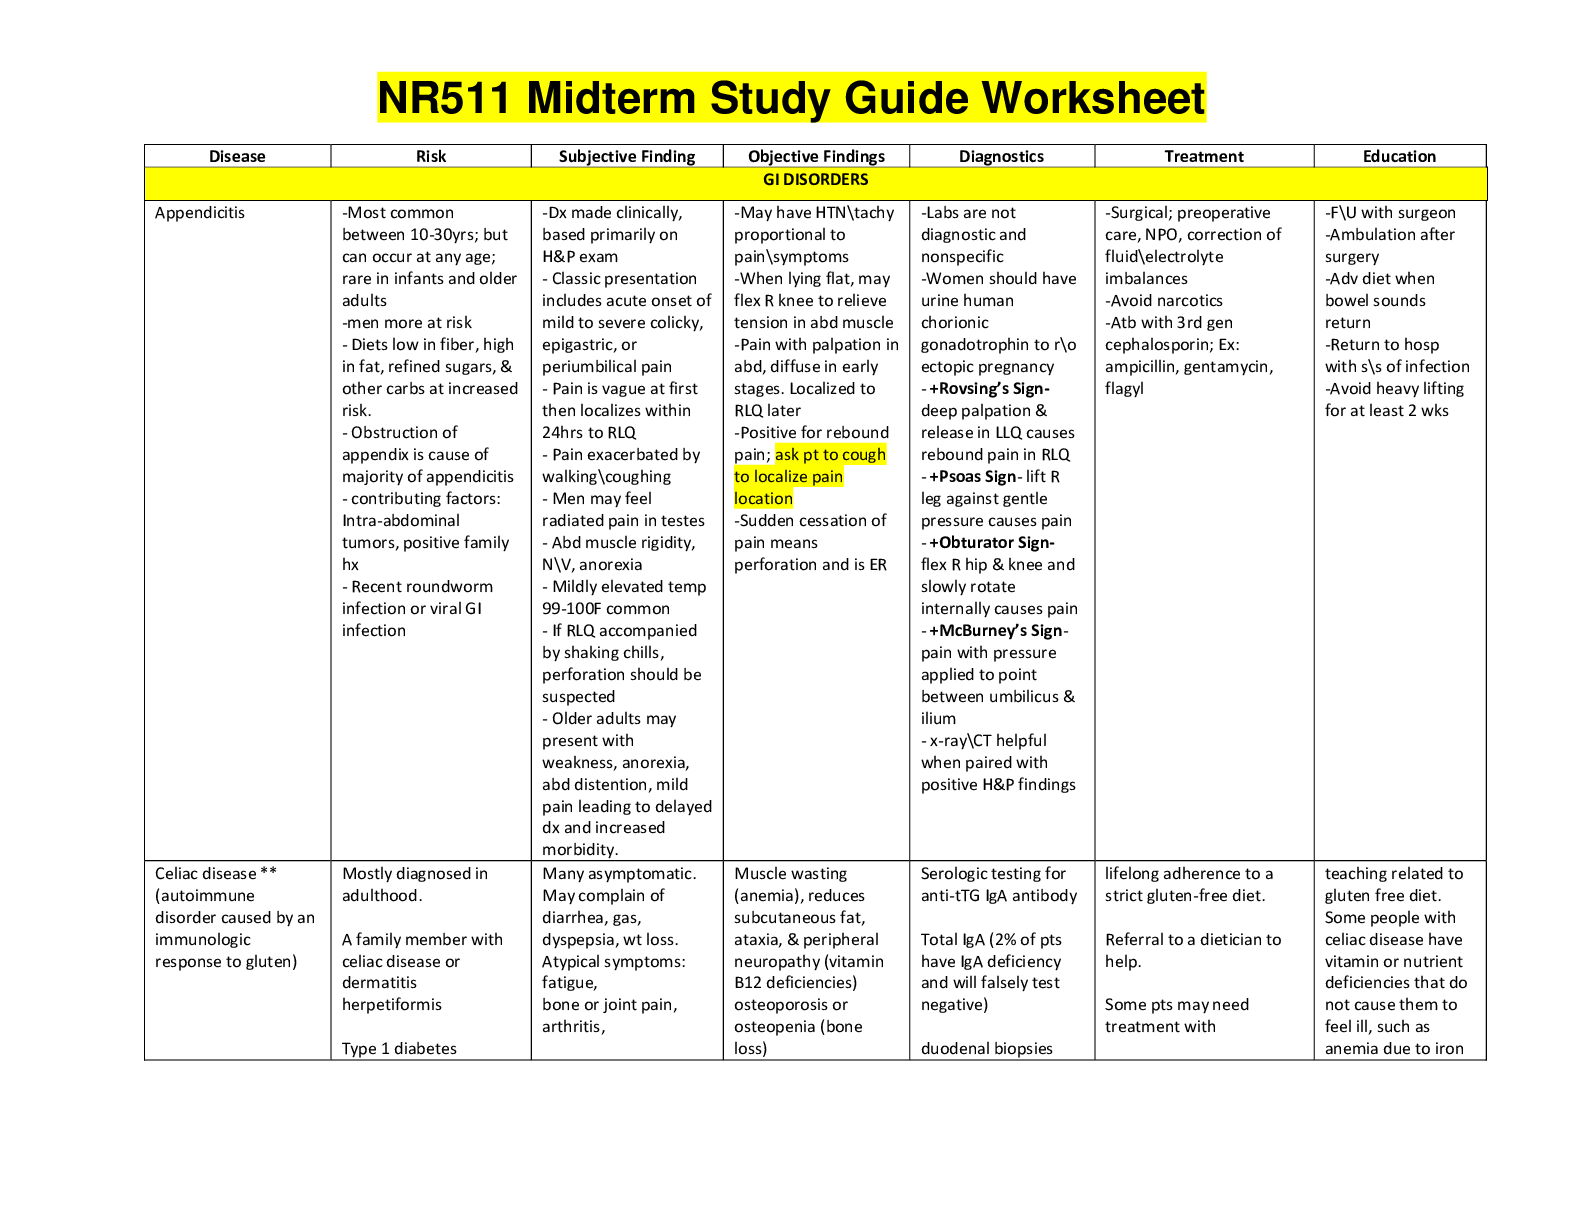
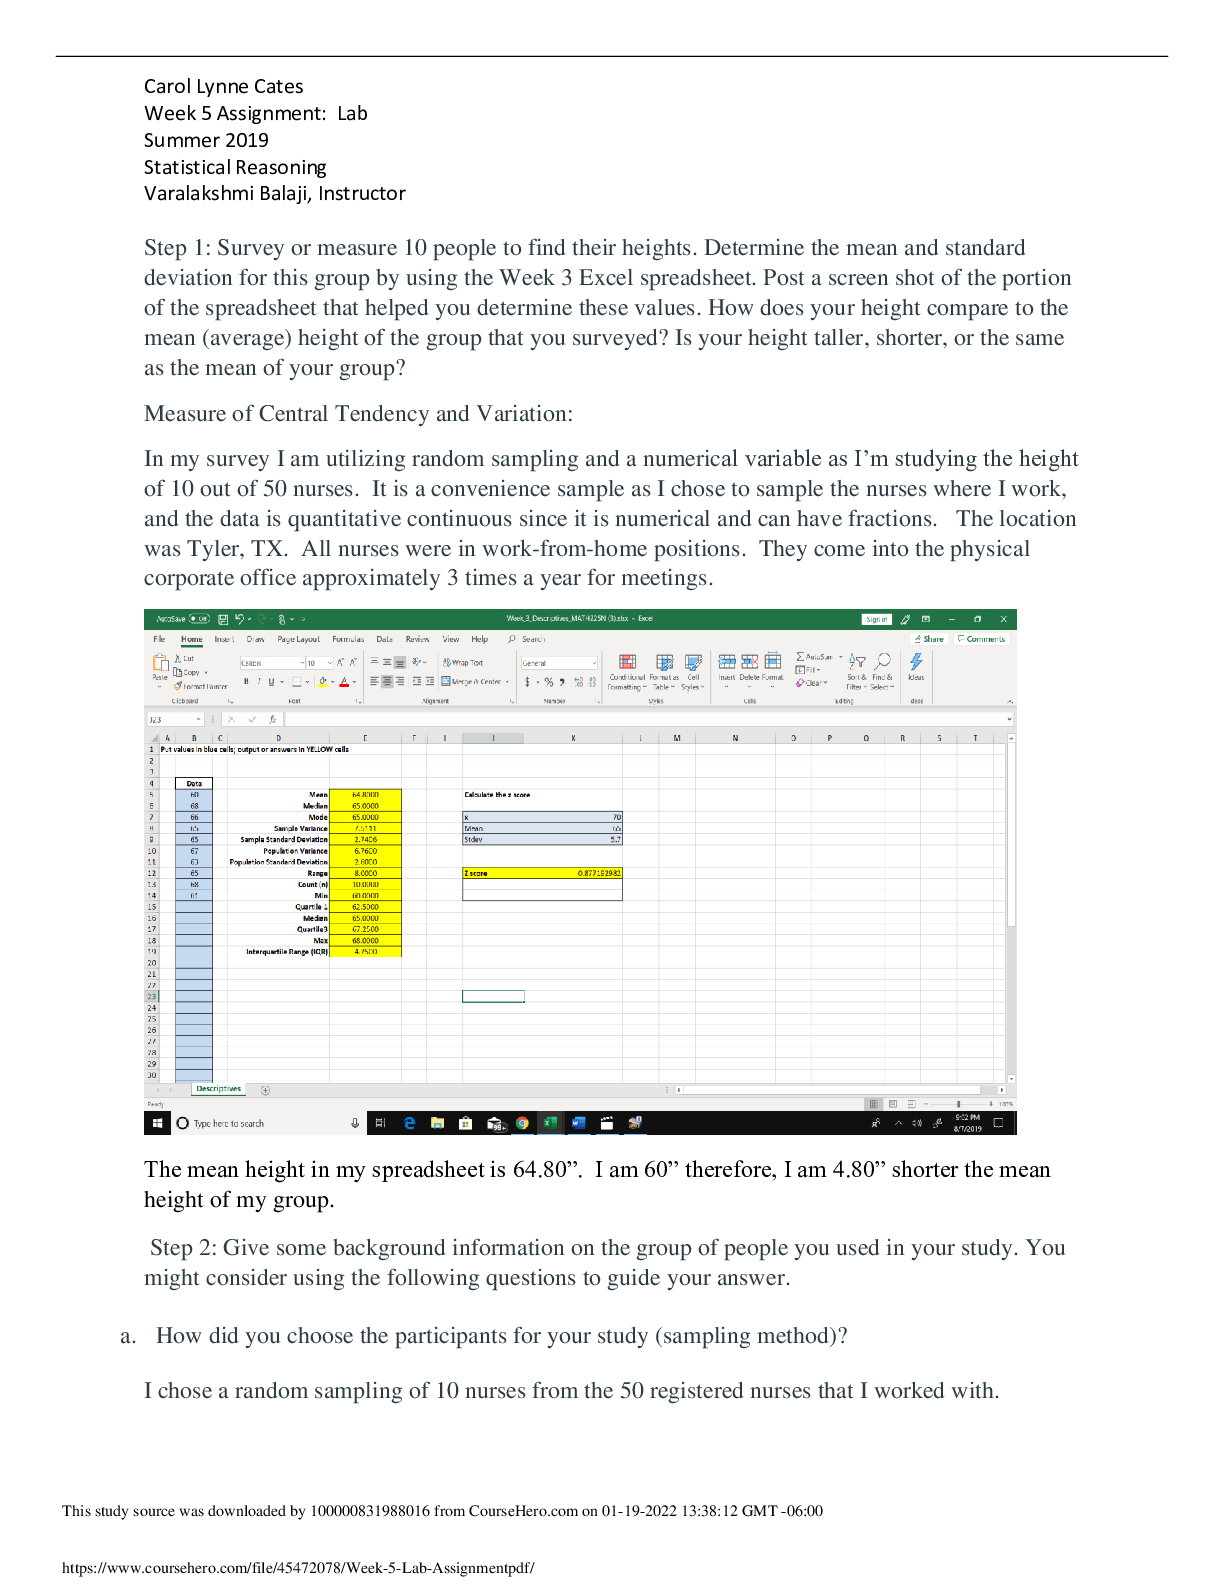
Carol Lynne Cates Week 5 Assignment: Lab Summer 2019 Statistical Reasoning Varalakshmi Balaji, Instructor Step 1: Survey or measure 10 people to find their heights. Determine the mean and standar... d deviation for this group by using the Week 3 Excel spreadsheet. Post a screen shot of the portion of the spreadsheet that helped you determine these values. How does your height compare to the mean (average) height of the group that you surveyed? Is your height taller, shorter, or the same as the mean of your group? Measure of Central Tendency and Variation: In my survey I am utilizing random sampling and a numerical variable as I’m studying the height of 10 out of 50 nurses. It is a convenience sample as I chose to sample the nurses where I work, and the data is quantitative continuous since it is numerical and can have fractions. The location was Tyler, TX. All nurses were in work-from-home positions. They come into the physical corporate office approximately 3 times a year for meetings. The mean height in my spreadsheet is 64.80”. I am 60” therefore, I am 4.80” shorter the mean height of my group. Step 2: Give some background information on the group of people you used in your study. You might consider using the following questions to guide your answer. a. How did you choose the participants for your study (sampling method)? I chose a random sampling of 10 nurses from the 50 registered nurses that I worked with. This study source was downloaded by 100000831988016 from CourseHero.com on 01-19-2022 13:38:12 GMT -06:00 https://www.coursehero.com/file/45472078/Week-5-Lab-Assignmentpdf/ Carol Lynne Cates Week 5 Assignment: Lab Summer 2019 Statistical Reasoning Varalakshmi Balaji, Instructor b. What part of the country did your study take place in? All of the nurses were females and lived in the East Texas area. c. What are the age ranges of your participants? Ages ranged from 36 years old through 61 years old. d. How many of each gender did you have in your study? For this study, I chose only females, therefore there were 10 females. e. What are other interesting factors about your group? All the nurses in my study work from home. They were all white females that had been a nurse for at least 8 years. Eight of the 10 are ADN prepared nurses. Two of the 10 have their BSN. Three of the ADN nurses are currently in school at Chamberlain University working on their BSN. One of the BSN prepared nurses is currently attending a local university where she is working on her MSN. None of the participants were on more than 2 prescription medications. Step 3: Use the Week 5 Excel spreadsheet for the following. a. (Use the Empirical Rule tab from the spreadsheet). Determine the 68%, 95%, and 99.7% values of the Empirical Rule in terms of the ten heights in your height study. 68% fall between 62.1” -67.5” 95% fall between 59.4” – 70.2” 99.7% fall between 56.7” – 72.9” b. What do these values tell you? These values tell me that 68% confidence interval tells that there is 68% chance that true population mean of height will fall between 62.1 to 67.5. 95% confidence interval tells that there is 95% chance that true population mean of height will fall between 59.4 to 70.2 99.7% confidence interval tells that there is 99.7% chance that true population mean of height will fall between 56.7 to 72.9. This study source was downloaded by 100000831988016 from CourseHero.com on 01-19-2022 13:38:12 GMT -06:00 https://www.coursehero.com/file/45472078/Week-5-Lab-Assignmentpdf/ Carol Lynne Cates Week 5 Assignment: Lab Summer 2019 Statistical Reasoning Varalakshmi Balaji, Instructor Post a screen shot of your work from the Week 5 Excel spreadsheet. c. (Use the normal probability tab from the spreadsheet). Based on your study results, what percent of the study participants are shorter than you? What percent are taller than you? My height is 60”. 4% of the relevant population is shorter than me and 96% of the population is taller than me. d. Post a screen shot of your work from the Week 5 Excel spreadsheet [Show More]
Last updated: 1 year ago
Preview 1 out of 4 pages

Reviews( 0 )
Document information
Connected school, study & course
About the document
Uploaded On
Jan 19, 2022
Number of pages
4
Written in

Additional information
This document has been written for:
Uploaded
Jan 19, 2022
Downloads
0
Views
107