Statistics > EXAM > MATH 225N - Statistical Reasoning For The Health Sciences Final Exam, Graded A. (All)
MATH 225N - Statistical Reasoning For The Health Sciences Final Exam, Graded A.
Document Content and Description Below
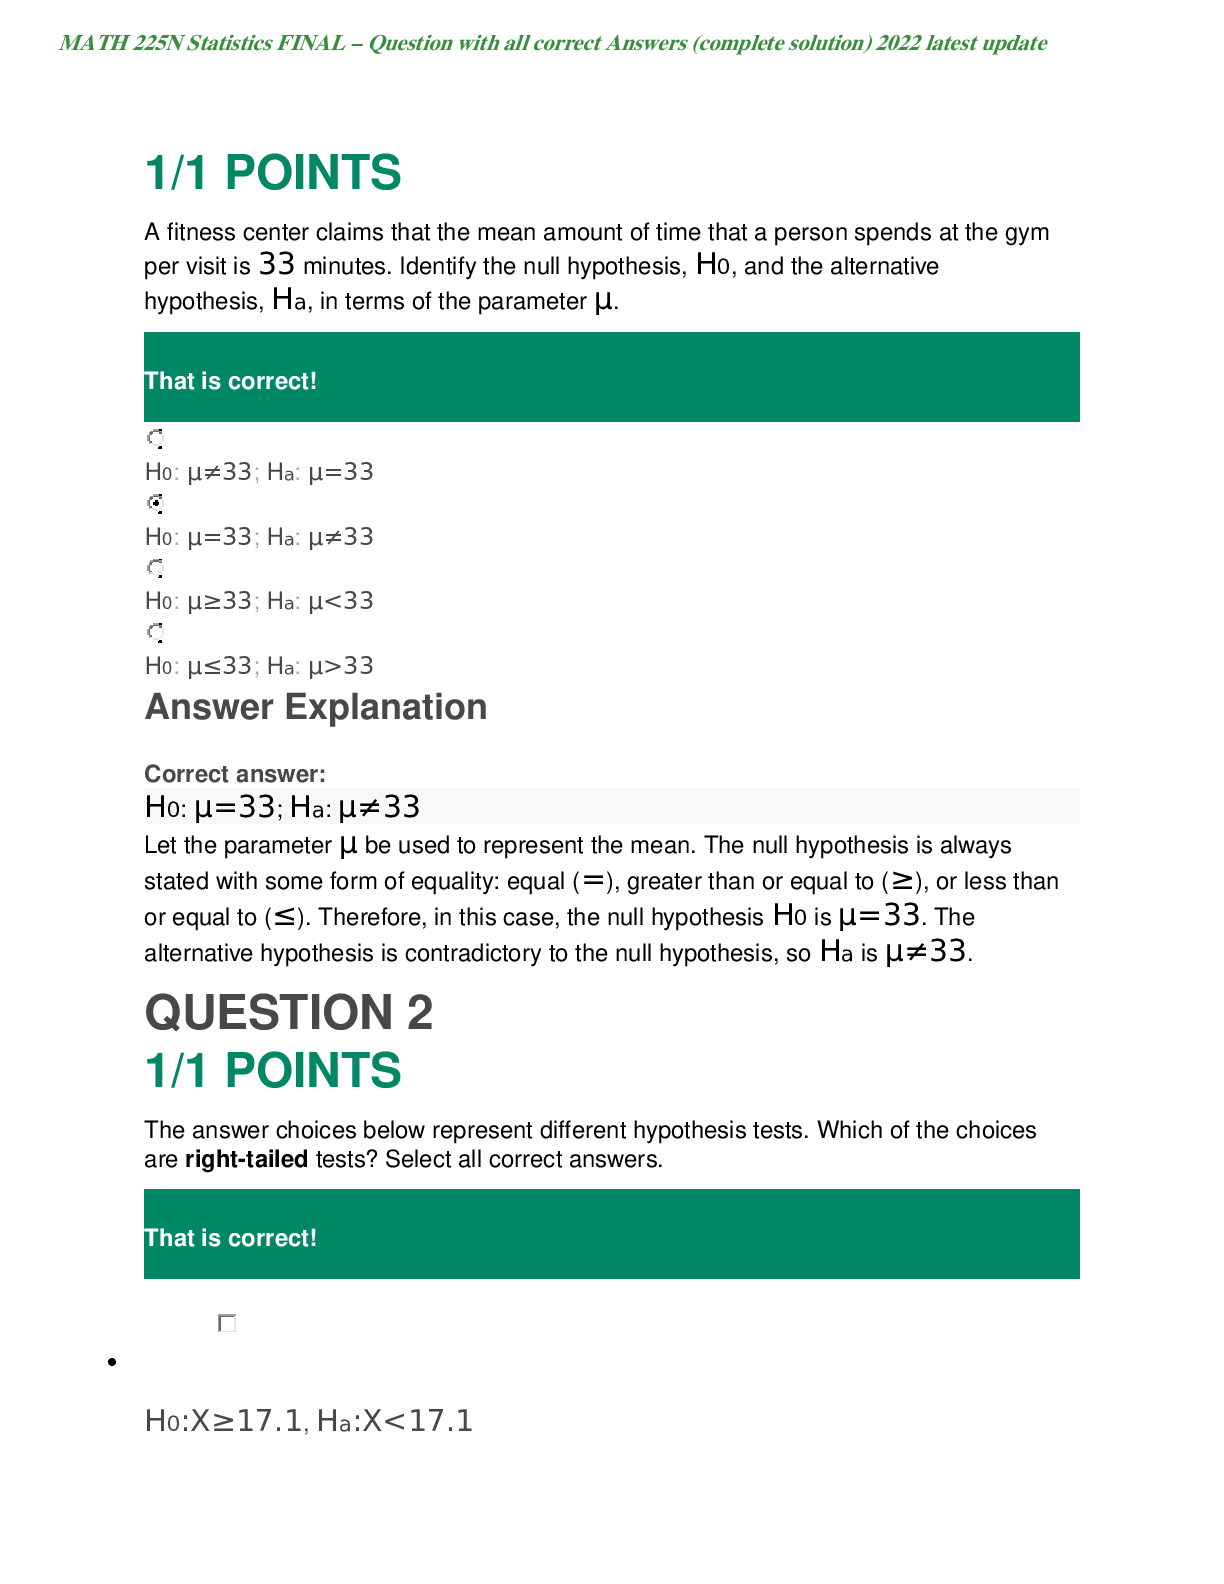
A fitness center claims that the mean amount of time that a person spends at the gym per visit is 33 minutes. Identify the null hypothesis, H0, and the alternative hypothesis, Ha, in terms of the pa... rameter μ. That is correct! H0: μ≠33; Ha: μ=33 H0: μ=33; Ha: μ≠33 H0: μ≥33; Ha: μ<33 H0: μ≤33; Ha: μ>33 Answer Explanation Correct answer: H0: μ=33; Ha: μ≠33 Let the parameter μ be used to represent the mean. The null hypothesis is always stated with some form of equality: equal (=), greater than or equal to (≥), or less than or equal to (≤). Therefore, in this case, the null hypothesis H0 is μ=33. The alternative hypothesis is contradictory to the null hypothesis, so Ha is μ≠33. QUESTION 2 1/1 POINTS The answer choices below represent different hypothesis tests. Which of the choices are right-tailed tests? Select all correct answers. That is correct! H0:X≥17.1, Ha:X<17.1 H0:X=14.4, Ha:X≠14.4 H0:X≤3.8, Ha:X>3.8 H0:X≤7.4, Ha:X>7.4 H0:X=3.3, Ha:X≠3.3 Answer Explanation Correct answer: H0:X≤3.8, Ha:X>3.8 H0:X≤7.4, Ha:X>7.4 Remember the forms of the hypothesis tests. Right-tailed: H0:X≤X0, Ha:X>X0. Left-tailed: H0:X≥X0, Ha:X<X0. Two-tailed: H0:X=X0, Ha:X≠X0. So in this case, the right-tailed tests are: H0:X≤7.4, Ha:X>7.4 H0:X≤3.8, Ha:X>3.8 QUESTION 3 0/1 POINTS Find the Type II error given that the null hypothesis, H0, is: a building inspector claims that no more than 15% of structures in the county were built without permits. That's not right. The building inspector thinks that no more than 15% of the structures in the county were built without permits when, in fact, no more than 15% of the structures really were built without permits. The building inspector thinks that more than 15% of the structures in the county were built without permits when, in fact, more than 15% of the structures really were built without permits. The building inspector thinks that more than 15% of the structures in the county were built without permits when, in fact, at most 15% of the structures were built without permits. The building inspector thinks that no more than 15% of the structures in the county were built without permits when, in fact, more than 15% of the structures were built without permits. Answer Explanation Correct answer: The building inspector thinks that no more than 15% of the structures in the county were built without permits when, in fact, more than 15% of the structures were built without permits. A Type II error is the decision not to reject the null hypothesis when, in fact, it is false. In this case, the Type II error is when the building inspector thinks that no more than 15% of the structures were built without permits when, in fact, more than 15% of the structures were built without permits. Your answer: The building inspector thinks that more than 15% of the structures in the county were built without permits when, in fact, at most 15% of the structures were built without permits. Content attribution- Opens a dialog QUESTION 4 1/1 POINTS Suppose a chef claims that her meatball weight is less than 4 ounces, on average. Several of her customers do not believe her, so the chef decides to do a hypothesis test, at a 10% significance level, to persuade them. She cooks 14 meatballs. The mean weight of the sample meatballs is 3.7 ounces. The chef knows from experience that the standard deviation for her meatball weight is 0.5 ounces. H0: μ≥4; Ha: μ<4 α=0.1 (significance level) What is the test statistic (z-score) of this one-mean hypothesis test, rounded to two decimal places? That is correct! $$Test statistic = −2.24 Answer Explanation Correct answers: $\text{Test statistic = }-2.24$Test statistic = −2.24 The hypotheses were chosen, and the significance level was decided on, so the next step in hypothesis testing is to compute the test statistic. In this scenario, the sample mean weight, x¯=3.7. The sample the chef uses is 14 meatballs, so n=14. She knows the standard deviation of the meatballs, σ=0.5. Lastly, the chef is comparing the population mean weight to 4 ounces. So, this value (found in the null and alternative hypotheses) is μ0. Now we will substitute the values into the formula to compute the test statistic: z0=x¯−μ0σn√=3.7−40.514√≈−0.30.134≈−2.24 So, the test statistic for this hypothesis test is z0=−2.24. QUESTION 5 1/1 POINTS What is the p-value of a right-tailed one-mean hypothesis test, with a test statistic of z0=1.74? (Do not round your answer; compute your answer using a value from the table below.) z1.51.61.71.81.90.000.9330.9450.9550.9640.9710.010.9340.9460.9560.965 0.9720.020.9360.9470.9570.9660.9730.030.9370.9480.9580.9660.9730.040. 9380.9490.9590.9670.9740.050.9390.9510.9600.9680.9740.060.9410.9520. 9610.9690.9750.070.9420.9530.9620.9690.9760.080.9430.9540.9620.9700. 9760.090.9440.9540.9630.9710.977 That is correct! $$0.041 Answer Explanation Correct answers: $0.041$0.041 The p-value is the probability of an observed value of z=1.74 or greater if the null hypothesis is true, because this hypothesis test is right-tailed. This probability is equal to the area under the Standard Normal curve to the right of z=1.74. A standard normal curve with two points labeled on the horizontal axis. The mean is labeled at 0.00 and an observed value of 1.74 is labeled. The area under the curve and to the right of the observed value is shaded. Using the Standard Normal Table, we can see that the p-value is equal to 0.959, which is the area to the left of z=1.74. (Standard Normal Tables give areas to the left.) So, the p-value we're looking for is p=1−0.959=0.041. QUESTION 6 1/1 POINTS Kenneth, a competitor in cup stacking, claims that his average stacking time is 8.2 seconds. During a practice session, Kenneth has a sample stacking time mean of 7.8 seconds based on 11 trials. At the 4% significance level, does the data provide sufficient evidence to conclude that Kenneth's mean stacking time is less than 8.2 seconds? Accept or reject the hypothesis given the sample data below. H0:μ=8.2 seconds; Ha:μ<8.2 seconds α=0.04 (significance level) z0=−1.75 p=0.0401 That is correct! Do not reject the null hypothesis because the p-value 0.0401 is greater than the significance level α=0.04. Reject the null hypothesis because the p-value 0.0401 is greater than the significance level α=0.04. Reject the null hypothesis because the value of z is negative. Reject the null hypothesis because |−1.75|>0.04. Do not reject the null hypothesis because |−1.75|>0.04. Answer Explanation Correct answer: Do not reject the null hypothesis because the p-value 0.0401 is greater than the significance level α=0.04. In making the decision to reject or not reject H0, if α>p-value, reject H0 because the results of the sample data are significant. There is sufficient evidence to conclude that H0 is an incorrect belief and that the alternative hypothesis, Ha, may be correct. If α≤p-value, do not reject H0. The results of the sample data are not significant, so there is not sufficient evidence to conclude that the alternative hypothesis, Ha, may be correct. In this case, α=0.04 is less than or equal to p=0.0401, so the decision is to not reject the null hypothesis. QUESTION 7 1/1 POINTS A recent study suggested that 81% of senior citizens take at least one prescription medication. Amelia is a nurse at a large hospital who would like to know whether the percentage is the same for senior citizen patients who go to her hospital. She randomly selects 59 senior citizens patients who were treated at the hospital and finds that 49 of them take at least one prescription medication. What are the null and alternative hypotheses for this hypothesis test? That is correct! {H0:p=0.81Ha:p>0.81 {H0:p≠0.81Ha:p=0.81 {H0:p=0.81Ha:p<0.81 {H0:p=0.81Ha:p≠0.81 Answer Explanation Correct answer: {H0:p=0.81Ha:p≠0.81 First verify whether all of the conditions have been met. Let p be the population proportion for the senior citizen patients treated at Amelia's hospital who take at least one prescription medication. 1. Since there are two independent outcomes for each trial, the proportion follows a binomial model. 2. The question states that the sample was collected randomly. 3. The expected number of successes, np=47.79, and the expected number of failures, nq=n(1−p)=11.21, are both greater than or equal to 5. Since Amelia is testing whether the proportion is the same, the null hypothesis is that p is equal to 0.81 and the alternative hypothesis is that p is not equal to 0.81. The null and alternative hypotheses are shown below. {H0:p=0.81Ha:p≠0.81 QUESTION 8 1/1 POINTS A researcher claims that the proportion of cars with manual transmission is less than 10%. To test this claim, a survey checked 1000 randomly selected cars. Of those cars, 95 had a manual transmission. The following is the setup for the hypothesis test: {H0:p=0.10Ha:p<0.10 Find the test statistic for this hypothesis test for a proportion. Round your answer to 2 decimal places. That is correct! $$Test_Statistic=−0.53 Answer Explanation Correct answers: $\text{Test_Statistic}=-0.53$Test_Statistic=−0.53 The proportion of successes is p^=951000=0.095. The test statistic is calculated as follows: z=p^−p0p0⋅ (1−p0)n−−−−−−√ z=0.095−0.100.10⋅ (1−0.10)1000−−−−−−−−√ z≈−0.53 QUESTION 9 1/1 POINTS A medical researcher claims that the proportion of people taking a certain medication that develop serious side effects is 12%. To test this claim, a random sample of 900 people taking the medication is taken and it is determined that 93 people have experienced serious side effects. . The following is the setup for this hypothesis test: H0:p = 0.12 Ha:p ≠ 0.12 Find the p-value for this hypothesis test for a proportion and round your answer to 3 decimal places. The following table can be utilized which provides areas under the Standard Normal Curve: z 0.00 0.01 0.02 0.03 0.04 0.05 0.06 0.07 0.08 0.09 -1.8 0.036 0.035 0.034 0.034 0.033 0.032 0.031 0.031 0.030 0.029 -1.7 0.045 0.044 0.043 0.042 0.041 0.040 0.039 0.038 0.038 0.037 -1.6 0.055 0.054 0.053 0.052 0.051 0.049 0.048 0.047 0.046 0.046 -1.5 0.067 0.066 0.064 0.063 0.062 0.061 0.059 0.058 0.057 0.056 -1.4 0.081 0.079 0.078 0.076 0.075 0.074 0.072 0.071 0.069 0.068 That is correct! $$P-value=0.124 Answer Explanation Correct answers: $\text{P-value=}0.124$P-value=0.124 Here are the steps needed to calculate the p-value for a hypothesis test for a proportion: 1. Determine if the hypothesis test is left tailed, right tailed, or two tailed. 2. Compute the value of the test statistic. 3. If the hypothesis test is left tailed, the p-value will be the area under the standard normal curve to the left of the test statistic z0 If the test is right tailed, the p-value will be the area under the standard normal curve to the right of the test statistic z0 If the test is two tailed, the p-value will be the area to the left of −|z0| plus the area to the right of |z0| under the standard normal curve For this example, the test is a two tailed test and the test statistic, rounding to two decimal places, is z=0.1033−0.120.12(1−0.12)900−−−−−−−−−−−−√≈−1.54. Thus the p-value is the area under the Standard Normal curve to the left of a z-score of -1.54, plus the area under the Standard Normal curve to the right of a z-score of 1.54. z 0.00 0.01 0.02 0.03 0.04 0.05 0.06 0.07 0.08 0.09 -1.8 0.036 0.035 0.034 0.034 0.033 0.032 0.031 0.031 0.030 0.029 -1.7 0.045 0.044 0.043 0.042 0.041 0.040 0.039 0.038 0.038 0.037 -1.6 0.055 0.054 0.053 0.052 0.051 0.049 0.048 0.047 0.046 0.046 -1.5 0.067 0.066 0.064 0.063 0.062 0.061 0.059 0.058 0.057 0.056 -1.4 0.081 0.079 0.078 0.076 0.075 0.074 0.072 0.071 0.069 0.068 From a lookup table of the area under the Standard Normal curve, the corresponding area is then 2(0.062) = 0.124. QUESTION 10 1/1 POINTS An economist claims that the proportion of people who plan to purchase a fully electric vehicle as their next car is greater than 65%. To test this claim, a random sample of 750 people are asked if they plan to purchase a fully electric vehicle as their next car Of these 750 people, 513 indicate that they do plan to purchase an electric vehicle. The following is the setup for this hypothesis test: H0:p=0.65 Ha:p>0.65 In this example, the p-value was determined to be 0.026. Come to a conclusion and interpret the results for this hypothesis test for a proportion (use a significance level of 5%.) That is correct! The decision is to reject the Null Hypothesis. The conclusion is that there is enough evidence to support the claim. The decision is to fail to reject the Null Hypothesis. The conclusion is that there is not enough evidence to support the claim. Answer Explanation Correct answer: The decision is to reject the Null Hypothesis. The conclusion is that there is enough evidence to support the claim. To come to a conclusion and interpret the results for a hypothesis test for proportion using the P-Value Approach, the first step is to compare the p-value from the sample data with the level of significance. The decision criteria is then as follows: If the p-value is less than or equal to the given significance level, then the null hypothesis should be rejected. So, if p≤α, reject H0; otherwise fail to reject H0. When we have made a decision about the null hypothesis, it is important to write a thoughtful conclusion about the hypotheses in terms of the given problem's scenario. Assuming the claim is the null hypothesis, the conclusion is then one of the following: if the decision is to reject the null hypothesis, then the conclusion is that there is enough evidence to reject the claim. if the decision is to fail to reject the null hypothesis, then the conclusion is that there is not enough evidence to reject the claim. Assuming the claim is the alternative hypothesis, the conclusion is then one of the following: if the decision is to reject the null hypothesis, then the conclusion is that there is enough evidence to support the claim. if the decision is to fail to reject the null hypothesis, then the conclusion is that there is not enough evidence to support the claim. In this example, the p-value = 0.026. We then compare the p-value to the level of significance to come to a conclusion for the hypothesis test. In this example, the p-value is less than the level of significance which is 0.05. Since the p-value is greater than the level of significance, the conclusion is to reject the null hypothesis. [Show More]
Last updated: 1 year ago
Preview 1 out of 63 pages
Reviews( 0 )
Document information
Connected school, study & course
About the document
Uploaded On
Oct 15, 2020
Number of pages
63
Written in

Additional information
This document has been written for:
Uploaded
Oct 15, 2020
Downloads
2
Views
118


; Answered.png)
COMPLETE SOLUTION KAPLAN UNIVERSITY.png)

 (1).png)
.png)