Statistics > QUESTIONS & ANSWERS > MATH 225N MATH Week 7 Hypothesis Testing Questions and Answers. Complete(Graded A) (All)
MATH 225N MATH Week 7 Hypothesis Testing Questions and Answers. Complete(Graded A)
Document Content and Description Below
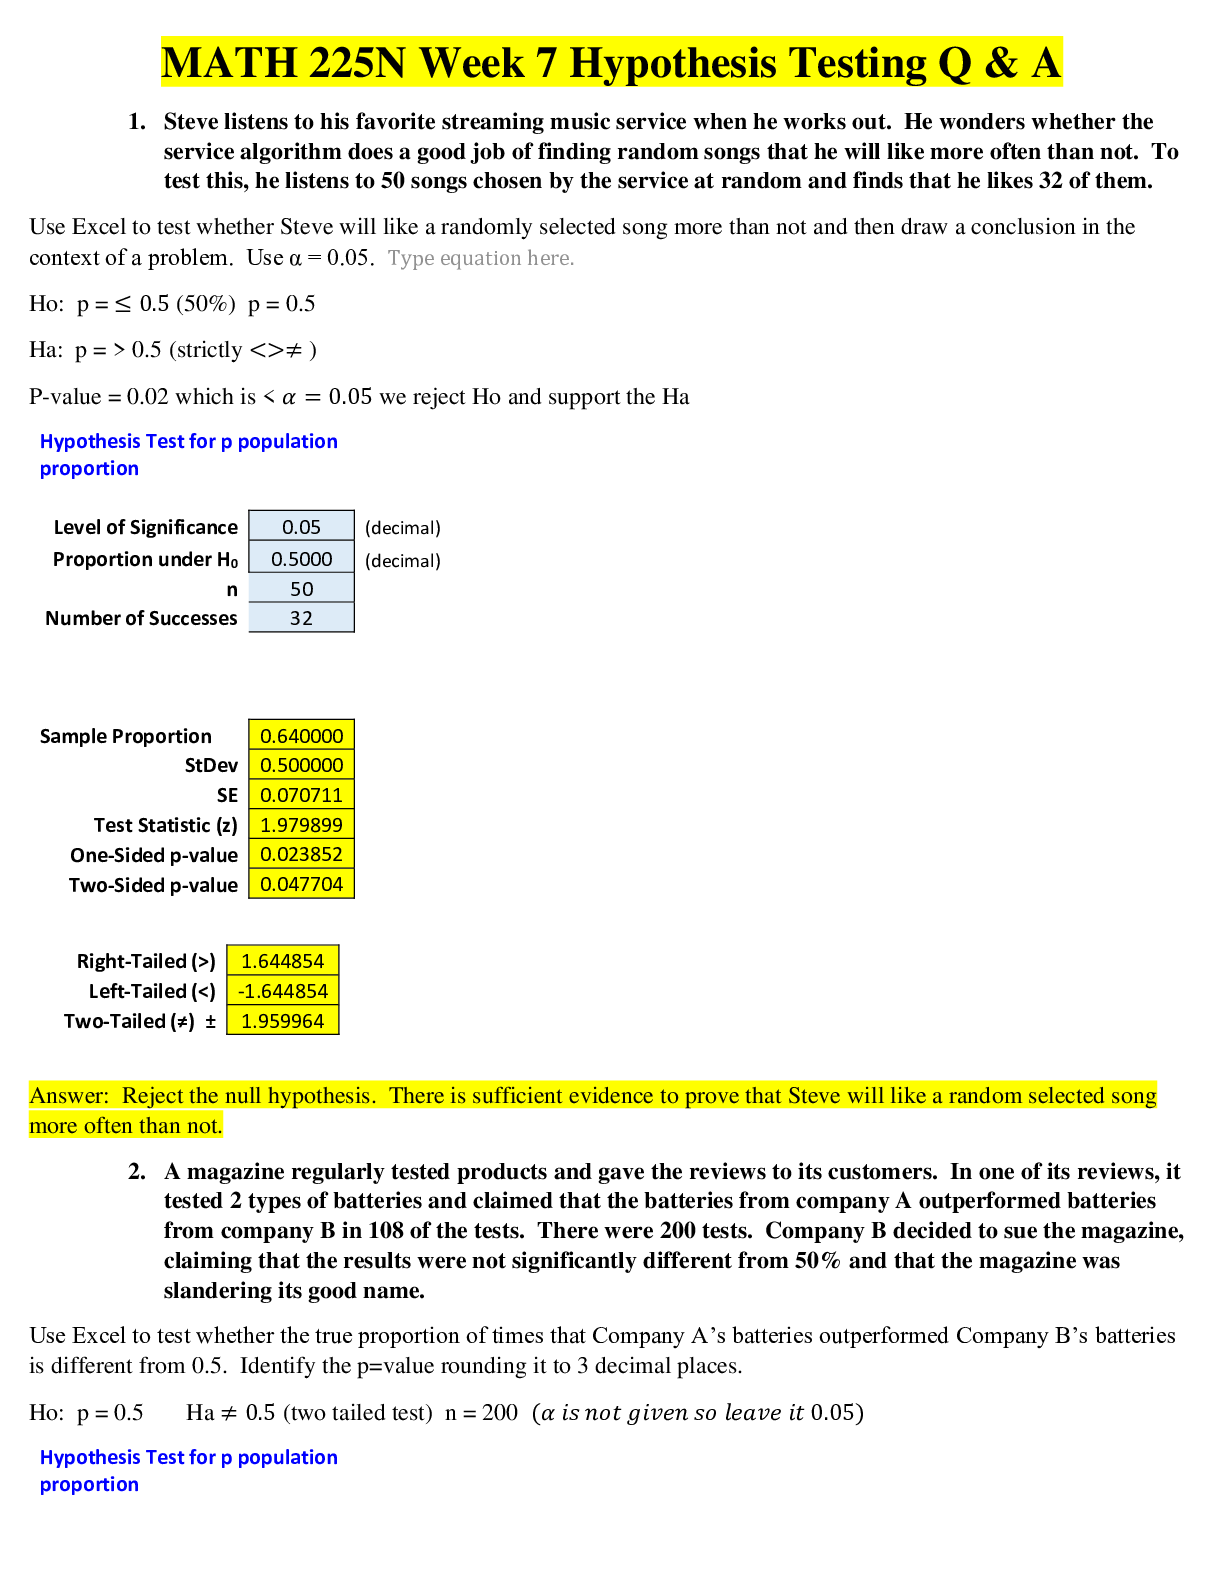
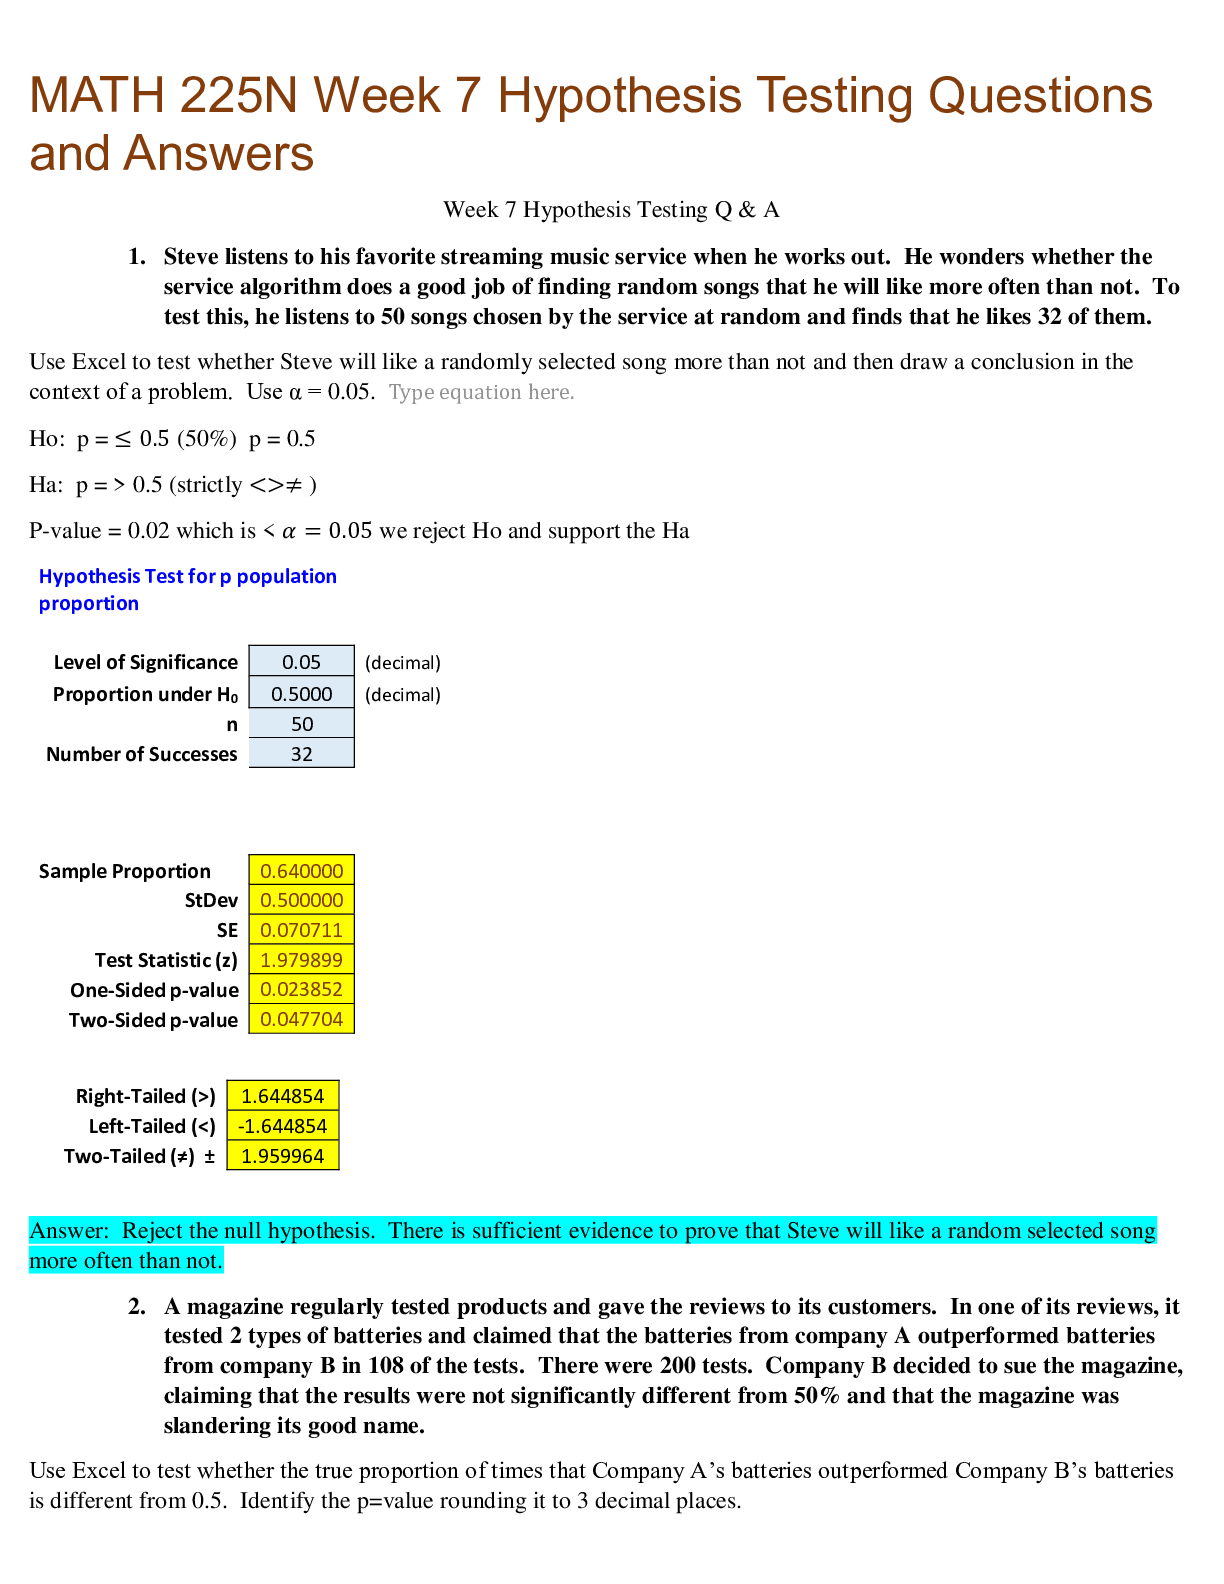
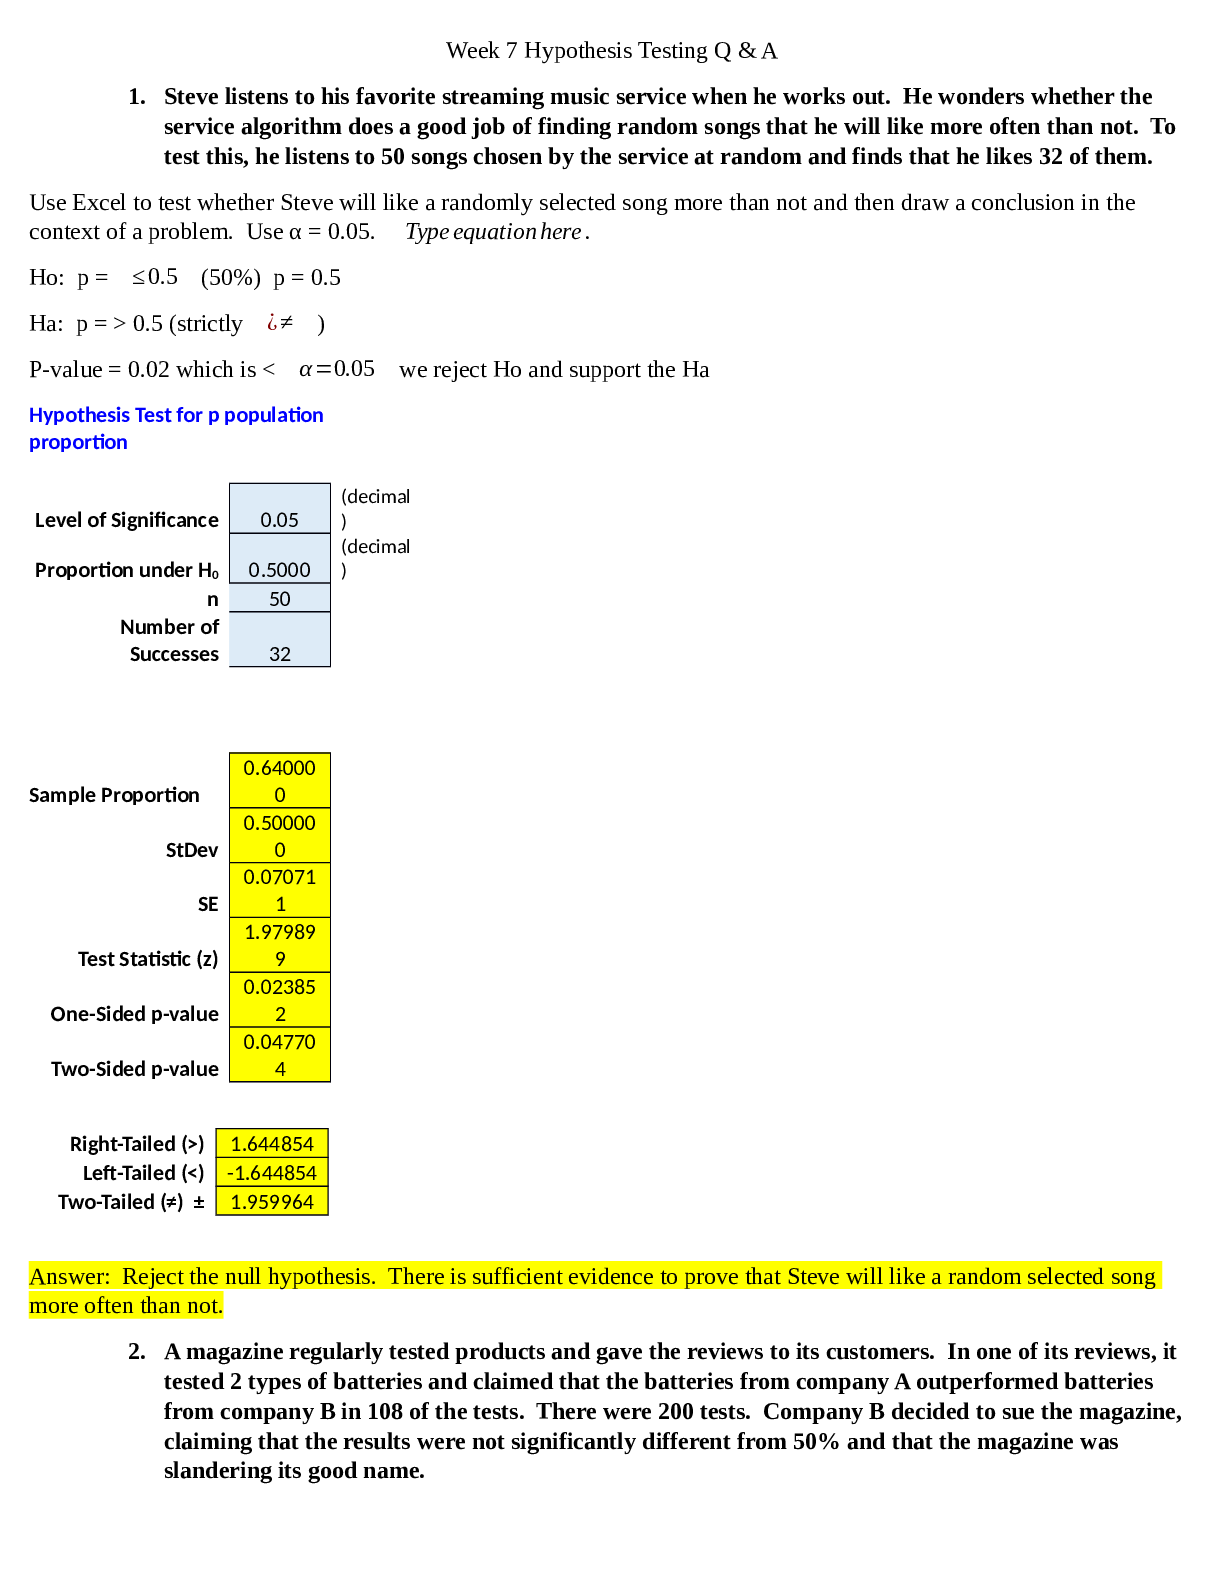
Steve listens to his favorite streaming music service when he works out. He wonders whether the service algorithm does a good job of finding random songs that he will like more often than not. To te... st this, he listens to 50 songs chosen by the service at random and finds that he likes 32 of them. Use Excel to test whether Steve will like a randomly selected song more than not and then draw a conclusion in the context of a problem. Use α = 0.05. Type equation here. Ho: p = ≤ 0.5 (50%) p = 0.5 Ha: p = > 0.5 (strictly <>≠ ) P-value = 0.02 which is < ? = 0.05 we reject Ho and support the Ha Hypothesis Test for p population proportion Level of Significance 0.05 (decimal) Proportion under H0 0.5000 (decimal) n 50 Number of Successes 32 Sample Proportion 0.640000 StDev 0.500000 SE 0.070711 Test Statistic (z) 1.979899 One-Sided p-value 0.023852 Two-Sided p-value 0.047704 Right-Tailed (>) 1.644854 Left-Tailed (<) -1.644854 Two-Tailed (≠) ± 1.959964 Answer: Reject the null hypothesis. There is sufficient evidence to prove that Steve will like a random selected song more often than not. 2. A magazine regularly tested products and gave the reviews to its customers. In one of its reviews, it tested 2 types of batteries and claimed that the batteries from company A outperformed batteries from company B in 108 of the tests. There were 200 tests. Company B decided to sue the magazine, claiming that the results were not significantly different from 50% and that the magazine was slandering its good name. Use Excel to test whether the true proportion of times that Company A’s batteries outperformed Company B’s batteries is different from 0.5. Identify the p=value rounding it to 3 decimal places. Ho: p = 0.5 Ha ≠ 0.5 (two tailed test) n = 200 (? ?? ??? ????? ?? ????? ?? 0.05) Hypothesis Test for p population proportion Level of Significance 0.05 Proportion under H0 0.5000 n 200 Number of Successes 108 Sample Proportion 0.540000 StDev 0.500000 SE 0.035355 Test Statistic (z) 1.131371 One-Sided p-value 0.129238 Two-Sided p-value 0.258476 Right-Tailed (>) 1.644854 Left-Tailed (<) -1.644854 Two-Tailed (≠) ± 1.959964 Answer: 0.258 (because it is a two tailed test). We are not rejecting the null hypothesis and we do not have evidence to support the alternative hypothesis. 3. A candidate in an election lost by 5.8% of the vote. The candidate sued the state and said that more than 5.8% of the ballots were defective and not counted by the voting machine, so a full recount would need to be done. His opponent wanted to ask for the case to be dismissed, so she had a government official from the state randomly select 500 ballots and count how many were defective. The official found 21 defective ballots. Use Excel to test if the candidates claim is true and that < 5.8% of the ballots were defective. Identify the p=value rounding to 3 decimal places. Ho: p = ≥ 0.058 Ha < 0.058 (one tailed test) n = 500 (? ?? ??? ????? ?? ????? ?? 0.05) Hypothesis Test for p population proportion Level of Significance 0.05 (decimal) Proportion under H0 0.0580 (decimal) n 500 Number of Successes 21 Sample Proportion 0.042000 StDev 0.233743 SE 0.010453 Test Statistic (z) - 1.530613 One-Sided p-value 0.063008 Two-Sided p-value 0.126016 Right-Tailed (>) 1.644854 Left-Tailed (<) -1.644854 Two-Tailed (≠) ± 1.959964 Answer: 0.063 4. A researcher claims that the incidence of a certain type of cancer is < 5%. To test this claim, a random sample of 4000 people are checked and 170 are found to have the cancer. The following is the set up for the hypothesis: Ho = 0.05 Ha = < 0.05 In the example the p-value was determined to be 0.015. Come to a conclusion and interpret the results of this hypothesis test for a proportion (use a significance level of 5%) Answer: The decision is to reject the null hypothesis. The conclusion is that there is enough evidence to support the claim. 5. A researcher is investigating a government claim that the unemployment rate is < 5%. TO test this claim, a random sample of 1500 people is taken and it is determined that 61 people were unemployed. Ho: p = 0.05 Ha: p < 0.05 Find the p-value for this hypothesis test for a proportion & round to 3 decimal places. Hypothesis Test for p population proportion Level of Significance 0.05 Proportion under H0 0.0500 n 1500 Number of Successes 61 Sample Proportion 0.040667 StDev 0.217945 SE 0.005627 Test Statistic (z) - 1.658577 One-Sided p-value 0.048457 Two-Sided p-value 0.096914 Answer: 0.048 [Show More]
Last updated: 1 year ago
Preview 1 out of 30 pages
Instant download
Buy this document to get the full access instantly
Instant Download Access after purchase
Add to cartInstant download
Reviews( 0 )
Document information
Connected school, study & course
About the document
Uploaded On
Oct 15, 2020
Number of pages
30
Written in

Additional information
This document has been written for:
Uploaded
Oct 15, 2020
Downloads
0
Views
70


 (1).png)