Mathematics > QUESTIONS & ANSWERS > MAT 240 Module One Problem Set - Questions with Verified Answers (All)
MAT 240 Module One Problem Set - Questions with Verified Answers
Document Content and Description Below
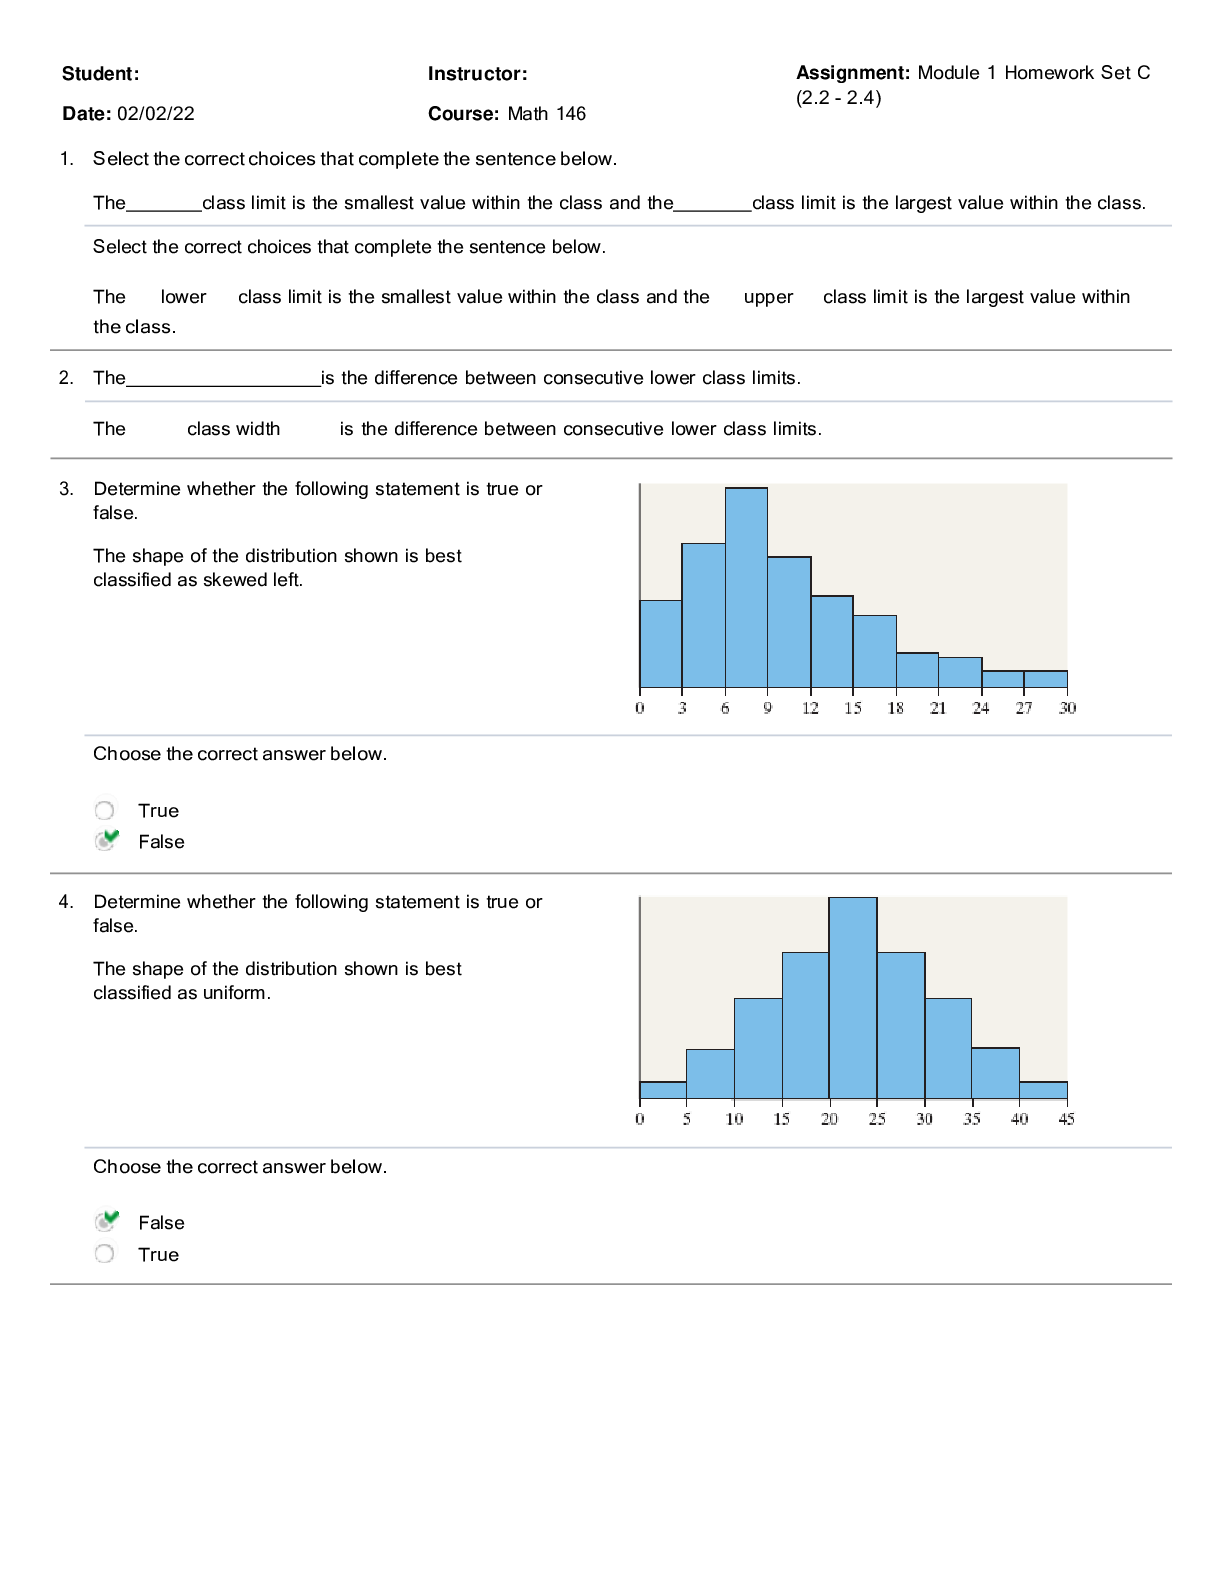
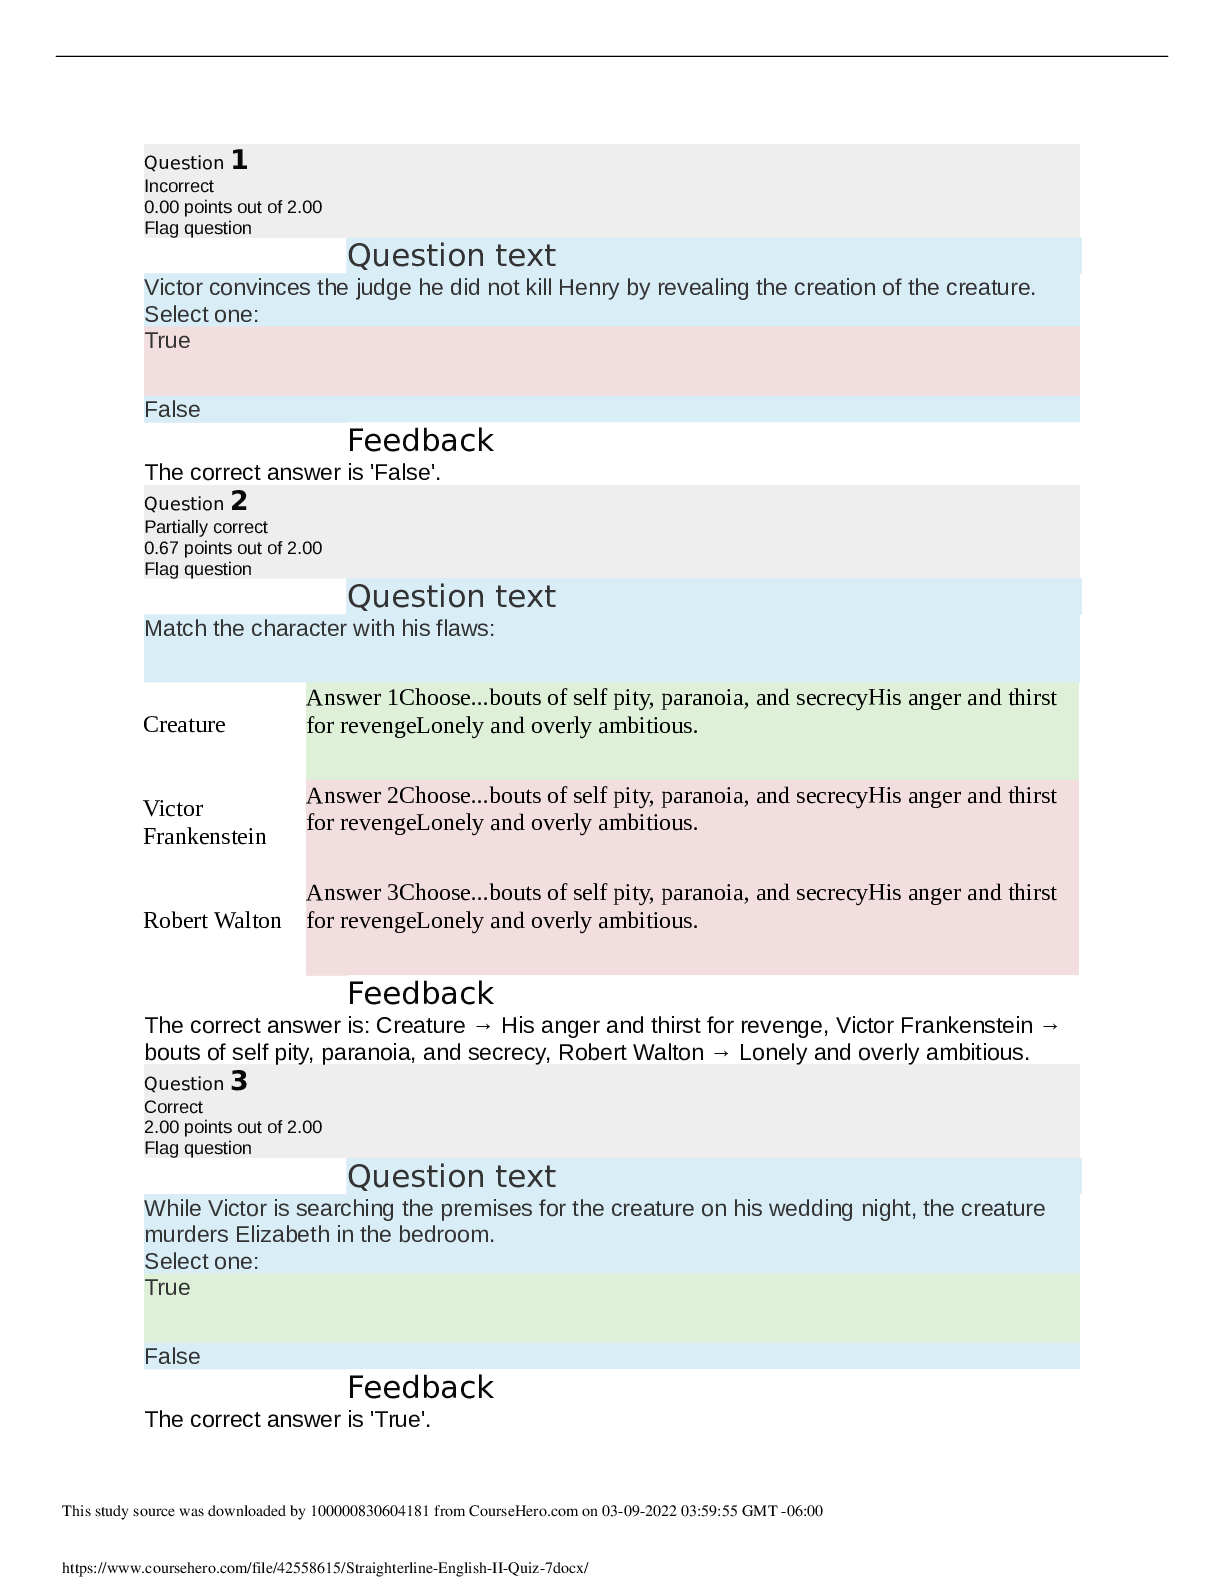
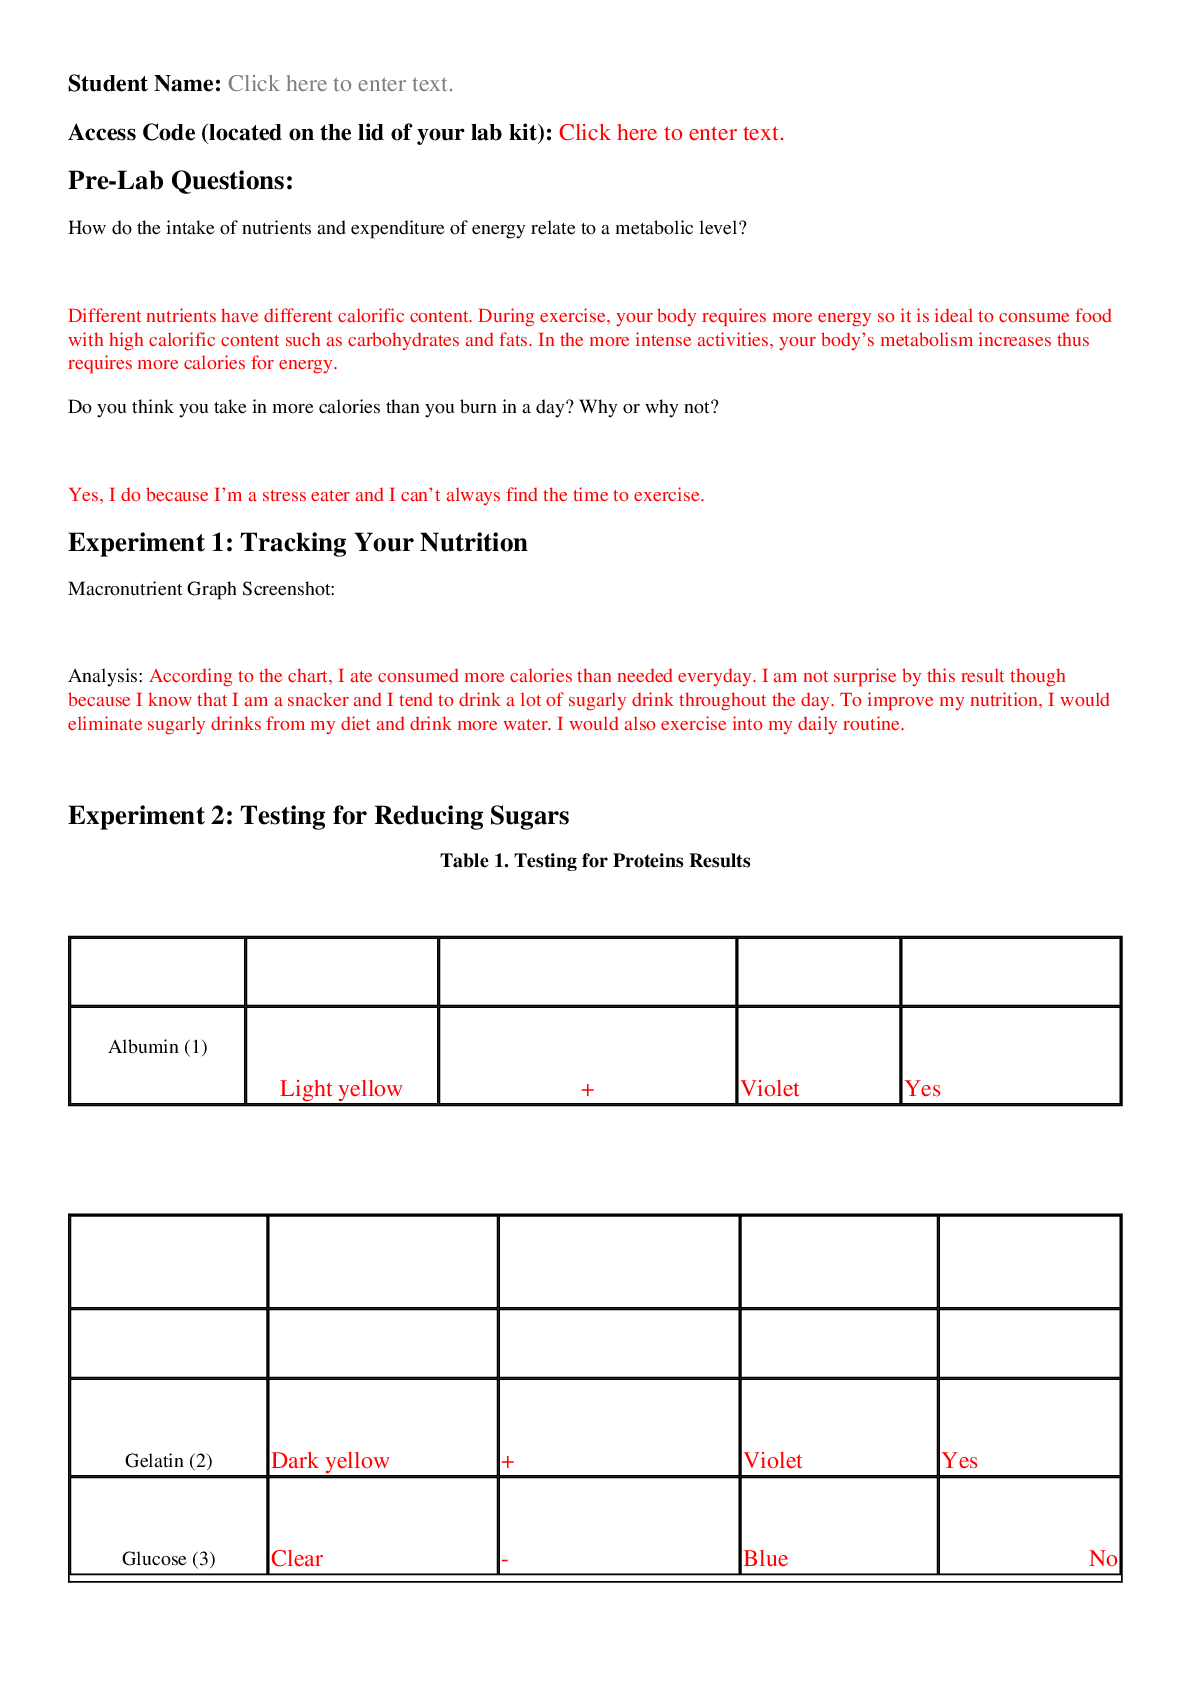
1-3 MyStatLab: Module One Problem Set Question 1/14 The following data represent the percent of owners of an electronic device that plan to purchase a replacement device within the next 12 months b... ased on a survey of 1100 adults in a certain country. Complete parts (a) through (c). (a) What percent of game console owners plan to buy a replacement device within the next 12 months? 10.5% (b) If there are 250 million individuals who own a cellphone, how many expect to replace their phone within the next 12 months? 37,000,000 (c) If the results of the survey were claimed to indicate that 7.7% of adults in this country who own digital cameras plan to replace their camera in the next 12 months, would you say this statement is descriptive or inferential? Why? The statement is inferential, because the survey reports on a sample of the country's population. This claim requires an inference to the population. Question 2/14 A library took a survey to find the age distribution of 50 randomly selected new youth members. The results are shown in the table below. Age Group Number of New Members 3-5 6-8 9-11 12-14 15-17 77 55 88 2626 44 (a) Construct a relative frequency distribution of the data Age Group Number of New Members 3-5 6-8 9-11 12-14 15-17 .14 .1 .16 .52 .08 (b) What percentage of new youth members are in the 6-8 age group? 10% (c) What percentage of the new youth members are age 8 or younger? 24% Question 3/14 Module-One-Part-One/ The data to the right represent the number of people from a certain county, aged 5 to64, who visited an optometrist over the course of last year. Age Patients 5-19 20-34 35-49 50-64 1352 2828 5405 6171 (a) Create a relative frequency distribution. (Round to three decimal places as needed.) Age Patients 5-19 20-34 35-49 50-64 .086 .179 .343 .392 (b) Create a frequency histogram. Choose the correct answer below. font size decreased by 3 5 dash 195-19 font size decreased by 3 20 dash 3420-34 font size decreased by 3 35 dash 4935-49 font size decreased by 3 50 dash 64 (c) Create a relative frequency histogram. Choose the correct answer below. (d) What percentage of patients were between 35 and 49? [Show More]
Last updated: 1 year ago
Preview 1 out of 3 pages
.png)
Reviews( 0 )
Document information
Connected school, study & course
About the document
Uploaded On
Mar 14, 2022
Number of pages
3
Written in

Additional information
This document has been written for:
Uploaded
Mar 14, 2022
Downloads
0
Views
48

.png)