Statistics > STUDY GUIDE > STAT 200 Week 6 Homework Problems, full solution guide, 100% correct. (All)
STAT 200 Week 6 Homework Problems, full solution guide, 100% correct.
Document Content and Description Below
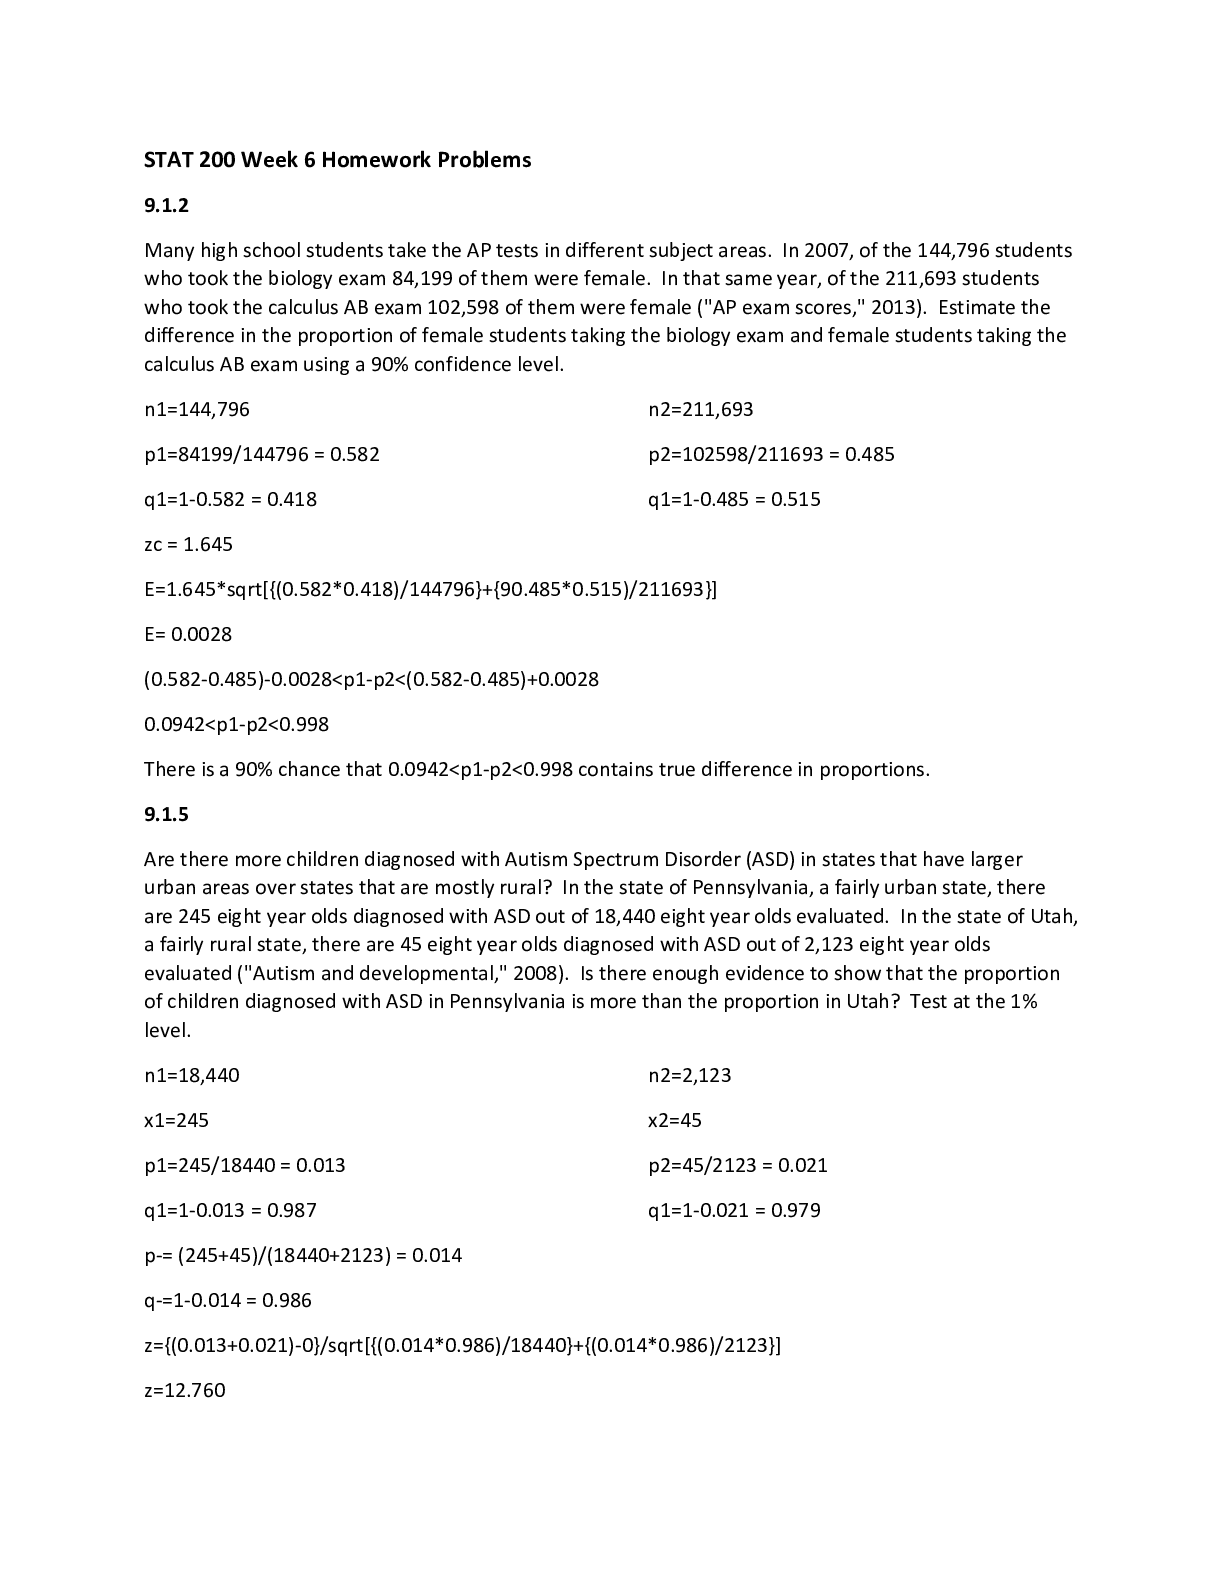
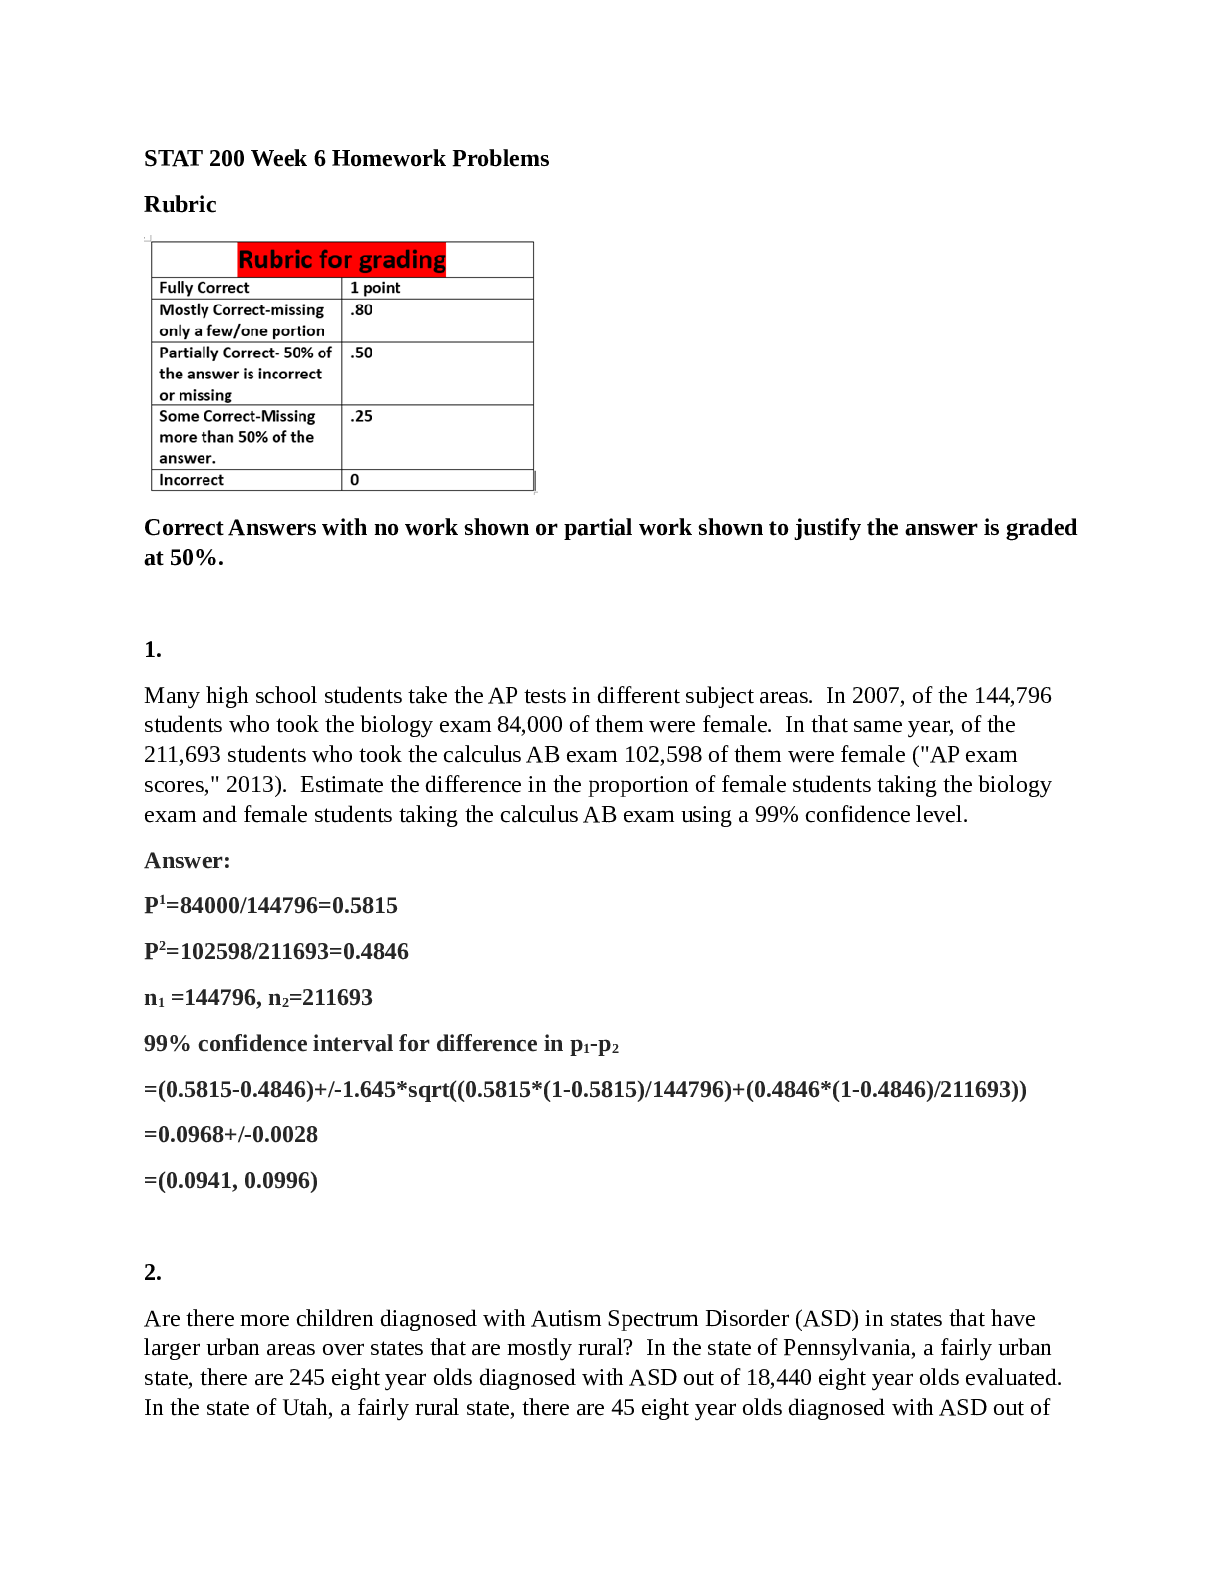
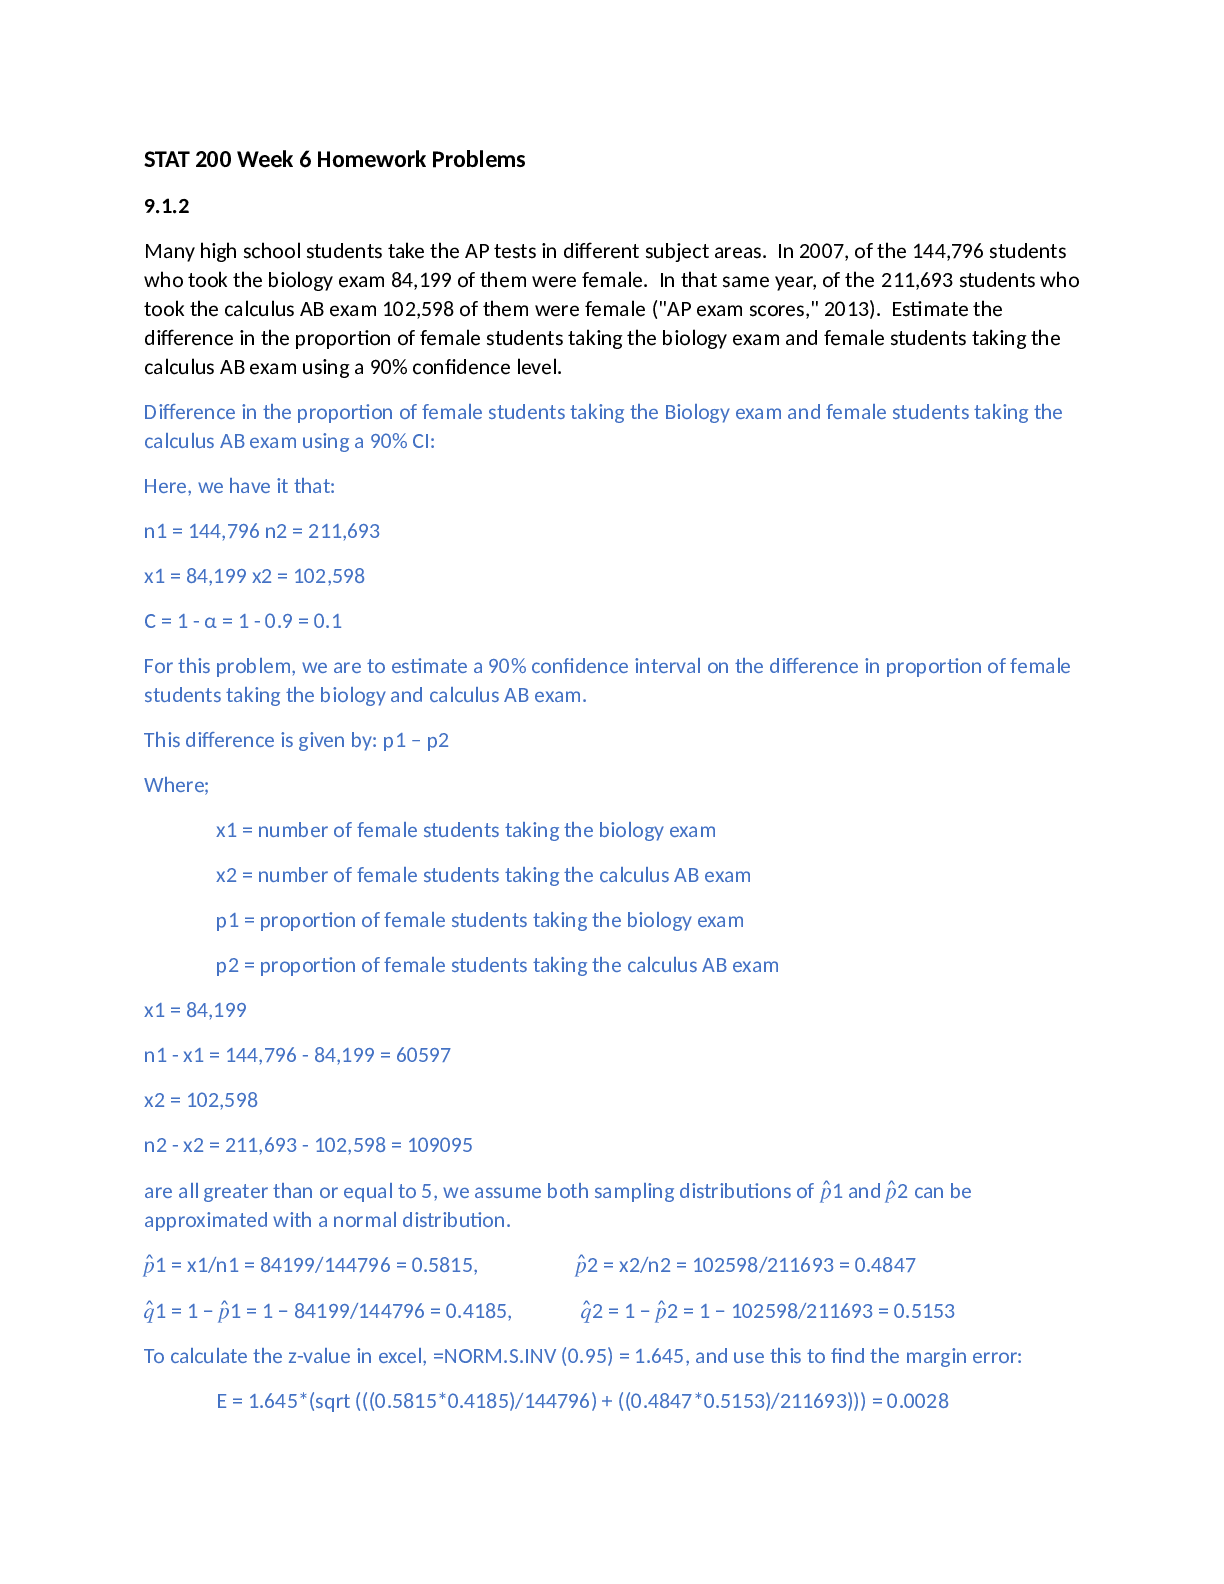
STAT 200 Week 6 Homework Problems 9.1.2 Many high school students take the AP tests in different subject areas. In 2007, of the 144,796 students who took the biology exam 84,199 of them were female... . In that same year, of the 211,693 students who took the calculus AB exam 102,598 of them were female ("AP exam scores," 2013). Estimate the difference in the proportion of female students taking the biology exam and female students taking the calculus AB exam using a 90% confidence level. n1=144,796 p1=84199/144796 = 0.582 q1=1-0.582 = 0.418 n2=211,693 p2=102598/211693 = 0.485 q1=1-0.485 = 0.515 zc = 1.645 E=1.645*sqrt[{(0.582*0.418)/144796}+{90.485*0.515)/211693}] E= 0.0028 (0.582-0.485)-0.0028<p1-p2<(0.582-0.485)+0.0028 0.0942<p1-p2<0.998 There is a 90% chance that 0.0942<p1-p2<0.998 contains true difference in proportions. 9.1.5 Are there more children diagnosed with Autism Spectrum Disorder (ASD) in states that have larger urban areas over states that are mostly rural? In the state of Pennsylvania, a fairly urban state, there are 245 eight year olds diagnosed with ASD out of 18,440 eight year olds evaluated. In the state of Utah, a fairly rural state, there are 45 eight year olds diagnosed with ASD out of 2,123 eight year olds evaluated ("Autism and developmental," 2008). Is there enough evidence to show that the proportion of children diagnosed with ASD in Pennsylvania is more than the proportion in Utah? Test at the 1% level. n1=18,440 x1=245 p1=245/18440 = 0.013 q1=1-0.013 = 0.987 n2=2,123 x2=45 p2=45/2123 = 0.021 q1=1-0.021 = 0.979 p-= (245+45)/(18440+2123) = 0.014 q-=1-0.014 = 0.986 z={(0.013+0.021)-0}/sqrt[{(0.014*0.986)/18440}+{(0.014*0.986)/2123}] z=12.760 9.2.3 All Fresh Seafood is a wholesale fish company based on the east coast of the U.S. Catalina Offshore Products is a wholesale fish company based on the west coast of the U.S. Table #9.2.5 contains prices from both companies for specific fish types ("Seafood online," 2013) ("Buy sushi grade," 2013). Do the data provide enough evidence to show that a west coast fish wholesaler is more expensive than an east coast wholesaler? Test at the 5% level. [Show More]
Last updated: 1 year ago
Preview 1 out of 11 pages
Reviews( 0 )
Document information
Connected school, study & course
About the document
Uploaded On
Jun 07, 2022
Number of pages
11
Written in

Additional information
This document has been written for:
Uploaded
Jun 07, 2022
Downloads
0
Views
54
 (1).png)


.png)