Statistics > EXAM > Portage_learning_Statistics_LATEST 2022/2023(100%> CORRECT) Examinable. (All)
Portage_learning_Statistics_LATEST 2022/2023(100%> CORRECT) Examinable.
Document Content and Description Below
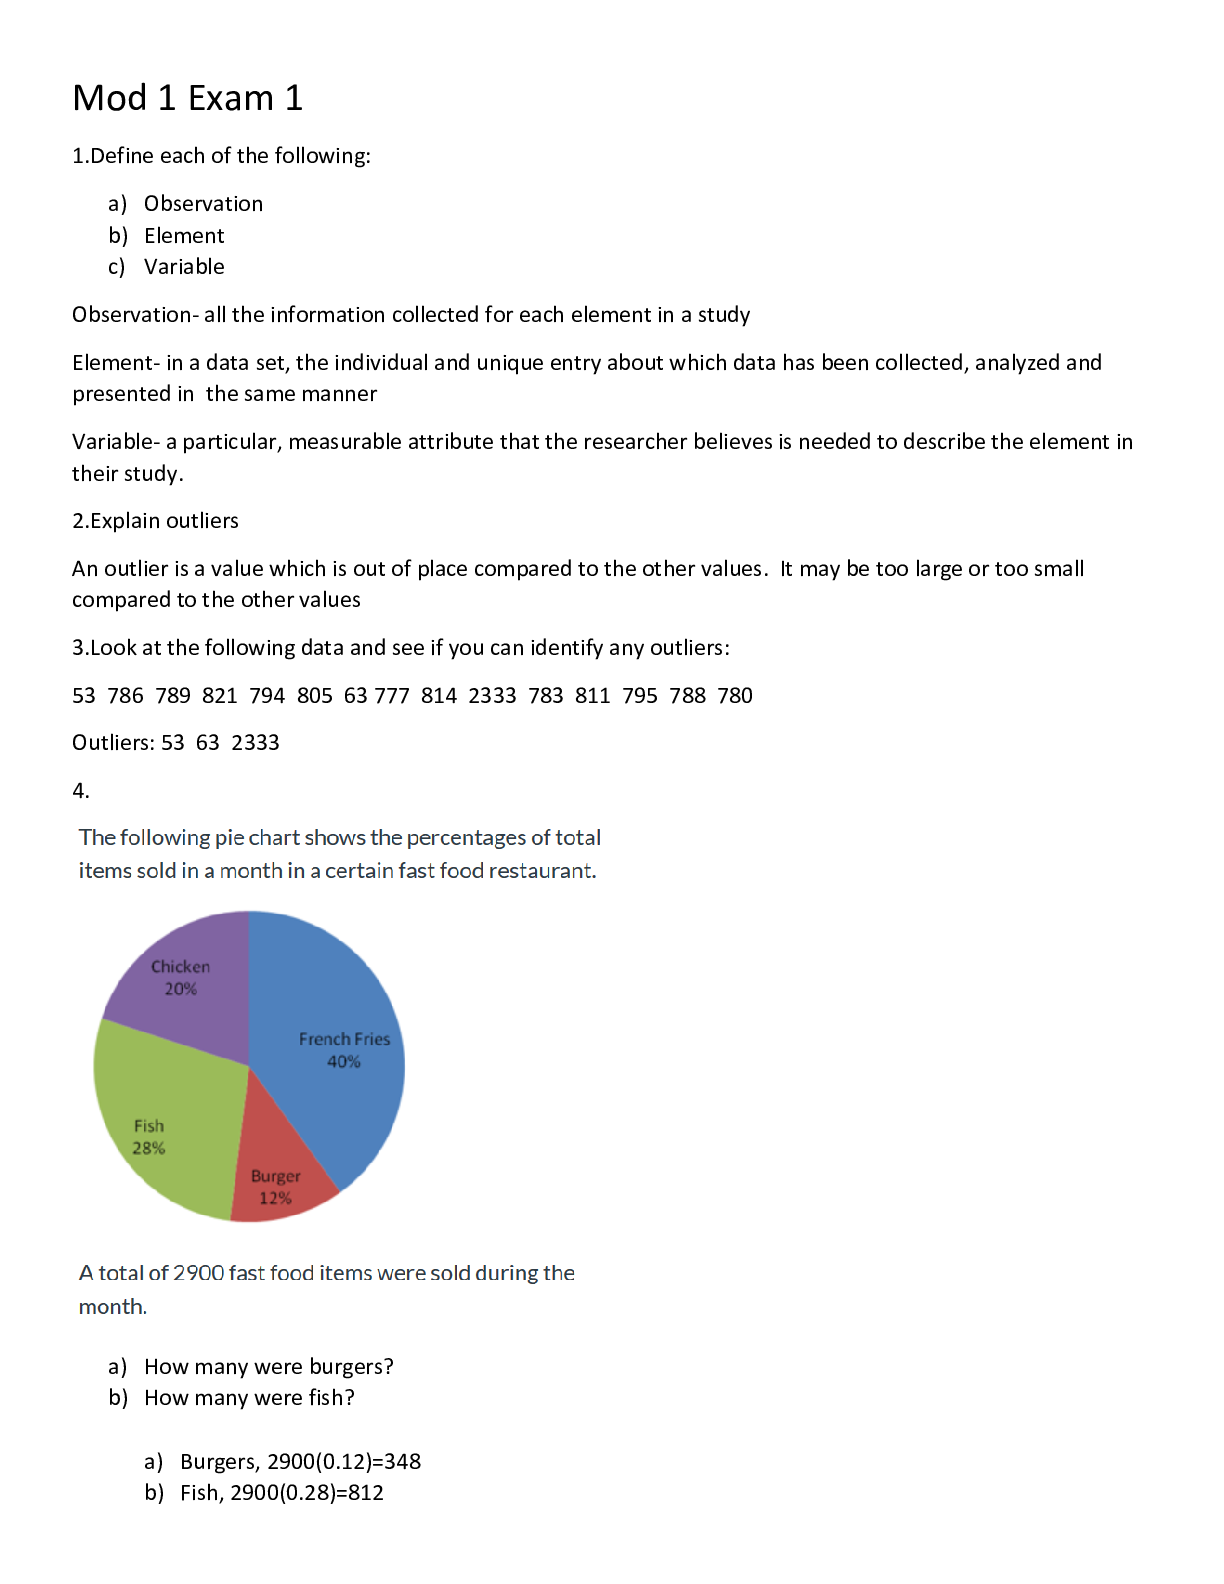
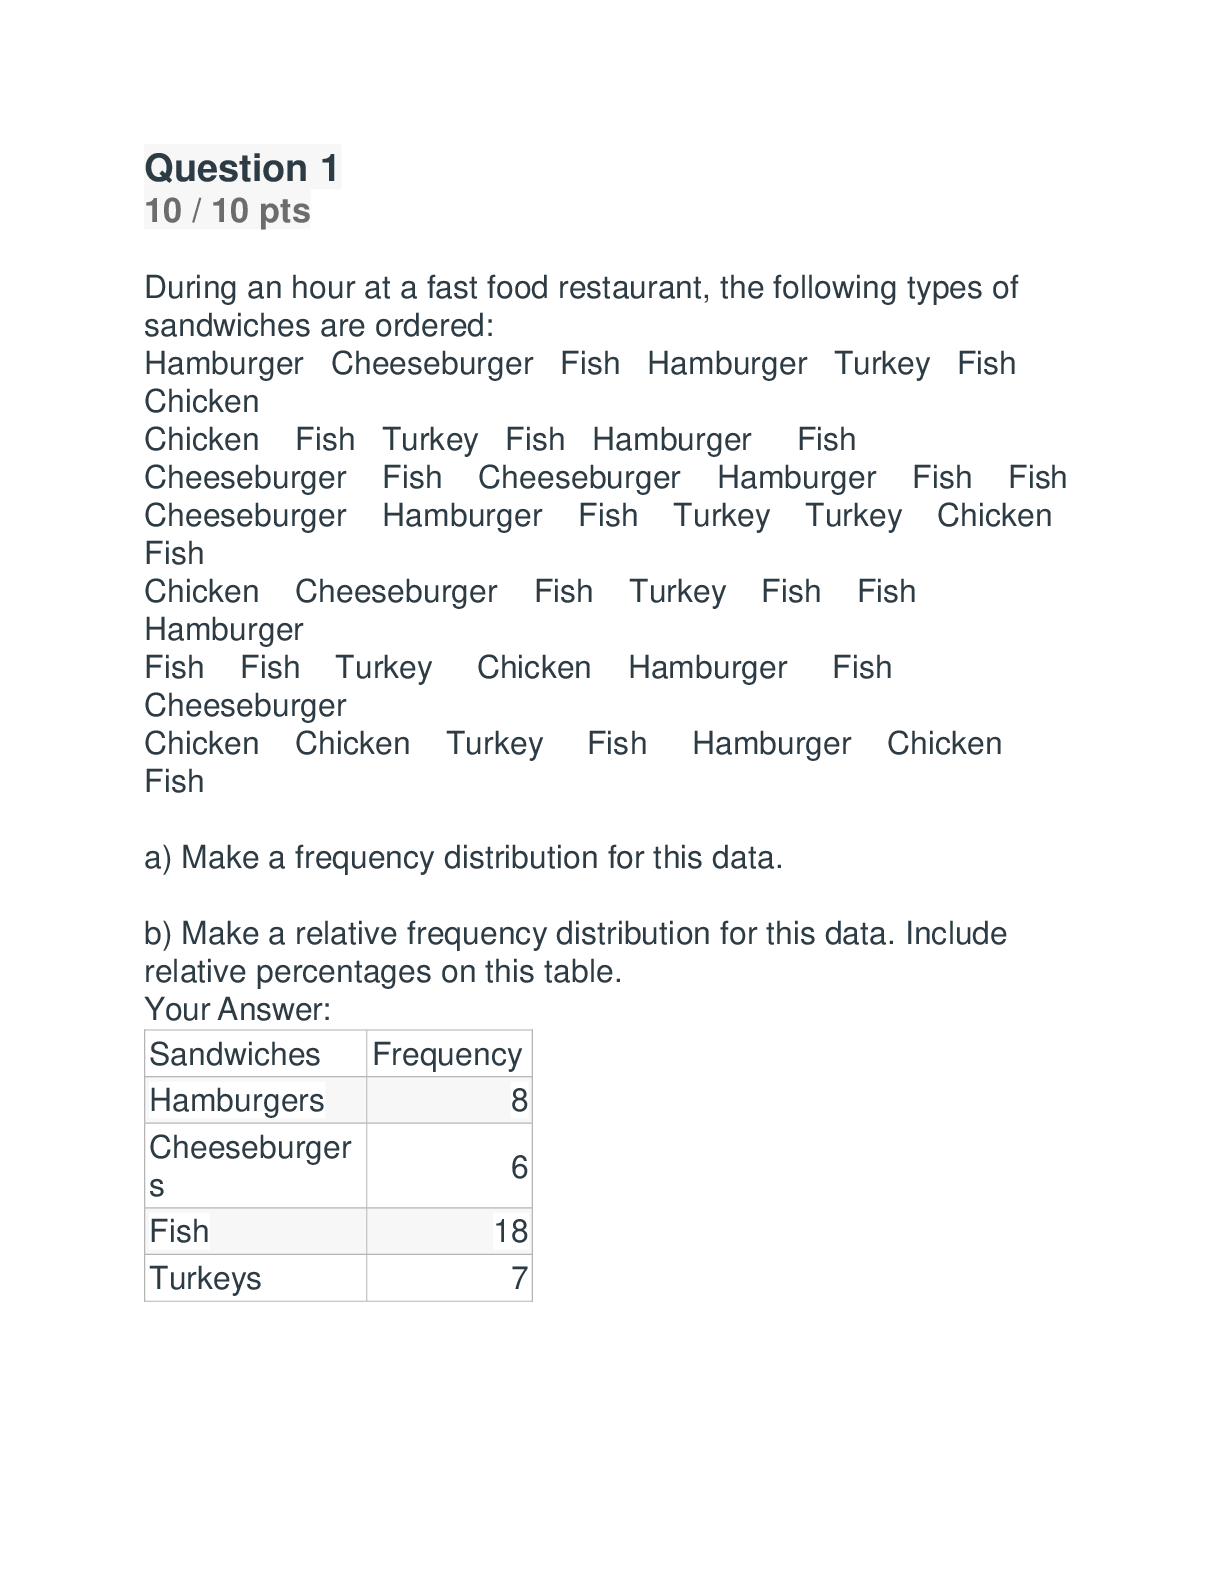
Question 1 10 / 10 pts You may find the following files helpful throughout the exam: Statistics_Equation_Sheet (Links to an external site.) During an hour at a fast food restaurant, the following... types of sandwiches are ordered: Hamburger Cheeseburger Fish Hamburger Turkey Fish Chicken Chicken Fish Turkey Fish Hamburger Fish Cheeseburger Fish Cheeseburger Hamburger Fish Fish Cheeseburger Hamburger Fish Turkey Turkey Chicken Fish Chicken Cheeseburger Fish Turkey Fish Fish Hamburger Fish Fish Turkey Chicken Hamburger Fish Cheeseburger Chicken Chicken Turkey Fish Hamburger Chicken Fish a) Make a frequency distribution for this data. b) Make a relative frequency distribution for this data. Include relative percentages on this table. Your Answer: Sandwiches Frequency Hamburgers 8 Cheeseburger s 6 Fish 18 Turkeys 7Total of . 47 a.) Major Frequency Hamburger 8 Cheeseburger 6 Fish 18 Turkey 7 Chicken 8 Total 47 b.) Chickens 8 Sandwiches Calculation Rel. Frqcy Rel. Percentages Hamburgers 8/47 0.17 17% Cheeseburgers 6/47 0.13 13% Fish 18/47 0.38 38% Turkeys 7/47 0.15 15% Chickens 8/47 0 [Show More]
Last updated: 1 year ago
Preview 1 out of 9 pages
Instant download
Buy this document to get the full access instantly
Instant Download Access after purchase
Add to cartInstant download
Reviews( 0 )
Document information
Connected school, study & course
About the document
Uploaded On
Jun 25, 2022
Number of pages
9
Written in

Additional information
This document has been written for:
Uploaded
Jun 25, 2022
Downloads
0
Views
56