Mathematics > EXAM > MATH 225N Week 6 Statistics Quiz Chamberlain (All)
MATH 225N Week 6 Statistics Quiz Chamberlain
Document Content and Description Below
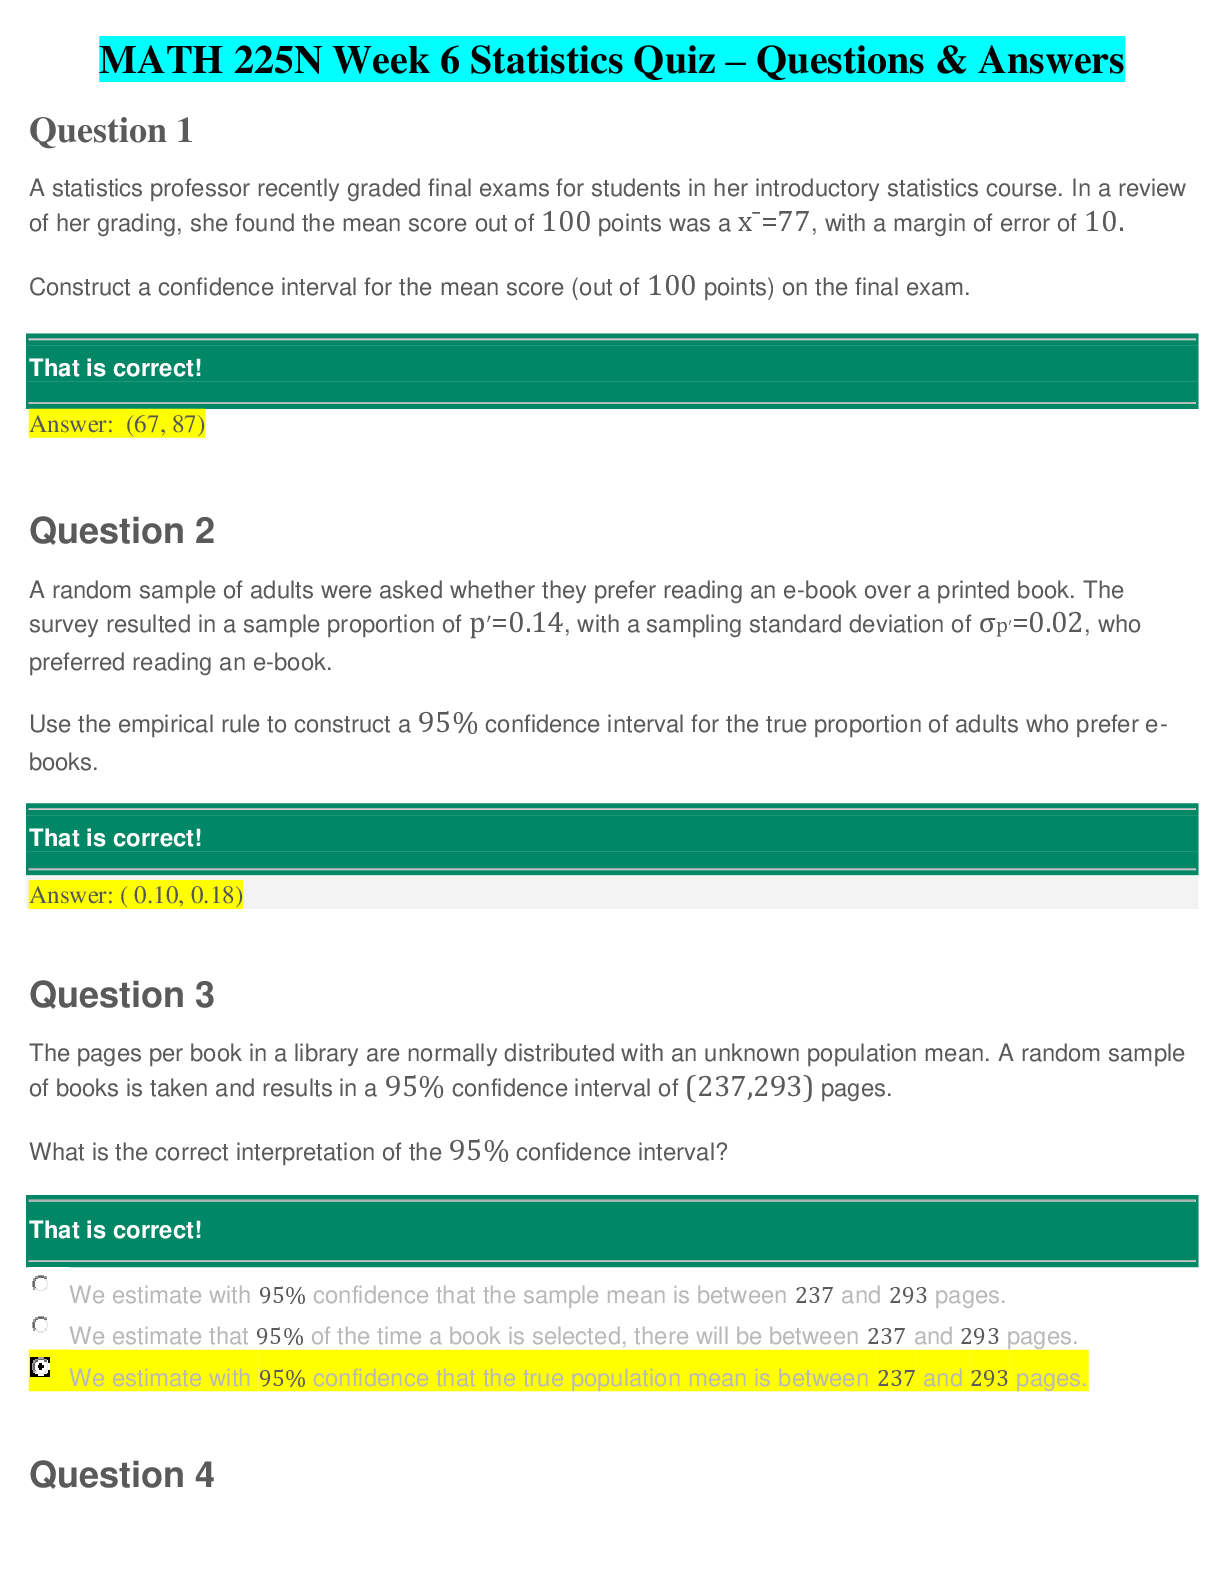
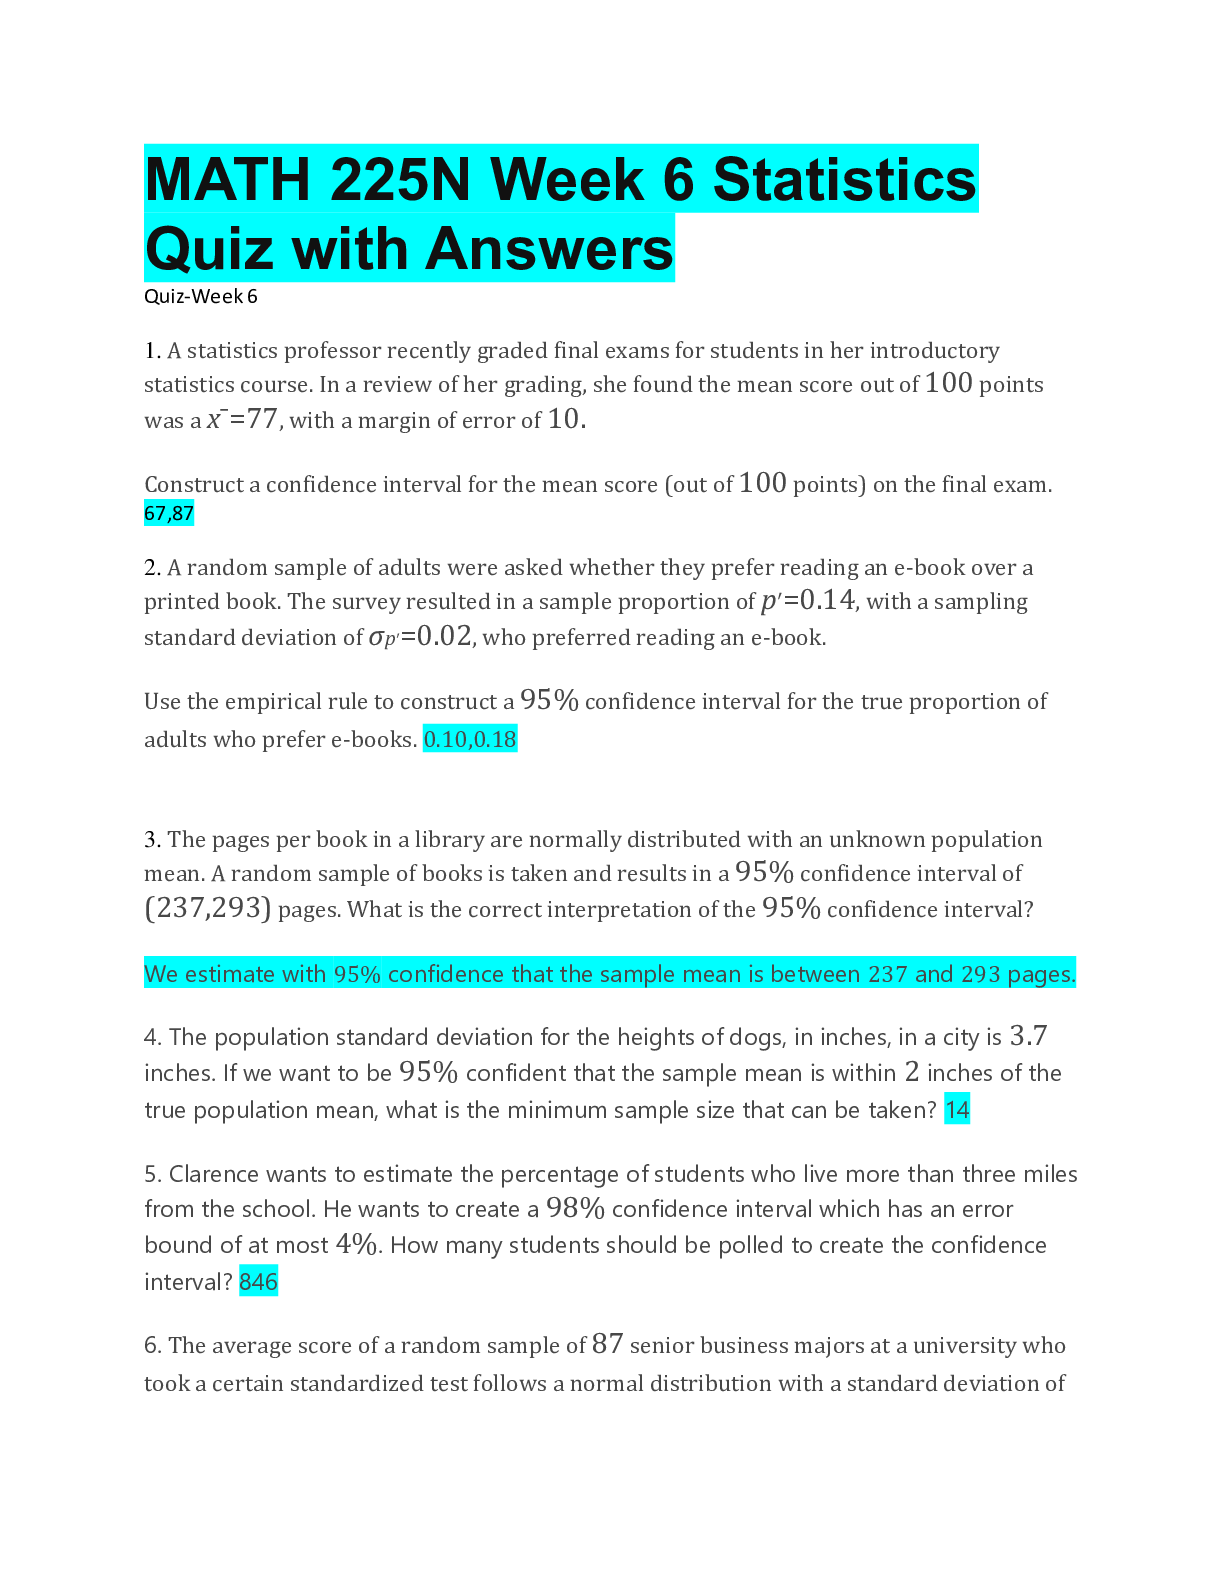
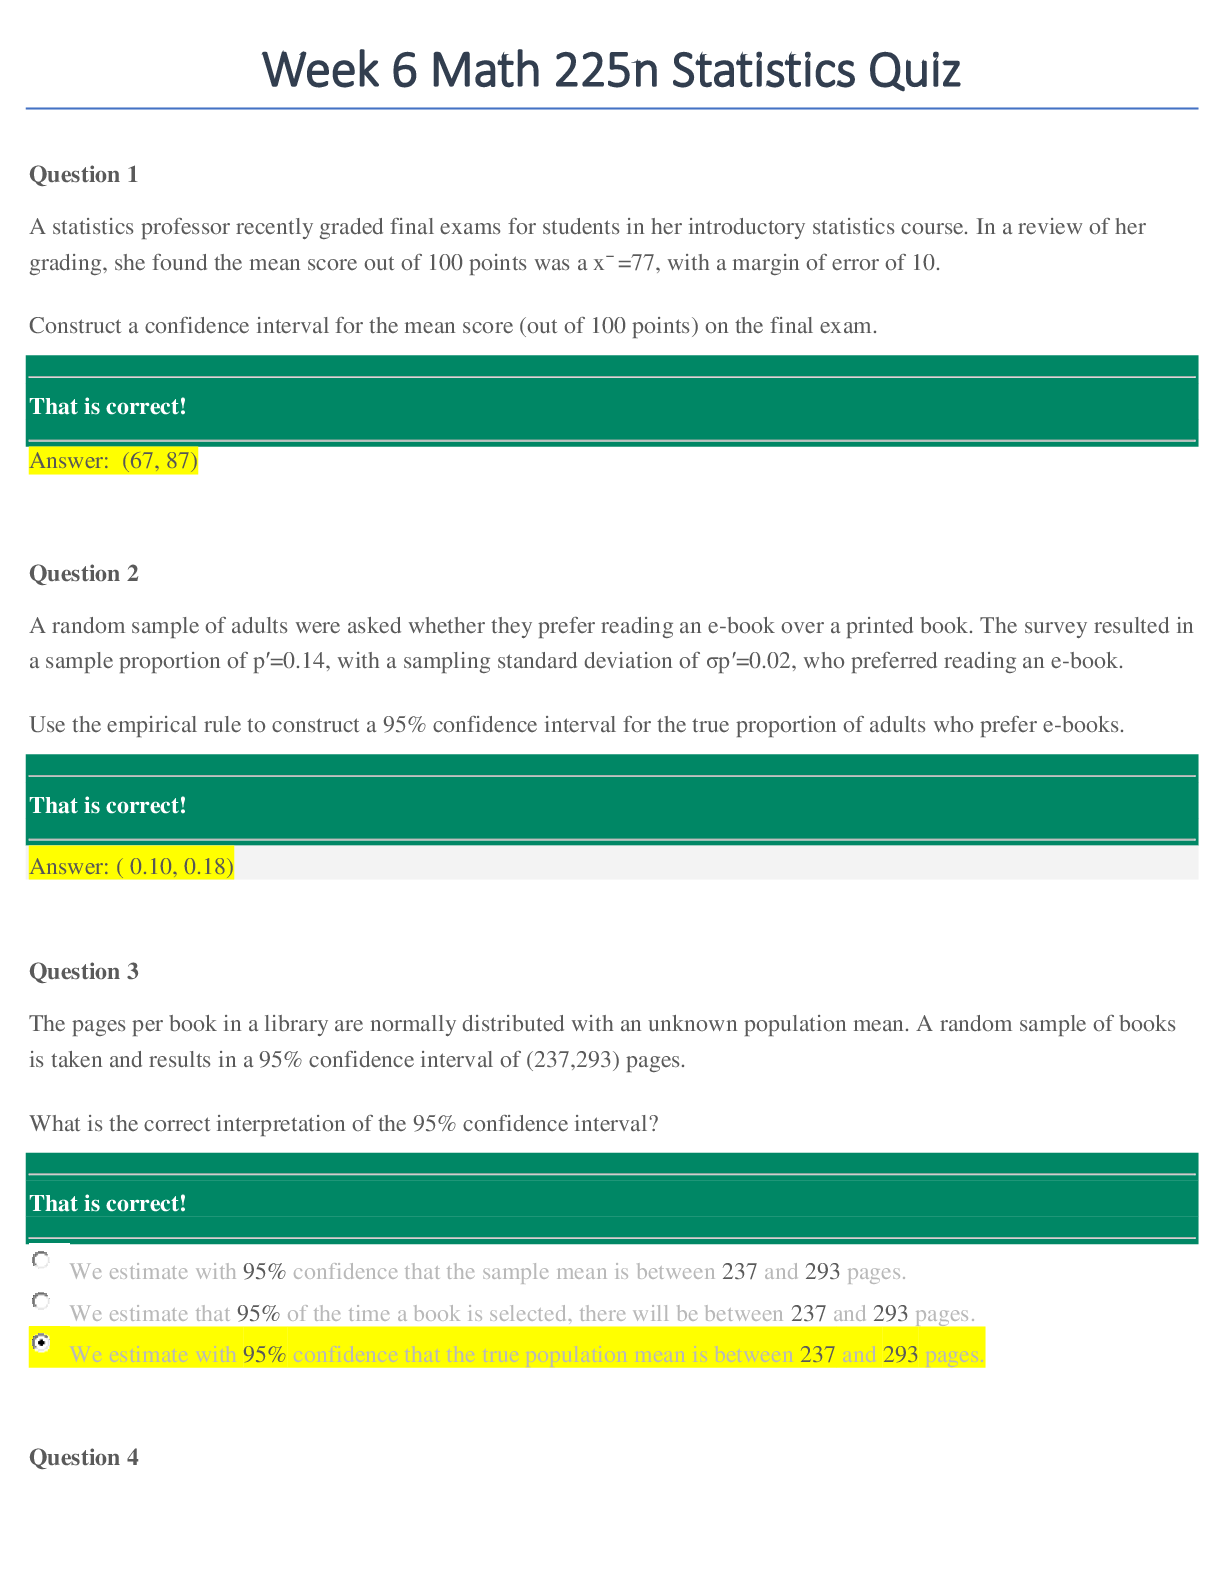
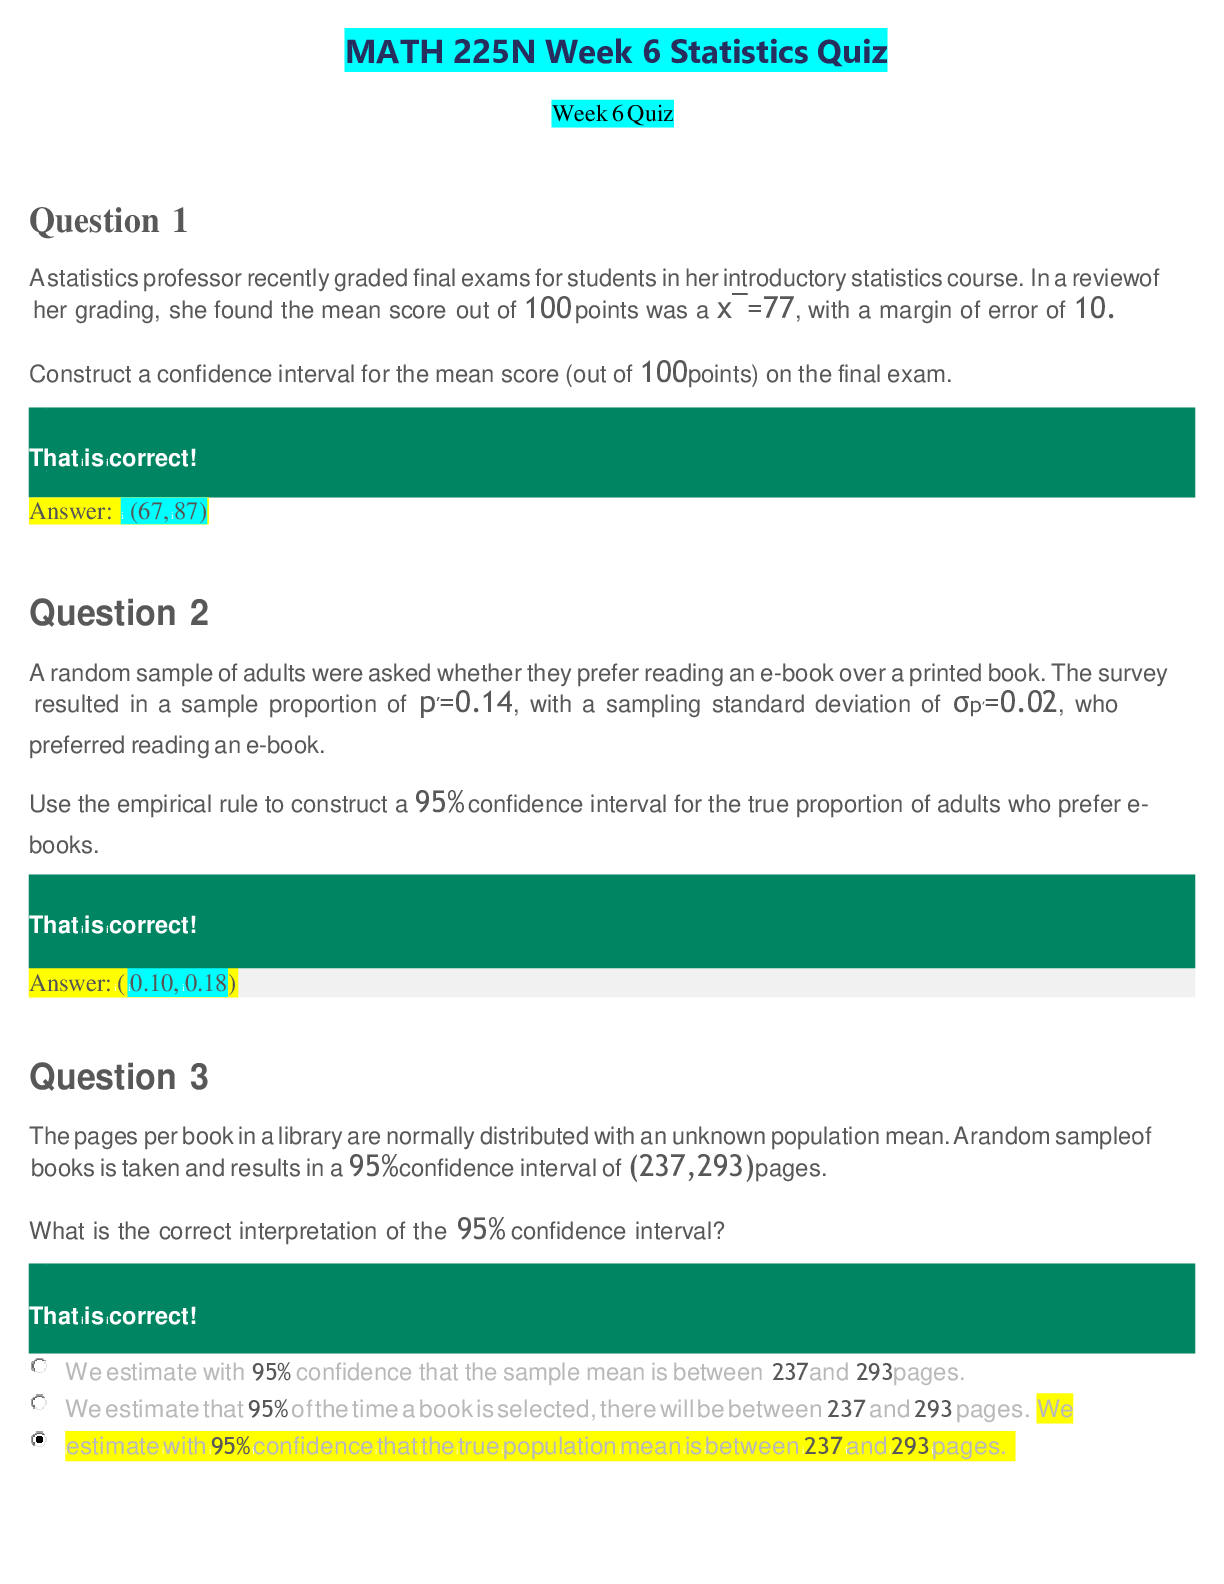
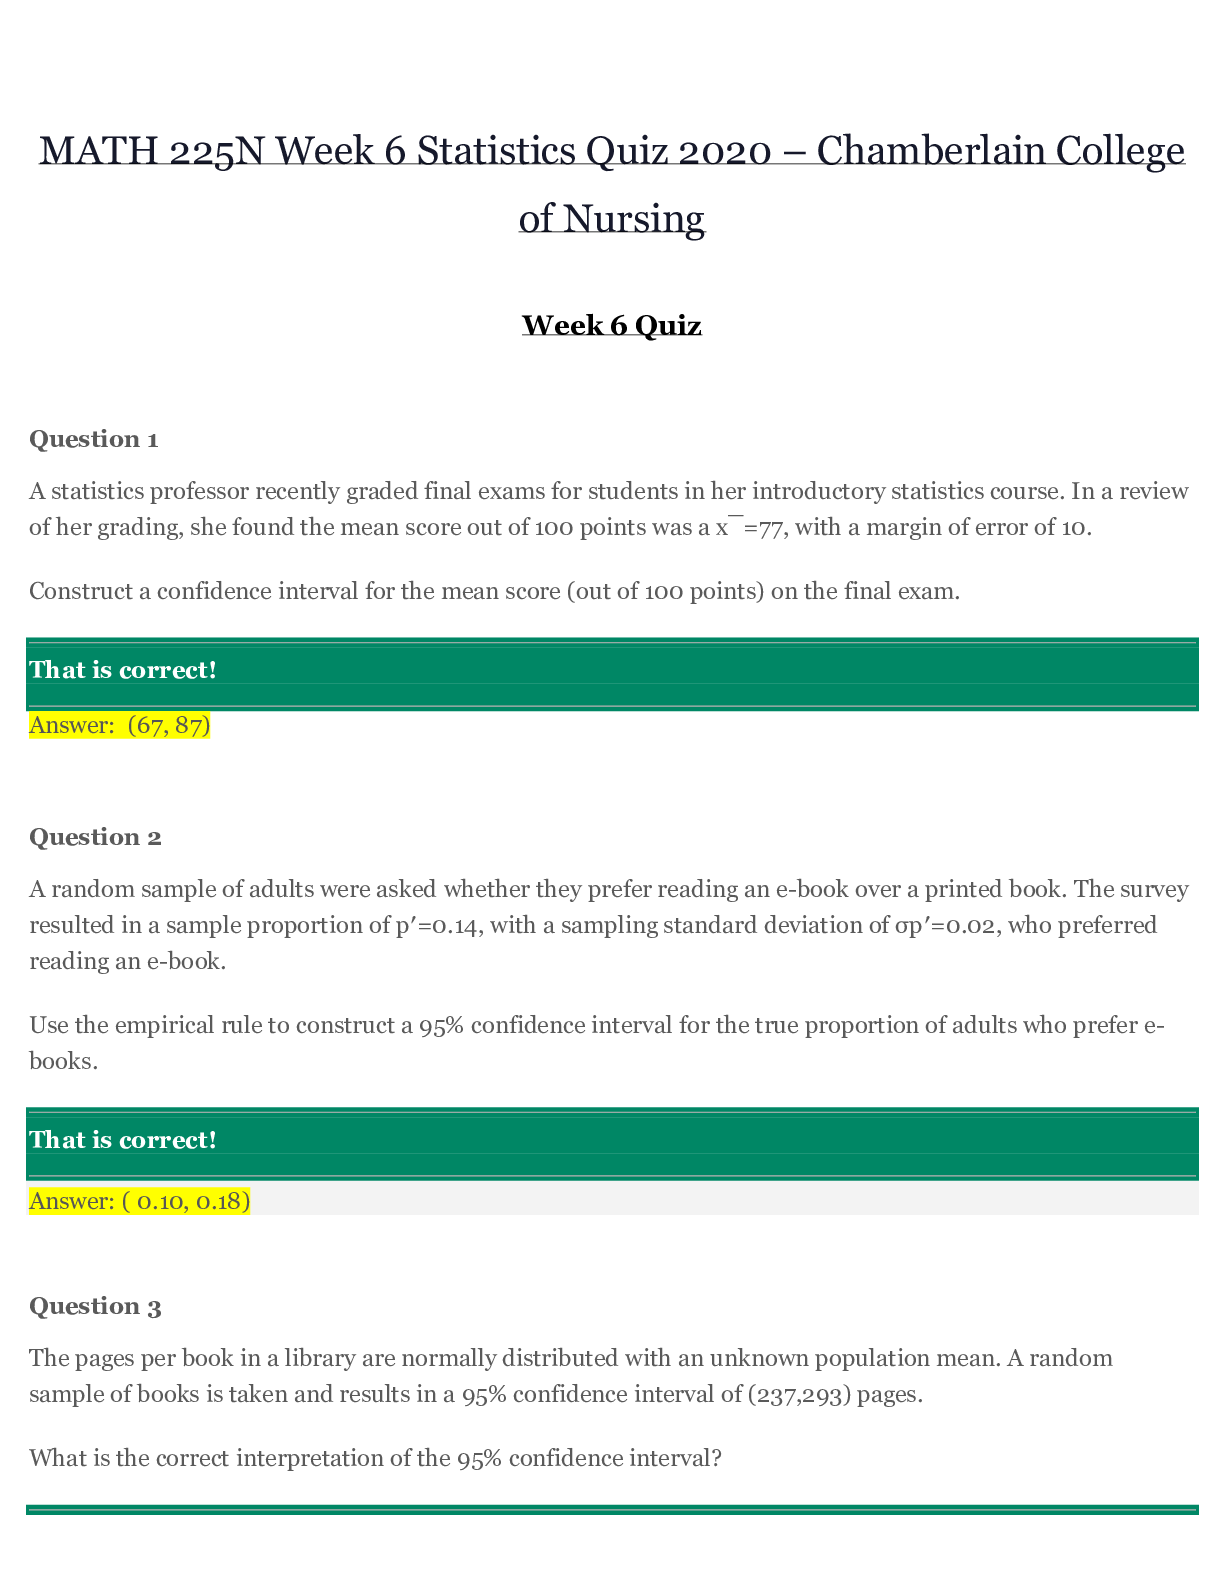
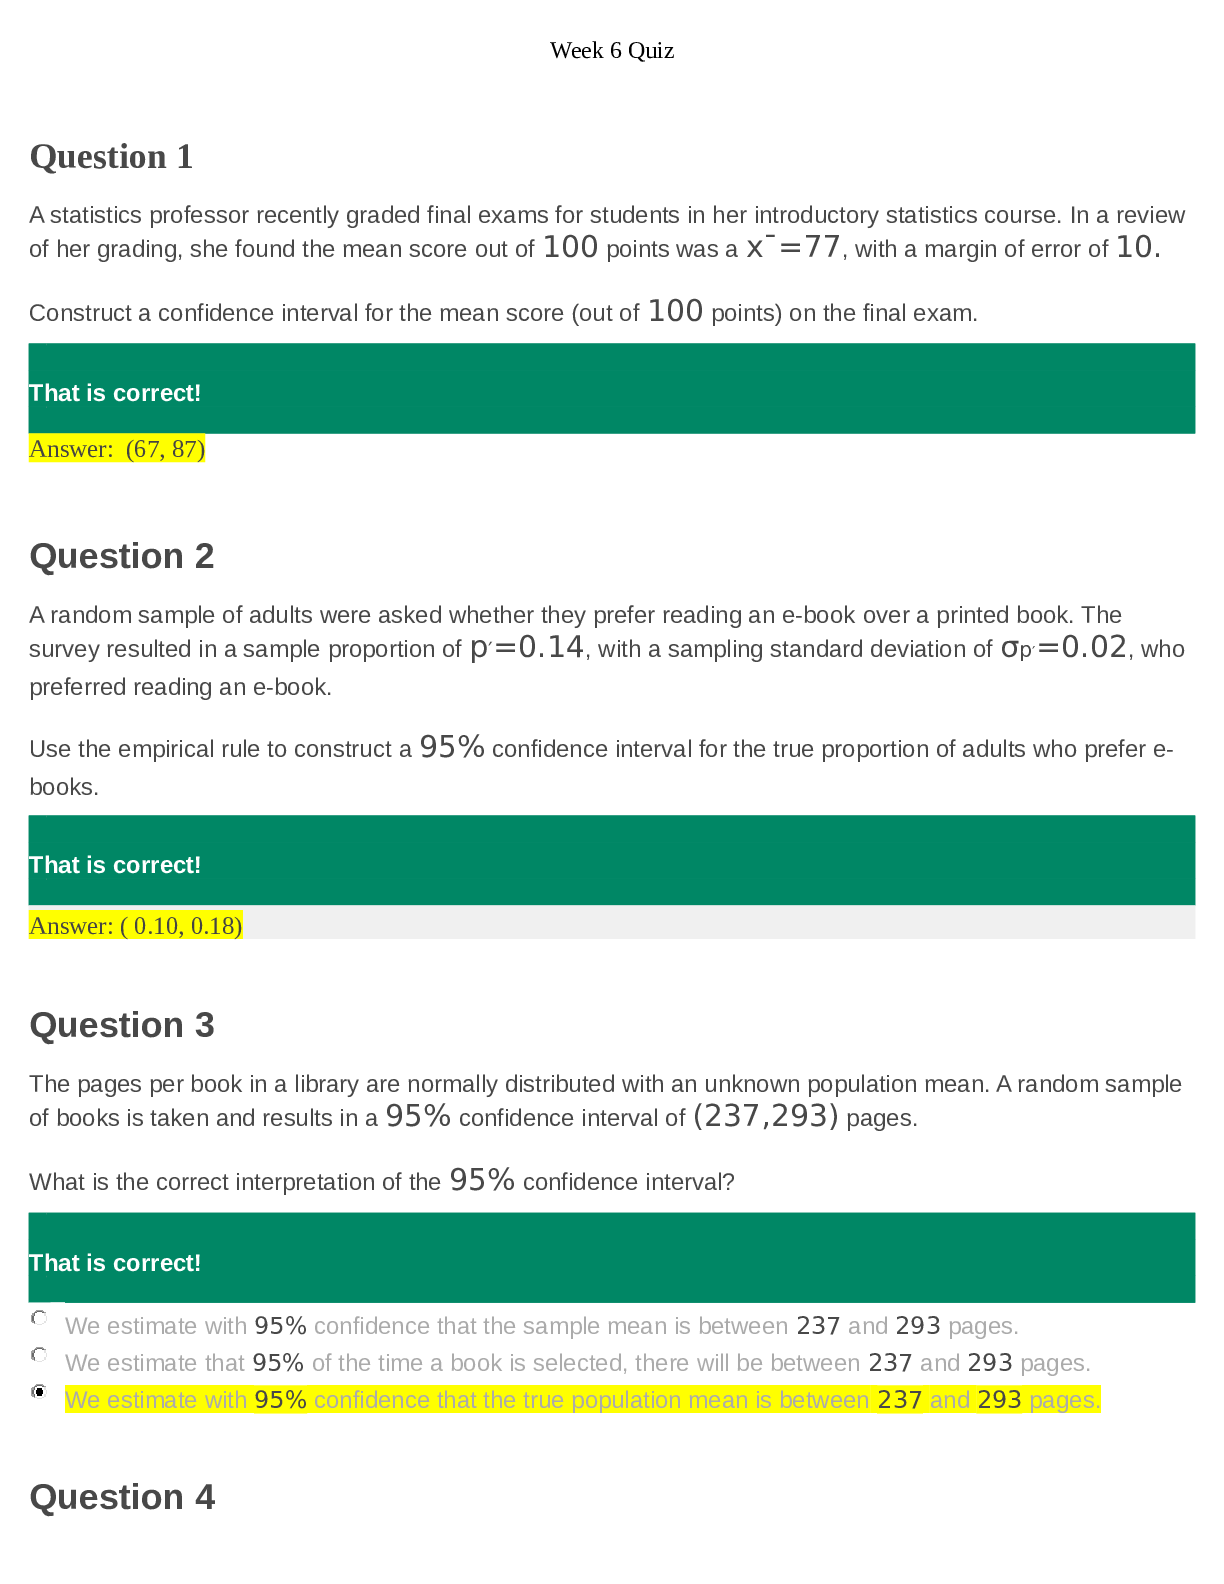
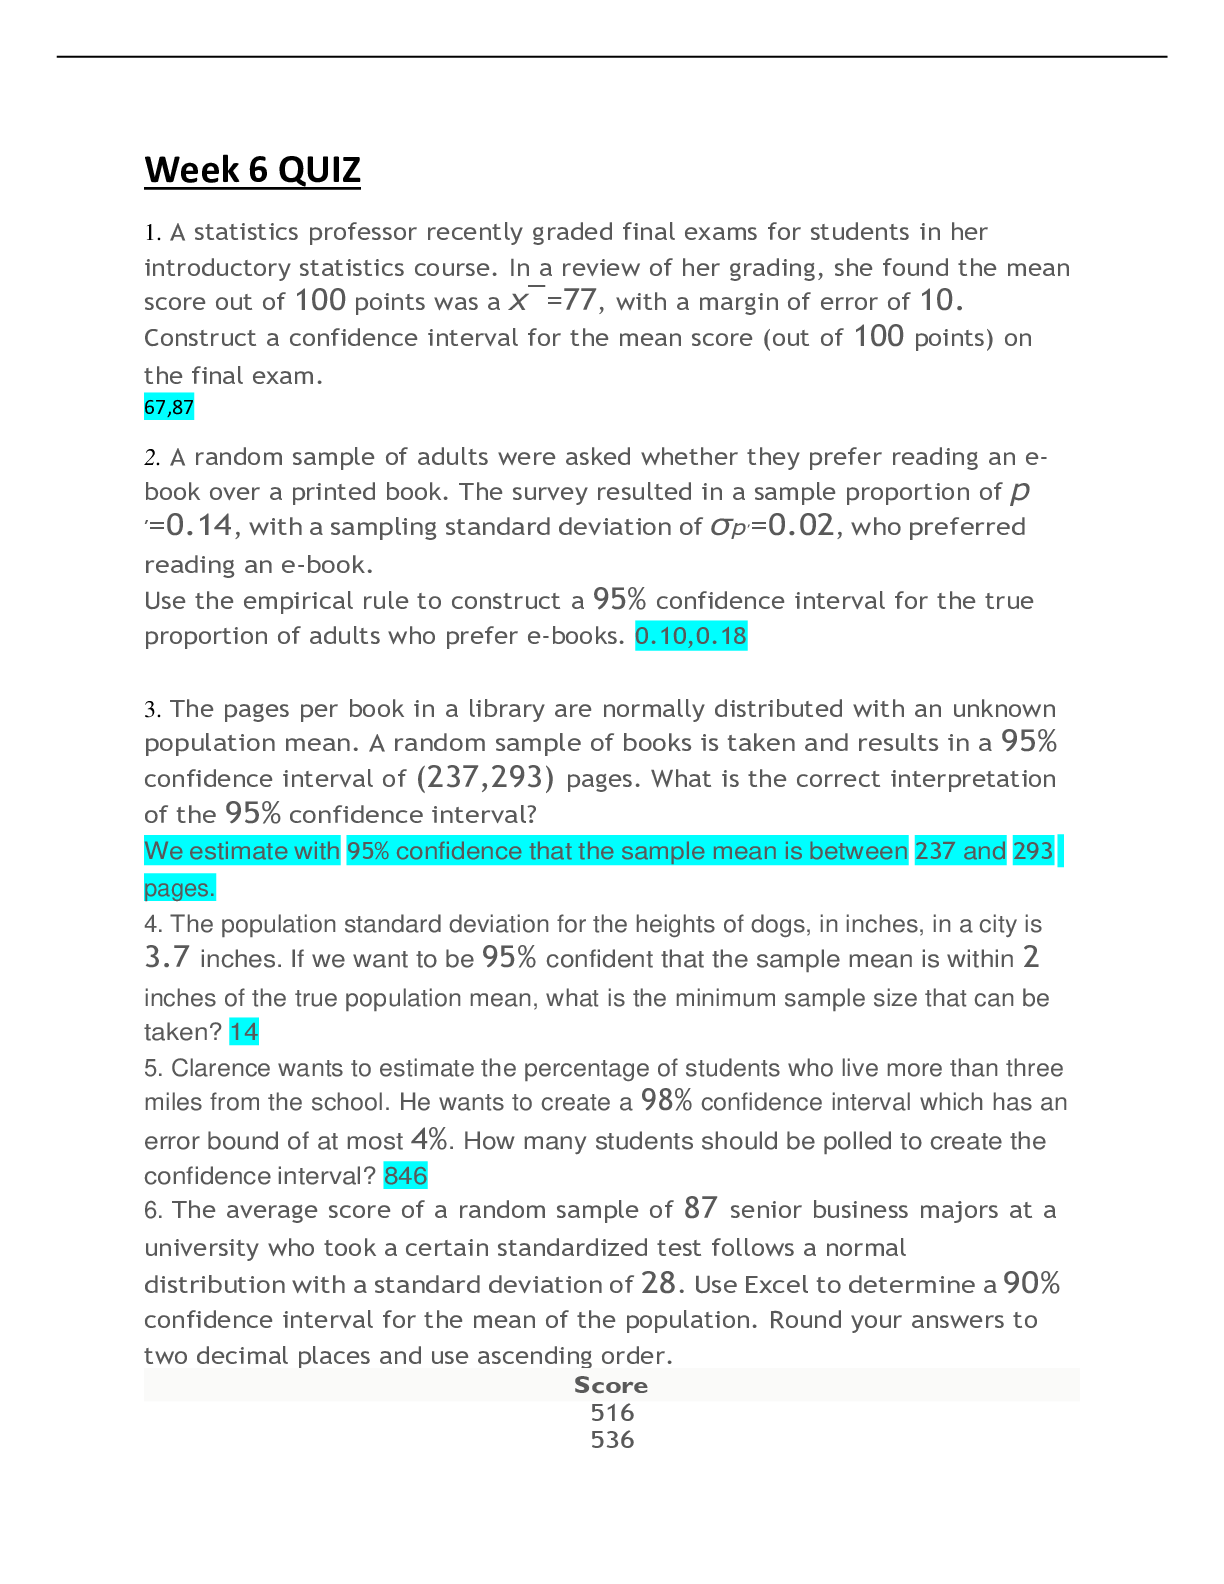
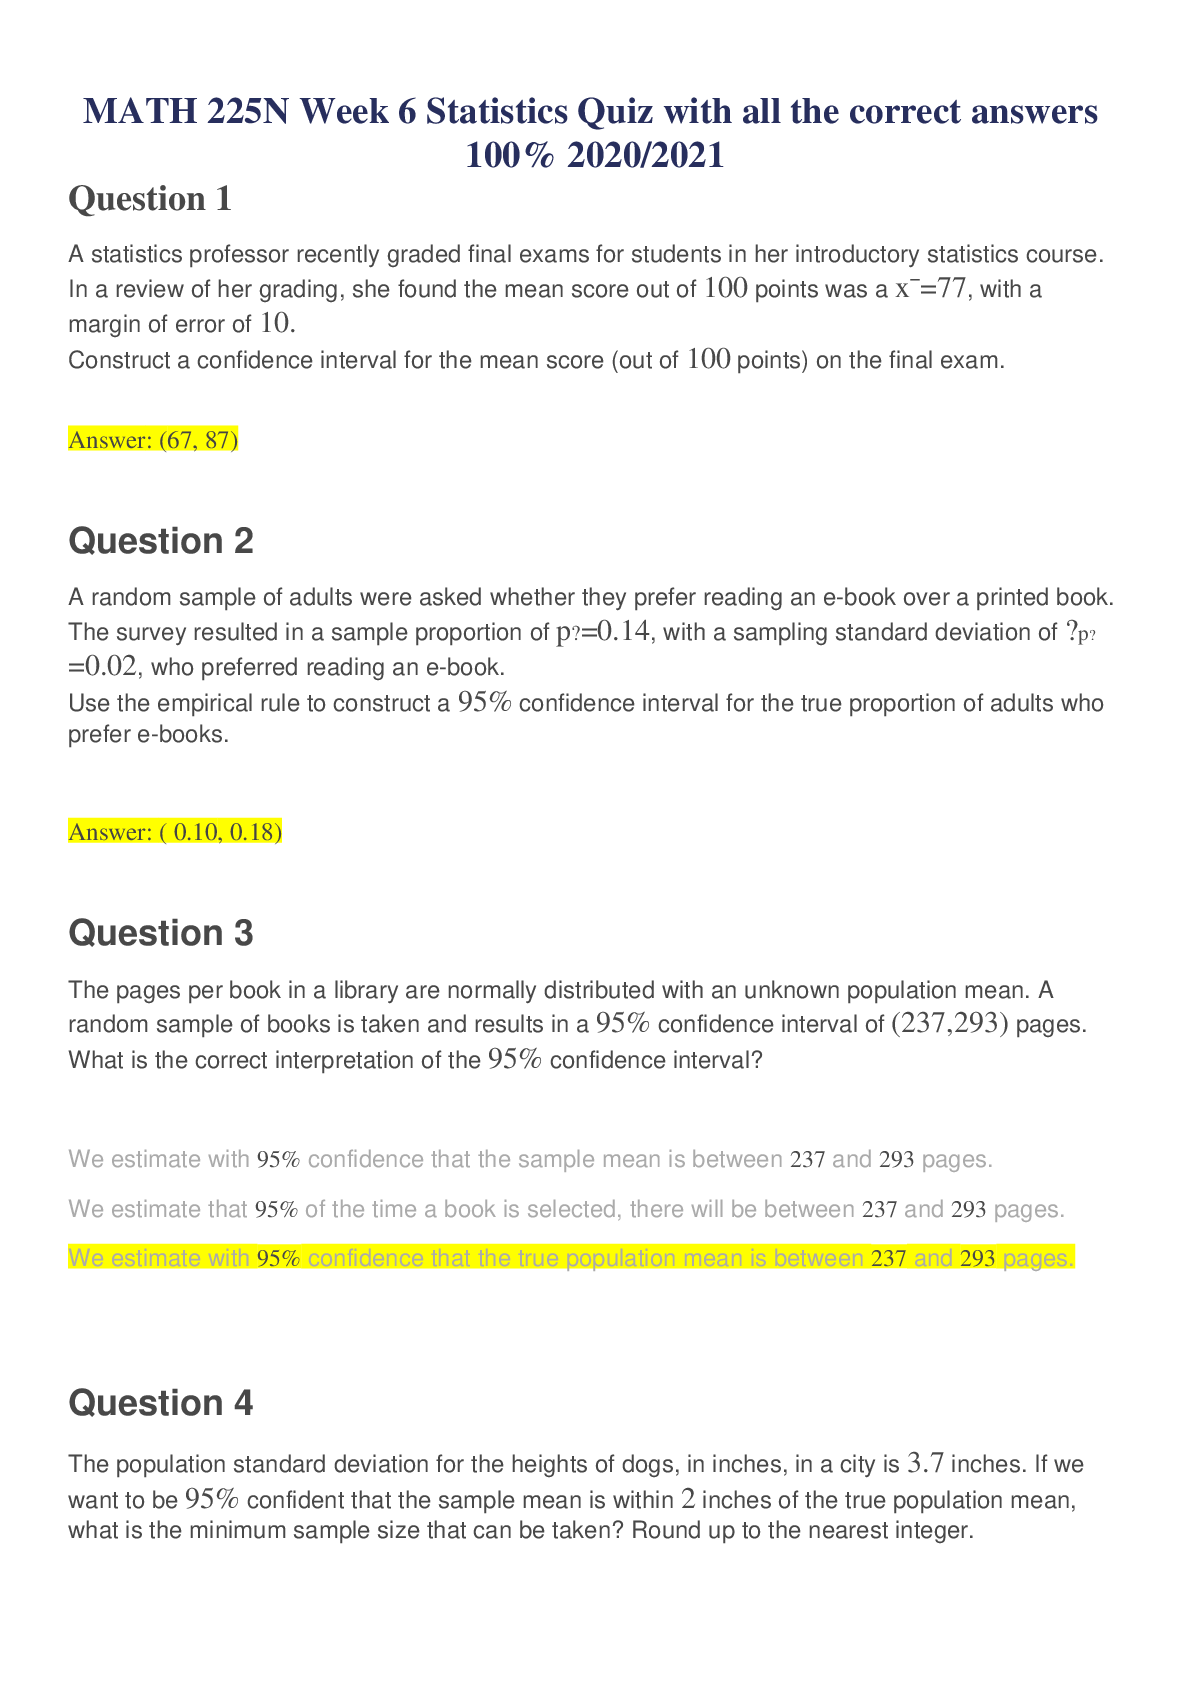
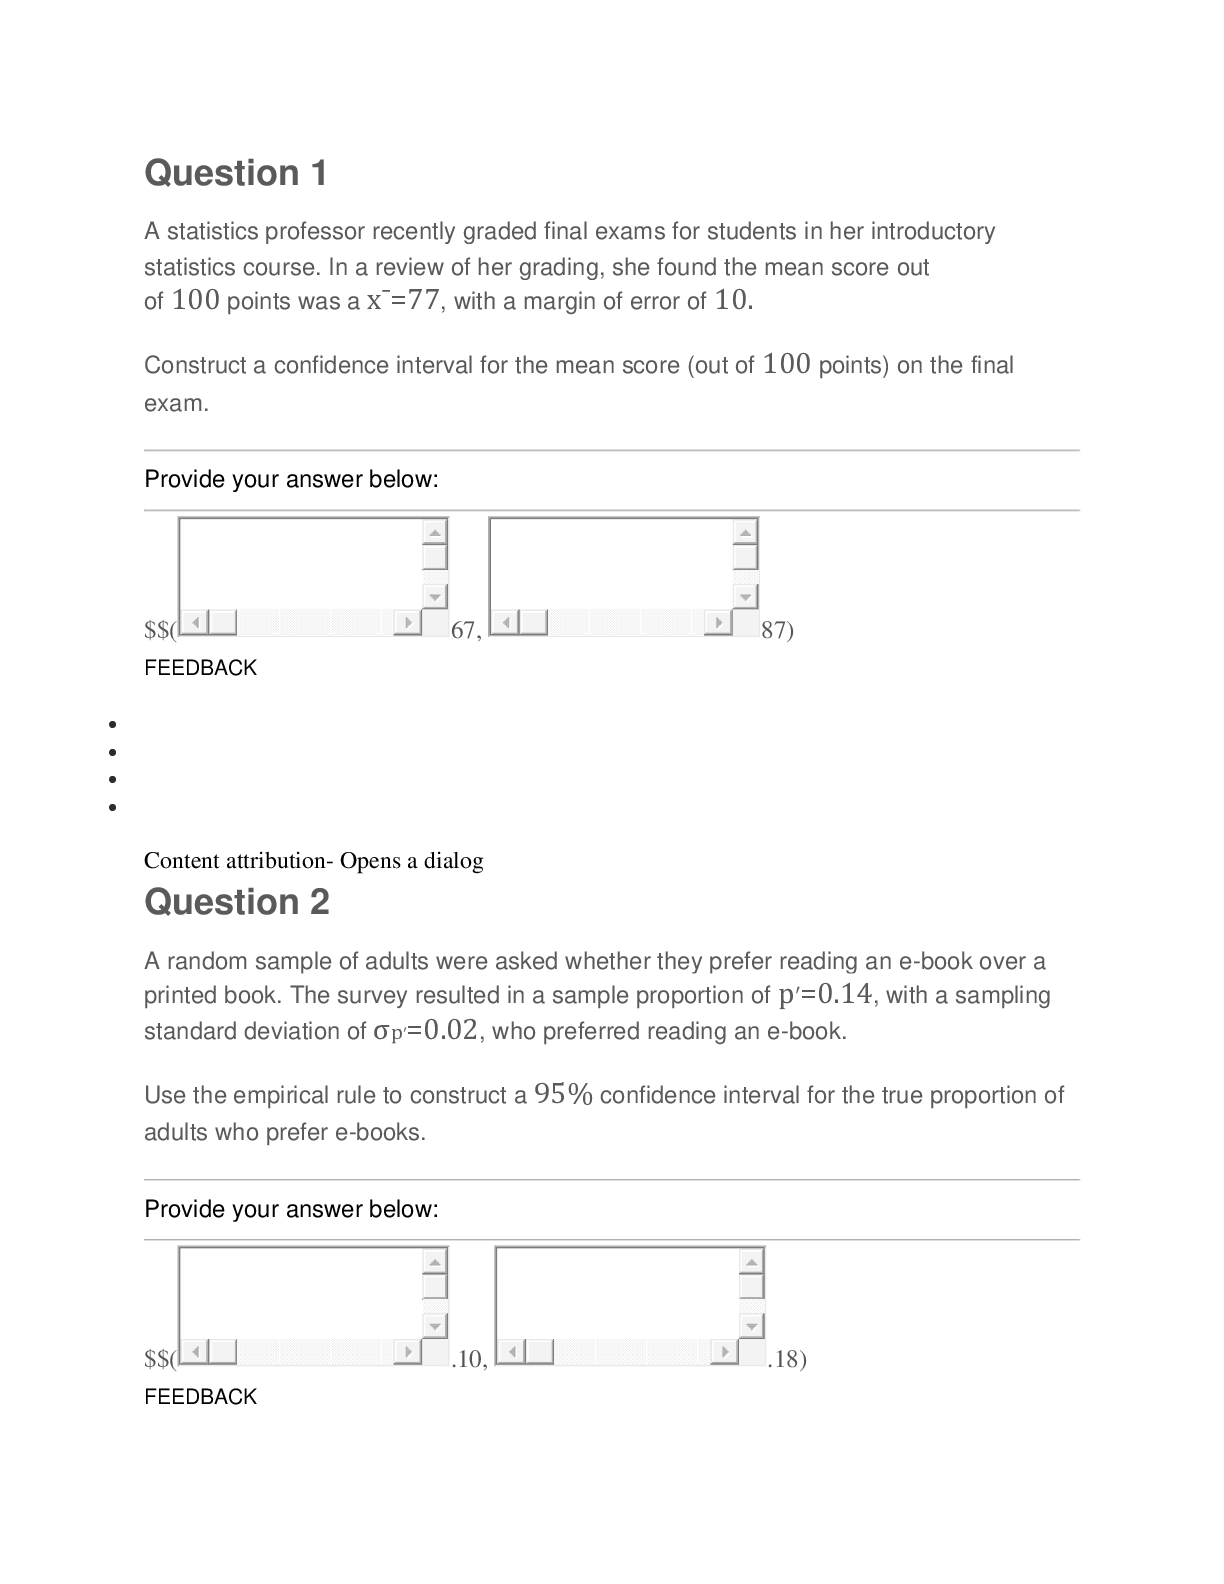
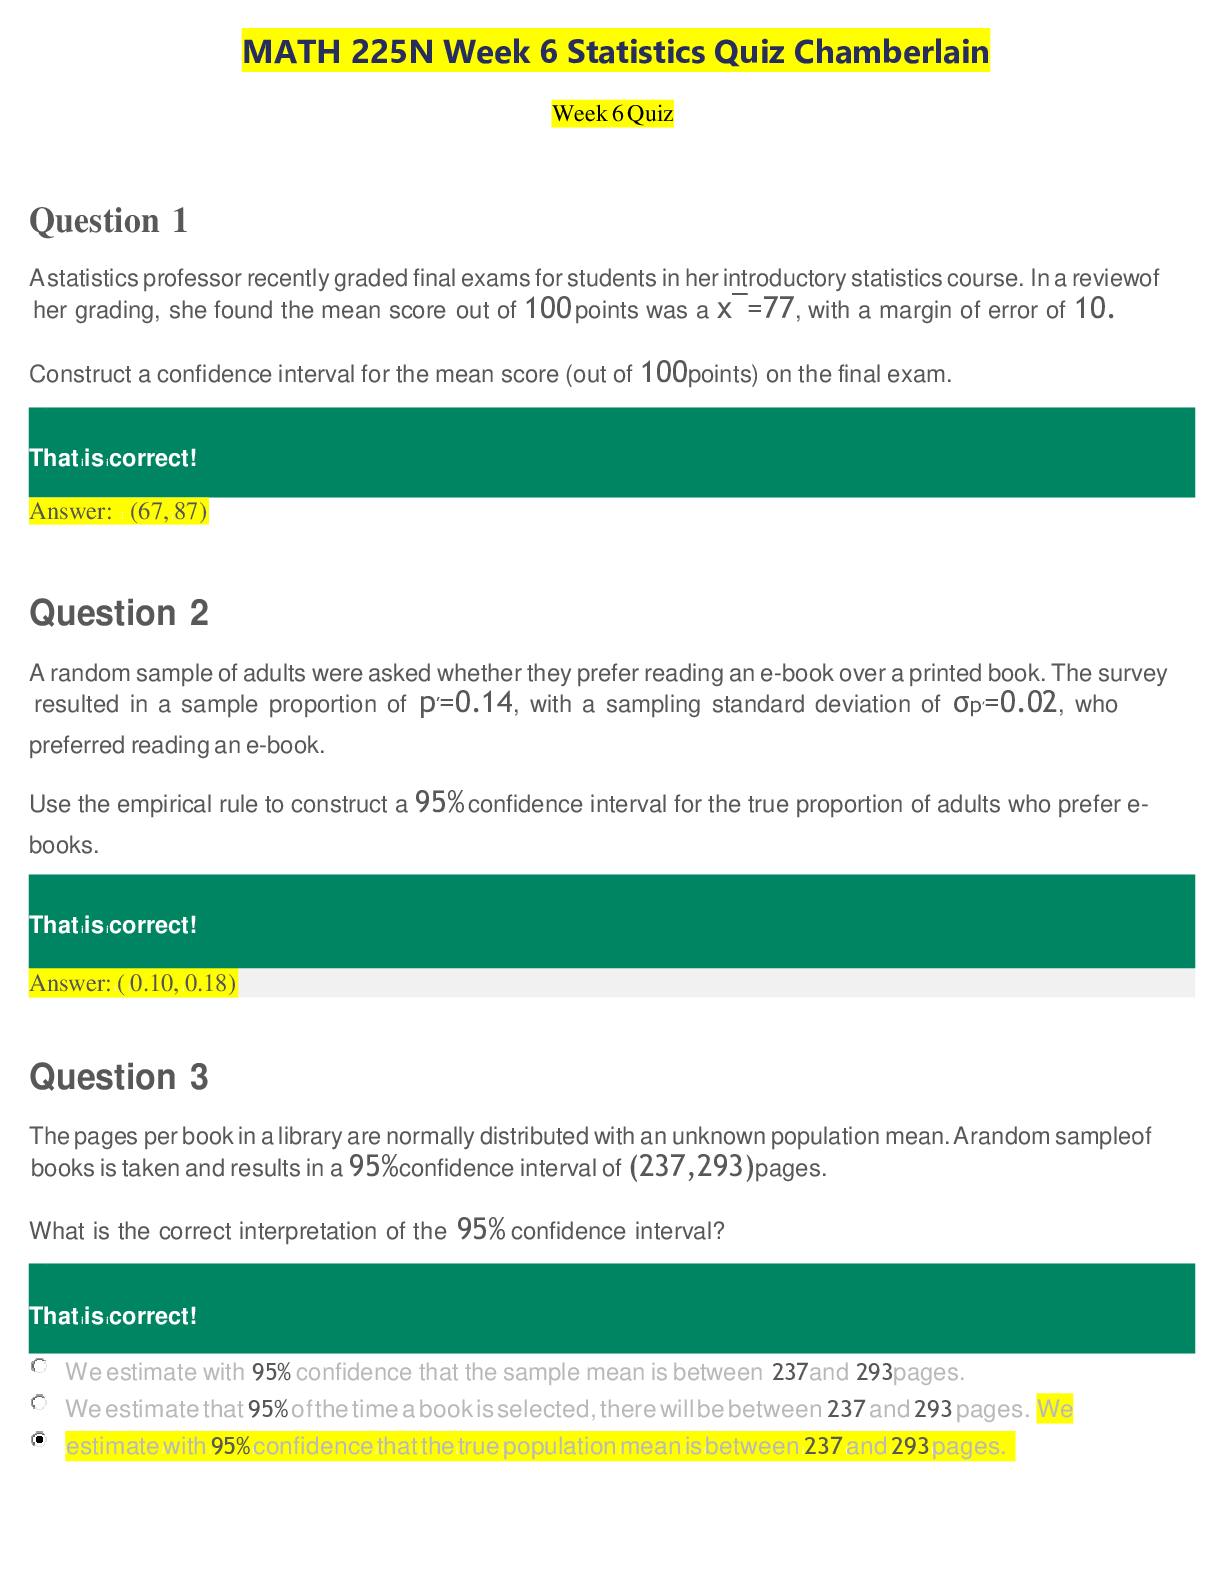
MATH 225N Week 6 Statistics Quiz Chamberlain Week 6 Quiz Question 1 A statistics professor recently graded final exams for students in her introductory statistics course. In a reviewiof her gra... ding, she found the mean score out of 100 points was a x¯=77, with a margin of error of 10. Construct a confidence interval for the mean score (out of 100points) on the final exam. Question 2 A random sample of adults were asked whether they prefer reading an e-book over a printed book. The survey resulted in a sample proportion of p′=0.14, with a sampling standard deviation of σp′=0.02, who preferred reading an e-book. Use the empirical rule to construct a 95% confidence interval for the true proportion of adults who prefer e- books. Question 3 The pages per book in a library are normally distributed with an unknown population mean.Arandom sampleoi f books is taken and results in a 95%confidence interval of (237,293)pages. What is the correct interpretation of the 95% confidence interval? We estimate with 95% confidence that the sample mean is between 237and 293pages. We estimate that 95% of the time abook is selected, there will be between 237 and 293 pages. iWe Question 4 The population standard deviation for the heights of dogs, in inches, in a city is 3.7 inches. If we want tobe 95%confident that the sample mean is within 2 inches of the true population mean, what is the minimum sample size that can be taken? Round up to the nearest integer. Question 5 Clarence wants to estimate the percentage of students who live more than three miles from the school. He wants to create a 98% confidence interval which has an error bound of at most 4%. How many students should bepolled tocreatethe confidence interval? z0.10 z0.05 z0.02 z0.01 z0.005 5 1.28 1.64 1.96 2.32 2.57 2 5 0 6 6 Use the table of values above. Question 6 The average score of a random sample of 87senior business majors at a university who took a certain standardized test follows a normal distribution with a standard deviation of 28. Use Excel to determine a 90% confidence interval for the mean of the population. Round your answers to two decimal places anduse ascending order.. i Score 516 536 462 461 519 i 496 517 488 521 HelpCopy to ClipboardDownload CSV Thatiisicorrect! Answer: i (509.30, i519.18) Question 7 A random sample of 28 statistics tutorials was selected from the past 5 years and the percentage of students absent from each one recorded. The results are given below. Assume the percentages of students' absences are approximately normally distributed. Use Excel to estimate the mean percentage of absences per tutorial over the past 5 years with 90% confidence. Round your answers to two decimal places and use increasing order. 13.9 16.4 12.3 13.2 8.4 4.4 10.3 8.8 4.8 HelpCopy to ClipboardDownload CSV Question 8 Eric is studying people's typing habits. He surveyed 525people and asked whether they leave one space ortwo spaces after a period when typing. 440people responded that they leave one space. Create a 90% confidence interval for the proportion of people who leave one space after a period. • Round your results to four decimal places. Question 9 A sample of 27 employees for the Department of Health and Human Services has the following salaries, in thousands of dollars. Assuming normality, use Excel to find the 98% confidence interval for the true mean salary, in thousands of dollars. Round your answers to two decimal places and use increasing order. Salary 71 70 69 65 72 69 72 72 71 HelpCopy to ClipboardDownload CSV Question 10 The population standard deviation for the heights of dogs, in inches, in a city is 3.7inches. If we want to be 95% confident that the sample mean is within 1 inch of the true population mean, what is the minimum sample size that can be taken? z0.101.282z0.051.645z0.0251.960z0.012.326z0.0052.576 Use the table above for the z-score, and be sure to round up to the nearest integer. Question 11 A random sample of house sizes in major city has a sample mean of x¯=1204.9 sq ft and sample standard deviation of s=124.6 sq ft. Use the Empirical Rule to determine the approximate percentage ofhouse sizes that lie between 955.7and 1454.1sq ft. Round your answer to the nearest whole number (percent). [Show More]
Last updated: 1 year ago
Preview 1 out of 12 pages
Reviews( 0 )
Document information
Connected school, study & course
About the document
Uploaded On
Aug 09, 2022
Number of pages
12
Written in

Additional information
This document has been written for:
Uploaded
Aug 09, 2022
Downloads
0
Views
34

.png)
.png)