Mathematics > TEST BANK > University of the People Statistical Inference MATH 1281. All Quizzes 1-9 Statistics Inference MAT (All)
University of the People Statistical Inference MATH 1281. All Quizzes 1-9 Statistics Inference MATH 1281. All Graded 10.00 out of 10.00 (100%).
Document Content and Description Below
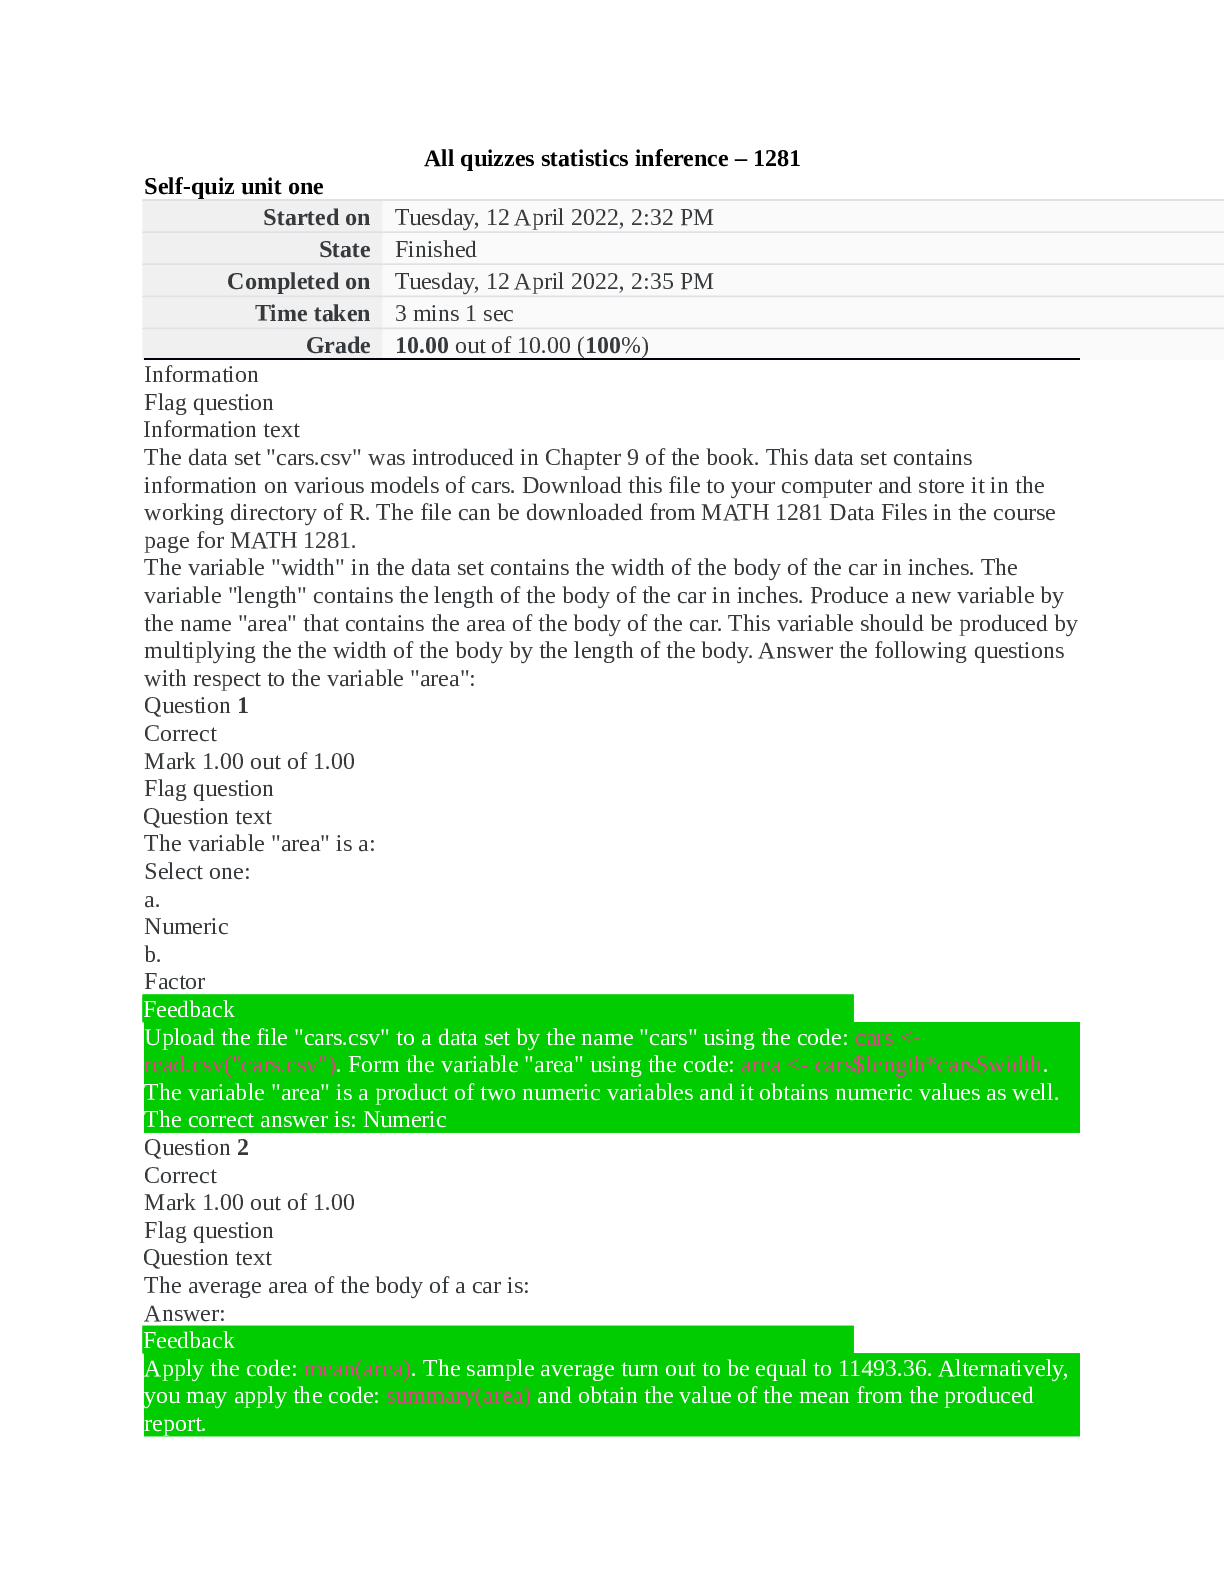
All quizzes statistics inference – 1281. Self-quiz unit one Started on Tuesday, 12 April 2022, 2:32 PM State Finished Completed on Tuesday, 12 April 2022, 2:35 PM Time taken 3 mins 1 sec Grade... 10.00 out of 10.00 (100%) Information Flag question Information text The data set "cars.csv" was introduced in Chapter 9 of the book. This data set contains information on various models of cars. Download this file to your computer and store it in the working directory of R. The file can be downloaded from MATH 1281 Data Files in the course page for MATH 1281. The variable "width" in the data set contains the width of the body of the car in inches. The variable "length" contains the length of the body of the car in inches. Produce a new variable by the name "area" that contains the area of the body of the car. This variable should be produced by multiplying the the width of the body by the length of the body. Answer the following questions with respect to the variable "area": Question 1 Correct Mark 1.00 out of 1.00 Flag question Question text The variable "area" is a: Select one: a. Numeric b. Factor Feedback Upload the file "cars.csv" to a data set by the name "cars" using the code: cars <- read.csv("cars.csv"). Form the variable "area" using the code: area <- cars$length*cars$width. The variable "area" is a product of two numeric variables and it obtains numeric values as well. The correct answer is: Numeric Question 2 Correct Mark 1.00 out of 1.00 Flag question Question text The average area of the body of a car is: Answer: Feedback Apply the code: mean(area). The sample average turn out to be equal to 11493.36. Alternatively, you may apply the code: summary(area) and obtain the value of the mean from the produced report.The correct answer is: 11493.36 Question 3 Correct Mark 1.00 out of 1.00 Flag question Question text The median area of the body of a car is: Answer: Feedback Apply the code: median(area). The sample median turn out to be equal to 11314.2. Alternatively, you may apply the code: summary(area) and obtain the value of the median from the produced report. The correct answer is: 11314.2 Question 4 Correct Mark 1.00 out of 1.00 Flag question Question text The interquartile range of the area is: Answer: Feedback Apply the code: quantile(area,c(0.25,0.75)). The first quartile (Q1) is equal to 10709.72 and the third quartile (Q3) is equal to 12275.90. The difference between Q3 and Q1 is the interquartile range and is equal to IQR = Q3 - Q1 = 1566.18. Alternatively, you may apply the code: summary(area) and obtain the values of Q1 and Q3 from the produced report. The correct answer is: 1566.18 Question 5 Correct Mark 1.00 out of 1.00 Flag question Question text The number of outlier observations in the variable "area" is: Select one: a. 0 b. 1 c. 2 d. 3 e. More than 3 FeedbackYou may produce the box-plot of the variable using the code: boxplot(area). One point in the upper part of the plot represents the outliers. In order to make sure that this point represents a single data point you may produce the table with the code: table(area). The frequency of the largest value is 1. An alternative method for counting the number of data points above the threshold Q3 + 1.5 (Q3- Q1) may use the code: sum(12275.9 + 1.5*1566.18 < area). The count is 1. The correct answer is: 1 Question 6 Correct Mark 1.00 out of 1.00 Flag question Question text The number of missing observations in the variable "area" is: Select one: a. 0 b. Feedback There are no missing values in this variable. The correct answer is: 0 Information Flag question Information text A rectangular body is square if the length is equal to the width. Consider, for each car, the difference between the length and the width of the body. Call this variable X. If cars tend to be square then we would expect the expectation of this variable to be equal to 0. In Chapter 12 we will present a statistical test for testing that the expectation of a variable is equal to 0. The test statistic for this problem is given by: T = X/[S/ √n], where X is the sample average, S is the sample standard deviation, and n is the sample size. In the following questions you are required to determine the region that contains 95% of the values of the test statistic if indeed cars tend to be square in their shape and to check whether or not the evaluation of the test statistic for the "cars" data set falls within this region. Question 7 Correct Mark 1.00 out of 1.00 Flag question Question text Let X1, X2, ..., X205 be a sample of Normal random variables with expectation μ=0 and variance σ2=100. (Namely, standard deviation of σ=10.) The region that contains 95% of the distribution of the statistic T = X/[S/ √205] is best described by:Select one: a. [-19.7,19.7] b. [88.3,127.7] c. [-1.97,1.97] d. [106,110] Feedback The interval that contains 95% of the sampling distribution of the test statistic may be identified via simulations. Run the code: mu <- 0 sig <- 10 test.stat <- rep(0,10^5) for(i in 1:10^5) { X <- rnorm(205,mu,sig) test.stat[i] <- (mean(X))/sqrt(var(X)/205) } quantile(test.stat,c(0.025,0.975)) 2.5% 97.5% -1.958288 1.978535 The result is best described by [-1.97,1.97] The correct answer is: [-1.97,1.97] Question 8 Correct Mark 1.00 out of 1.00 Flag question Question text The standard deviation of the statistic T is Answer: Feedback Run the code: mu <- 0 sig <- 10 test.stat <- rep(0,10^5) for(i in 1:10^5) { X <- rnorm(205,mu,sig) test.stat[i] <- (mean(X))/sqrt(var(X)/205) } sd(test.stat) [1] 1.000478 The standard deviation is approximately equal to 1. The correct answer is: 1 Question 9 Correct Mark 1.00 out of 1.00 Flag questionQuestion text Produce a variable by the name "x" that contains the difference between the length and the width of a car and compute the value of the test statistic for this variable. (Hint: Use the code "x <- cars$length - cars$width" in order to produce "x" and apply the formula for the computation of the statistic to "x".) The value of the statistic for the observed data set "cars" is Answer: Feedback Produce the variable with the code: x <- cars$length - cars$width. The test statistic may be evaluated for the data using the code: mean(x)/sqrt(var(x)/205) The value of the test statistic is 146.1173. The correct answer is: 146.1173 Question 10 Correct Mark 1.00 out of 1.00 Flag question Question text The value of the test statistic for the data set "cars" Select one: a. is inside the region that contains 95% of the sampling distribution of the statistics when cars are square b. is outside of the region that contains 95% of the sampling distribution of the statistics when cars are square Feedback The region is [-1.97,1.97]. The value 146.1173 is outside the region. The correct answer is: is outside of the region that contains 95% of the sampling distribution of the statistics when cars are square Self-quiz unit two Started on Tuesday, 19 April 2022, 11:21 PM State Finished Completed on Tuesday, 19 April 2022, 11:24 PM Time taken 3 mins 49 secs Grade 10.00 out of 10.00 (100%) Information Fl [Show More]
Last updated: 11 months ago
Preview 1 out of 119 pages
.png)
Reviews( 0 )
Document information
Connected school, study & course
About the document
Uploaded On
Mar 24, 2023
Number of pages
119
Written in

Additional information
This document has been written for:
Uploaded
Mar 24, 2023
Downloads
0
Views
94