Economics > AQA A/As Level Question Paper > AS ECONOMICS Paper 2 The National Economy in a Global Context (All)
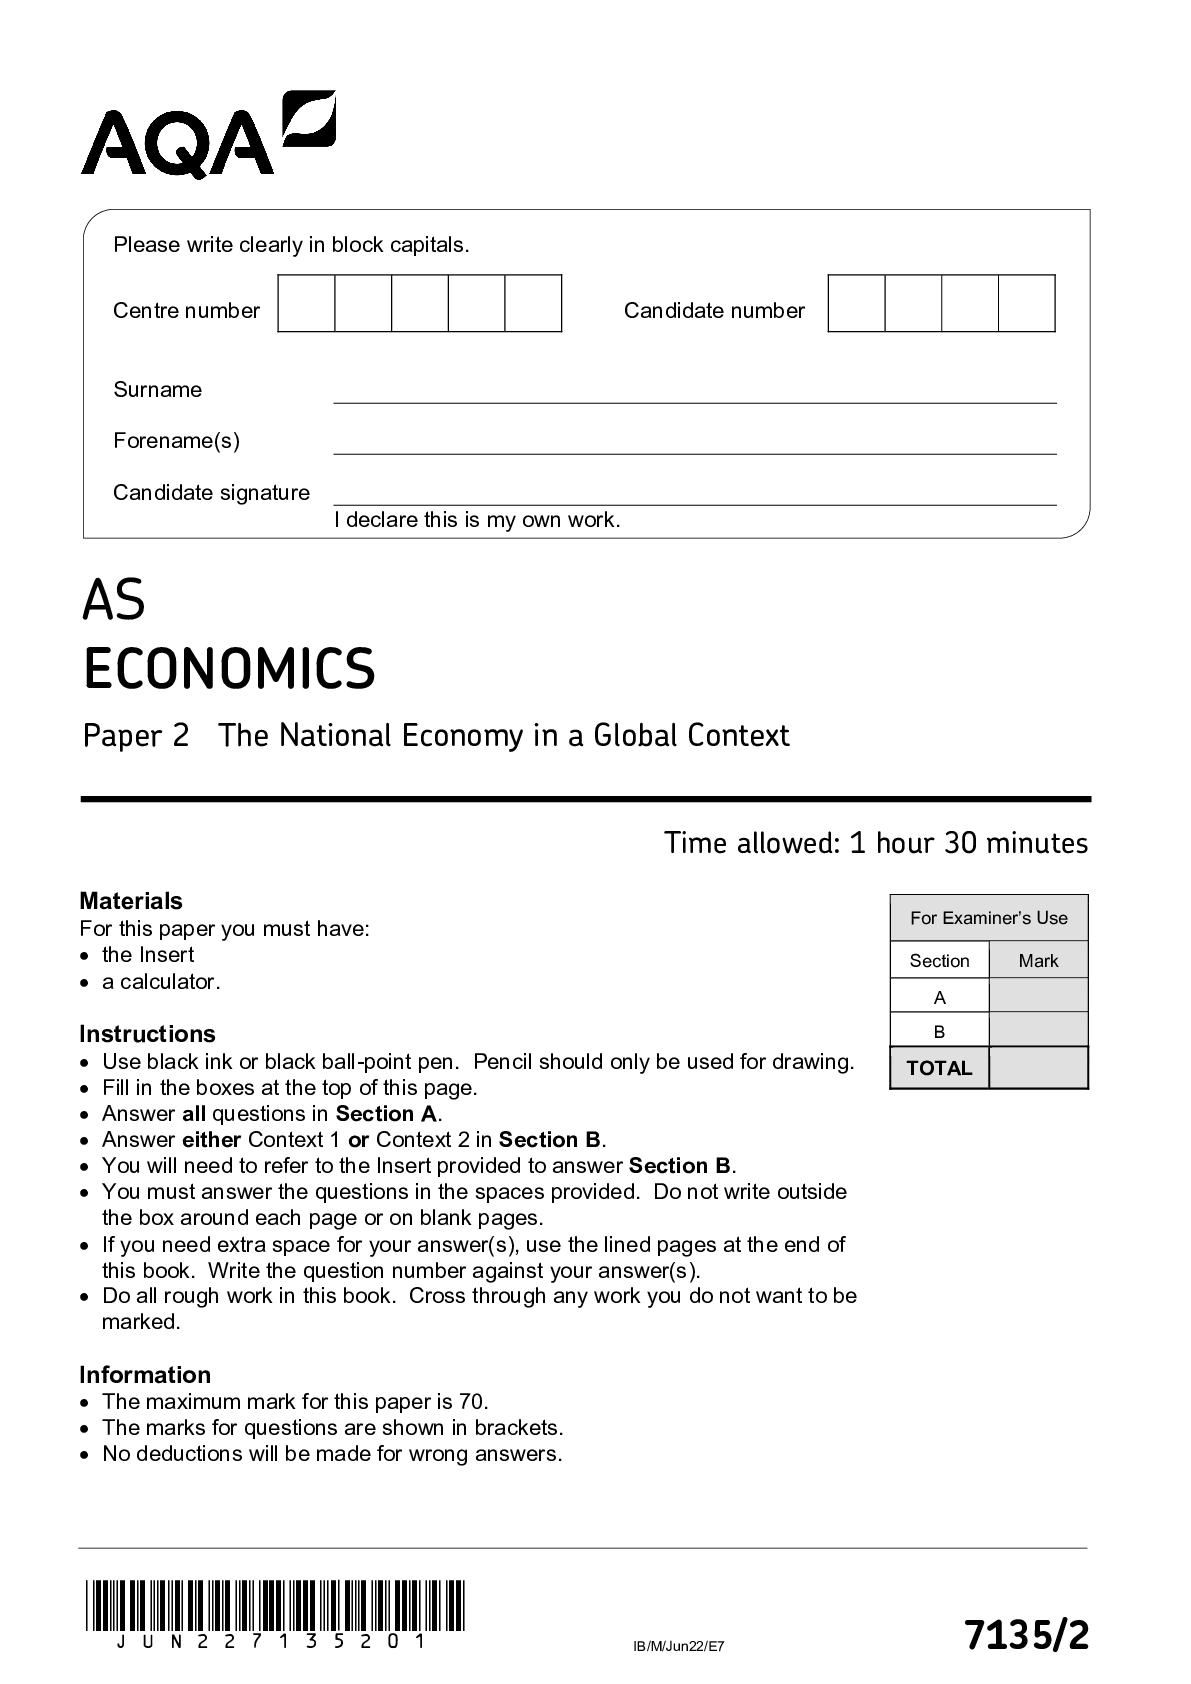
AS ECONOMICS Paper 2 The National Economy in a Global Context
Document Content and Description Below
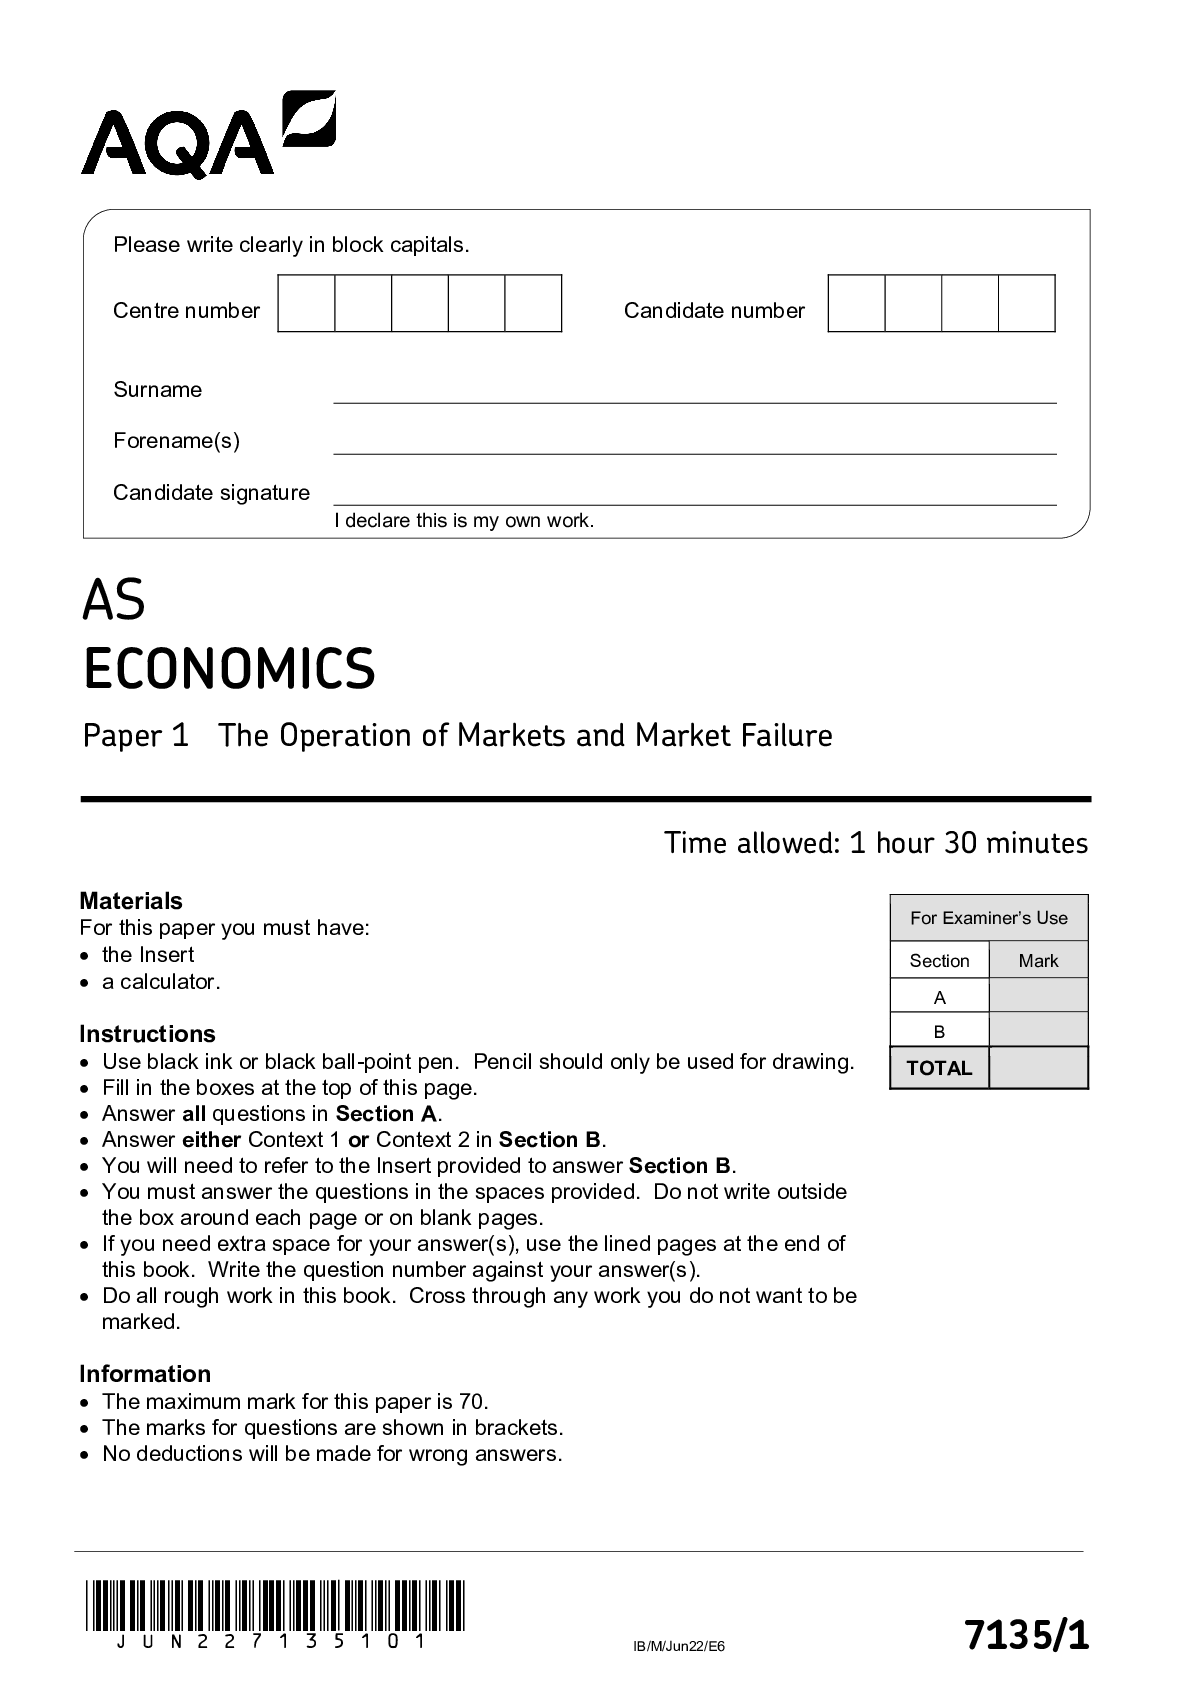
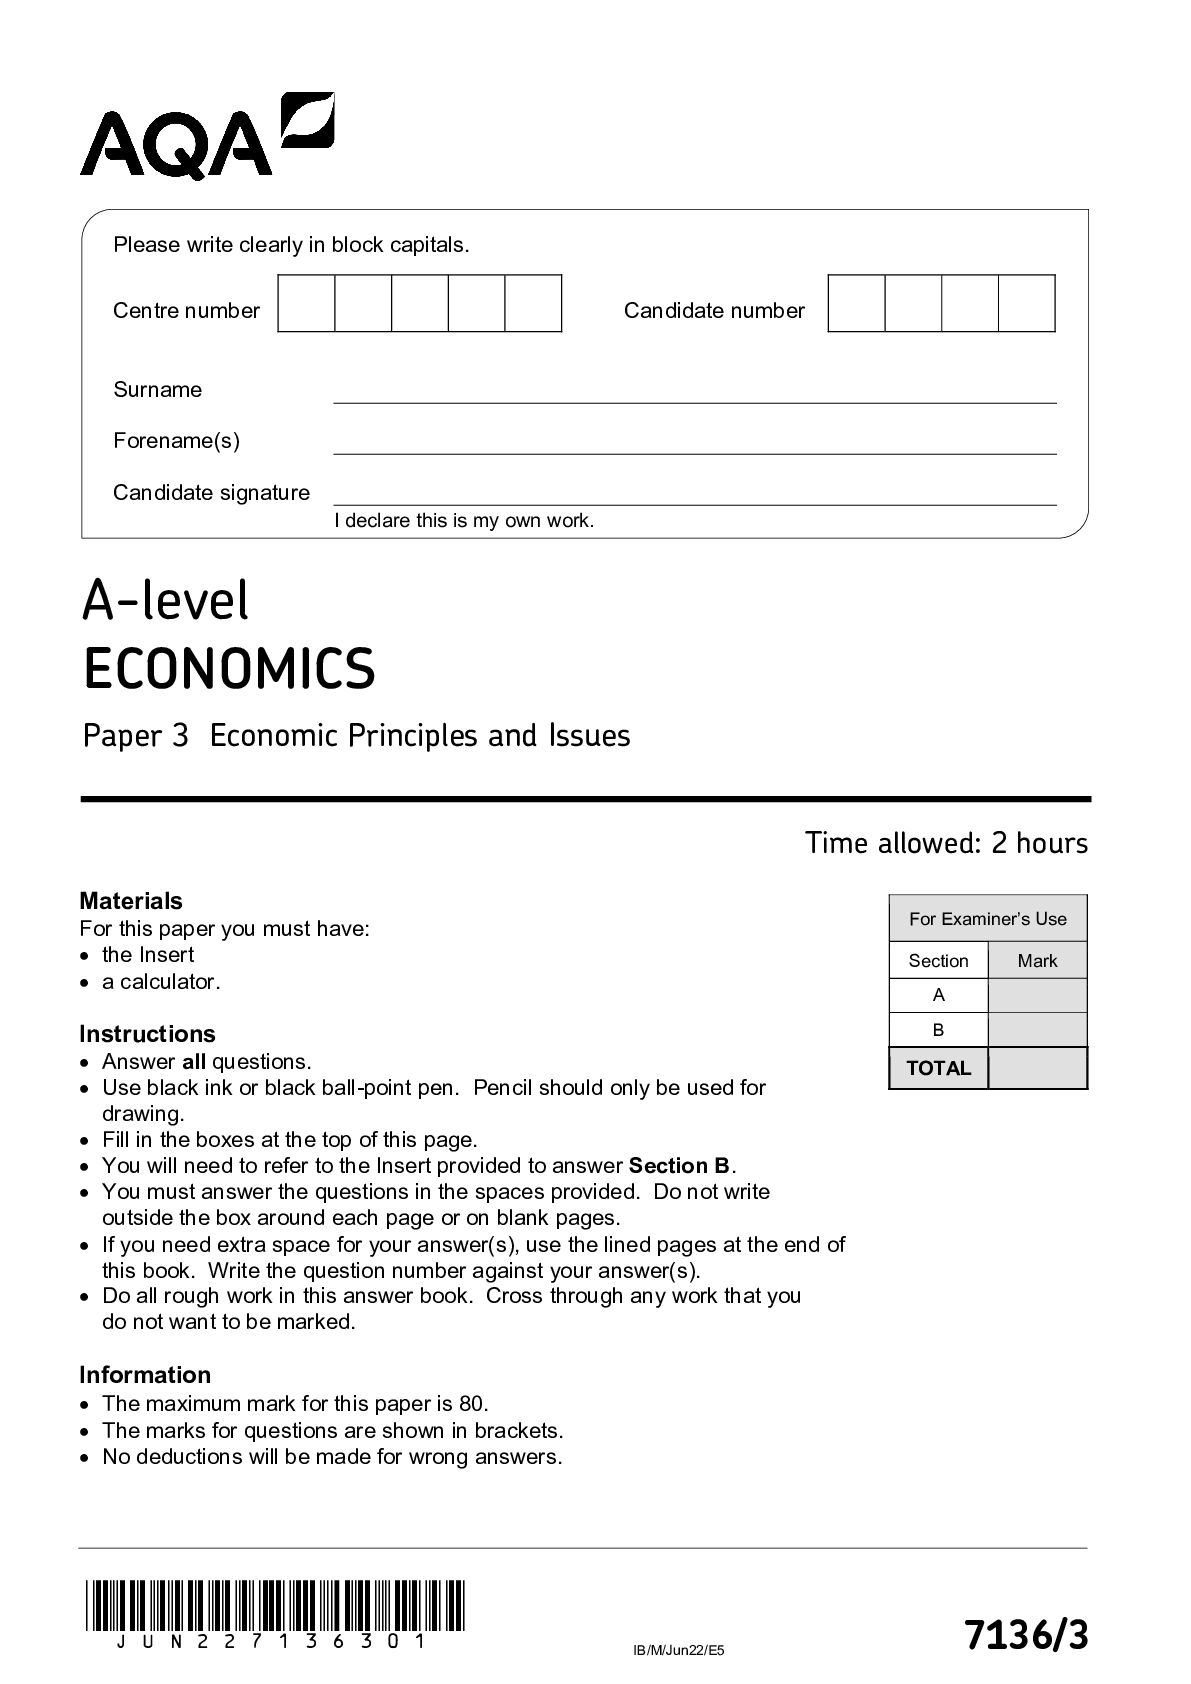
Materials For this paper you must have: • the Insert • a calculator. Instructions • Use black ink or black ball-point pen. Pencil should only be used for drawing. • Fill in the boxes a... t the top of this page. • Answer all questions in Section A. • Answer either Context 1 or Context 2 in Section B. • You will need to refer to the Insert provided to answer Section B. • You must answer the questions in the spaces provided. Do not write outside the box around each page or on blank pages. • If you need extra space for your answer(s), use the lined pages at the end of this book. Write the question number against your answer(s). • Do all rough work in this book. Cross through any work you do not want to be marked. Information • The maximum mark for this paper is 70. • The marks for questions are shown in brackets. • No deductions will be made for wrong answers. Please write clearly in block capitals. Centre number Candidate number Surname Forename(s) Candidate signature I declare this is my own work. AS ECONOMICS Paper 2 The National Economy in a Global Context 2 *02* IB/M/Jun22/7135/2 Do not write outside the Section A box Answer all questions in this section. Only one answer per question is allowed. For each question completely fill in the circle alongside the appropriate answer. CORRECT METHOD WRONG METHODS If you want to change your answer you must cross out your original answer as shown. If you wish to return to an answer previously crossed out, ring the answer you now wish to select as shown. 0 1 Which one of the following is most likely to be an objective of government economic policy? A A low level of employment B A lower price level C An equal distribution of income D An increase in productive potential [1 mark] 3 *03* Turn over ► IB/M/Jun22/7135/2 Do not write outside the 0 2 box Figure 1 shows the aggregate demand (AD) and short-run aggregate supply (SRAS) curves for an economy. Figure 1 Which one of the following combinations of events is most likely to cause the curves to shift from AD1 to AD2 and from SRAS1 to SRAS2? A A higher rate of savings and faster labour productivity growth B Faster economic growth abroad and lower world commodity prices C Higher money wages and more household consumption D Lower interest rates and a higher rate of indirect taxes [1 mark] 0 3 The main reason that economic statistics are often expressed as index numbers is to A allow easier comparison of data. B calculate cost of living data. C convert nominal data to real data. D even out fluctuations in raw data. [1 mark] 4 *04* IB/M/Jun22/7135/2 Do not write outside the 0 4 Unemployment rose in an economy despite overall economic growth. This is most likely to box be explained by an increase in A cyclical unemployment. B job vacancies. C structural unemployment. D the school leaving age. [1 mark] 0 5 An economy experiences an increasing negative output gap. Which one of the following combinations of outcomes most accurately describes the likely effects of this? Imports Inflationary pressure Unemployment A Falling Falling Rising B Falling Rising Falling C Rising Falling Rising D Rising Rising Falling [1 mark] 0 6 A deflationary policy is designed to A avoid deflation. B increase aggregate demand. C lead to deflation. D reduce aggregate demand. [1 mark] 5 *05* Turn over ► IB/M/Jun22/7135/2 Do not write outside the box 0 7 Index numbers for real GDP per head for Country X and Country Y, are shown in Table 1. Table 1 Year Country X Country Y 2016 100 100 2017 102 104 2018 101 103 2019 105 107 From Table 1 it can be concluded that real GDP per head A grew at the same rate between 2018 and 2019 in both countries. B grew every year throughout the period in both countries. C rose faster in Country X between 2017 and 2019. D was higher in Country Y than in Country X from 2017 to 2019. [1 mark] 0 8 Nominal GDP for an economy fell from £318 billion to £310 billion. Average prices also fell over the same period. It can be concluded that A deflation resulted in a recession. B output fell, but by less than £8billion. C real GDP was lower at the end of the period. D real incomes may have risen or fallen. [1 mark] Turn over for the next question 6 *06* IB/M/Jun22/7135/2 Do not write outside the box 0 9 An economy has a positive output gap and the government decides to increase interest rates. Which one of the following outcomes is most likely to result from the higher interest rates? Investment Output gap Savings A Decrease Decrease Increase B Decrease Increase Decrease C Increase Decrease Decrease D Increase Increase Increase [1 mark] 1 0 Faster growth in national income caused investment in an economy to increase. This means that the increase in investment resulted from A an increase in spare capacity. B lower interest rates. C the action of the accelerator. D the action of the multiplier. [1 mark] 1 1 An indirect tax is a tax levied on A firms’ profits. B income. C savings. D spending. [1 mark] 7 *07* Turn over ► IB/M/Jun22/7135/2 Do not write outside the box 1 2 The Bank of England decides to raise interest rates to bring inflation back to its target rate. This policy is less likely to be effective if at the same time A firms’ profits and investment fall. B income tax rates are reduced. C labour productivity grows more quickly. D other countries reduce their demand for UK exports. [1 mark] Turn over for the next question 8 *08* IB/M/Jun22/7135/2 Do not write outside the 1 3 A small island economy suffers extensive damage from a hurricane. The following box diagrams show aggregate demand (AD), short-run aggregate supply (SRAS) and long-run aggregate supply (LRAS) for the economy. Equilibrium before the hurricane is at E1. Which one of the following diagrams shows the most likely position of E2, the equilibrium reached after the hurricane? [1 mark] 9 *09* Turn over ► IB/M/Jun22/7135/2 Do not write outside the box 1 4 Which one of the following is an example of expansionary fiscal policy? A reduction in the A budget deficit. B budget surplus. C trade deficit. D trade surplus. [1 mark] 1 5 Table 2 shows the components of aggregate demand in an economy which is in equilibrium. Table 2 £ billion Consumer expenditure 1000 Investment 200 Government expenditure 350 Exports 150 Imports 200 If imports increase to £230 billion and the multiplier is 1.5, then the new level of national income would be A £1155 billion B £1455 billion C £1545 billion D £1845 billion [1 mark] Turn over for the next question 10 *10* IB/M/Jun22/7135/2 Do not write outside the box 1 6 A government cuts the rate of corporation tax from 30% to 15%. This policy is most likely intended to A decrease the level of savings. B improve labour mobility. C reduce investment from overseas companies. D stimulate supply-side improvements. [1 mark] 1 7 An economy has a deficit on the current account of its balance of payments. Which one of the following sets of circumstances is most likely to cause the deficit to increase? A A depreciating exchange rate and lower unemployment B Better supply-side policies and lower interest rates C Expansionary fiscal policy and a stronger exchange rate D Increased labour productivity and lower interest rates [1 mark] 1 8 An economy experiencing a high rate of short-run economic growth is likely to have an increase in A firms’ spare capacity. B job vacancies. C spending on unemployment benefits. D the real value of money. [1 mark] 11 *11* Turn over ► IB/M/Jun22/7135/2 Do not write outside the box 1 9 In the short run, an increase in government borrowing is most likely to result in lower A consumer expenditure. B government expenditure. C national debt. D unemployment. [1 mark] 2 0 A government wanting to use monetary policy to reduce deflation could decrease the A exchange rate. B minimum wage. C money supply. D rate of indirect tax. [1 mark] END OF SECTION A 20 12 *12* IB/M/Jun22/7135/2 Do not write outside the Section B box Look at the Insert and choose to answer EITHER Context 1 OR Context 2. Answer EITHER Questions 21 to 26 in the spaces below OR Questions 27 to 32 on pages 23 to 32 of this answer booklet. There is a total of 50 marks for either context. Shade the circle below to indicate which context you have answered. Context 0 1 Context 0 2 EITHER Context 1 Total for this context: 50 marks ECONOMIC GROWTH Use the Insert provided to study Questions 21 to 26 and Extracts A, B and C, and then answer the questions in the spaces which follow. 2 1 Define ‘price stability’ Extract B (line 3). [3 marks] WRONG METHODS CORRECT METHOD 13 *13* Turn over ► IB/M/Jun22/7135/2 Do not write outside the box 2 2 If UK GDP was equal to £2073 billion in 2017, use Extract A to calculate, to the nearest billion, the value of UK GDP in 2018. [4 marks] Turn over for the next question 14 *14* IB/M/Jun22/7135/2 Do not write outside the 2 3 Use Extract A box to identify two significant points of comparison between the growth rates of the UK and Germany over the period shown. [4 marks] Comparison 1 Extra space Comparison [Show More]
Last updated: 1 year ago
Preview 1 out of 36 pages
Reviews( 0 )
Document information
Connected school, study & course
About the document
Uploaded On
Apr 01, 2023
Number of pages
36
Written in
Additional information
This document has been written for:
Uploaded
Apr 01, 2023
Downloads
0
Views
74

