Engineering > QUESTIONS & ANSWERS > ESE503 - University of Pennsylvania _ Simulation Modeling & Analysis (Homework #8) (All)
ESE503 - University of Pennsylvania _ Simulation Modeling & Analysis (Homework #8)
Document Content and Description Below
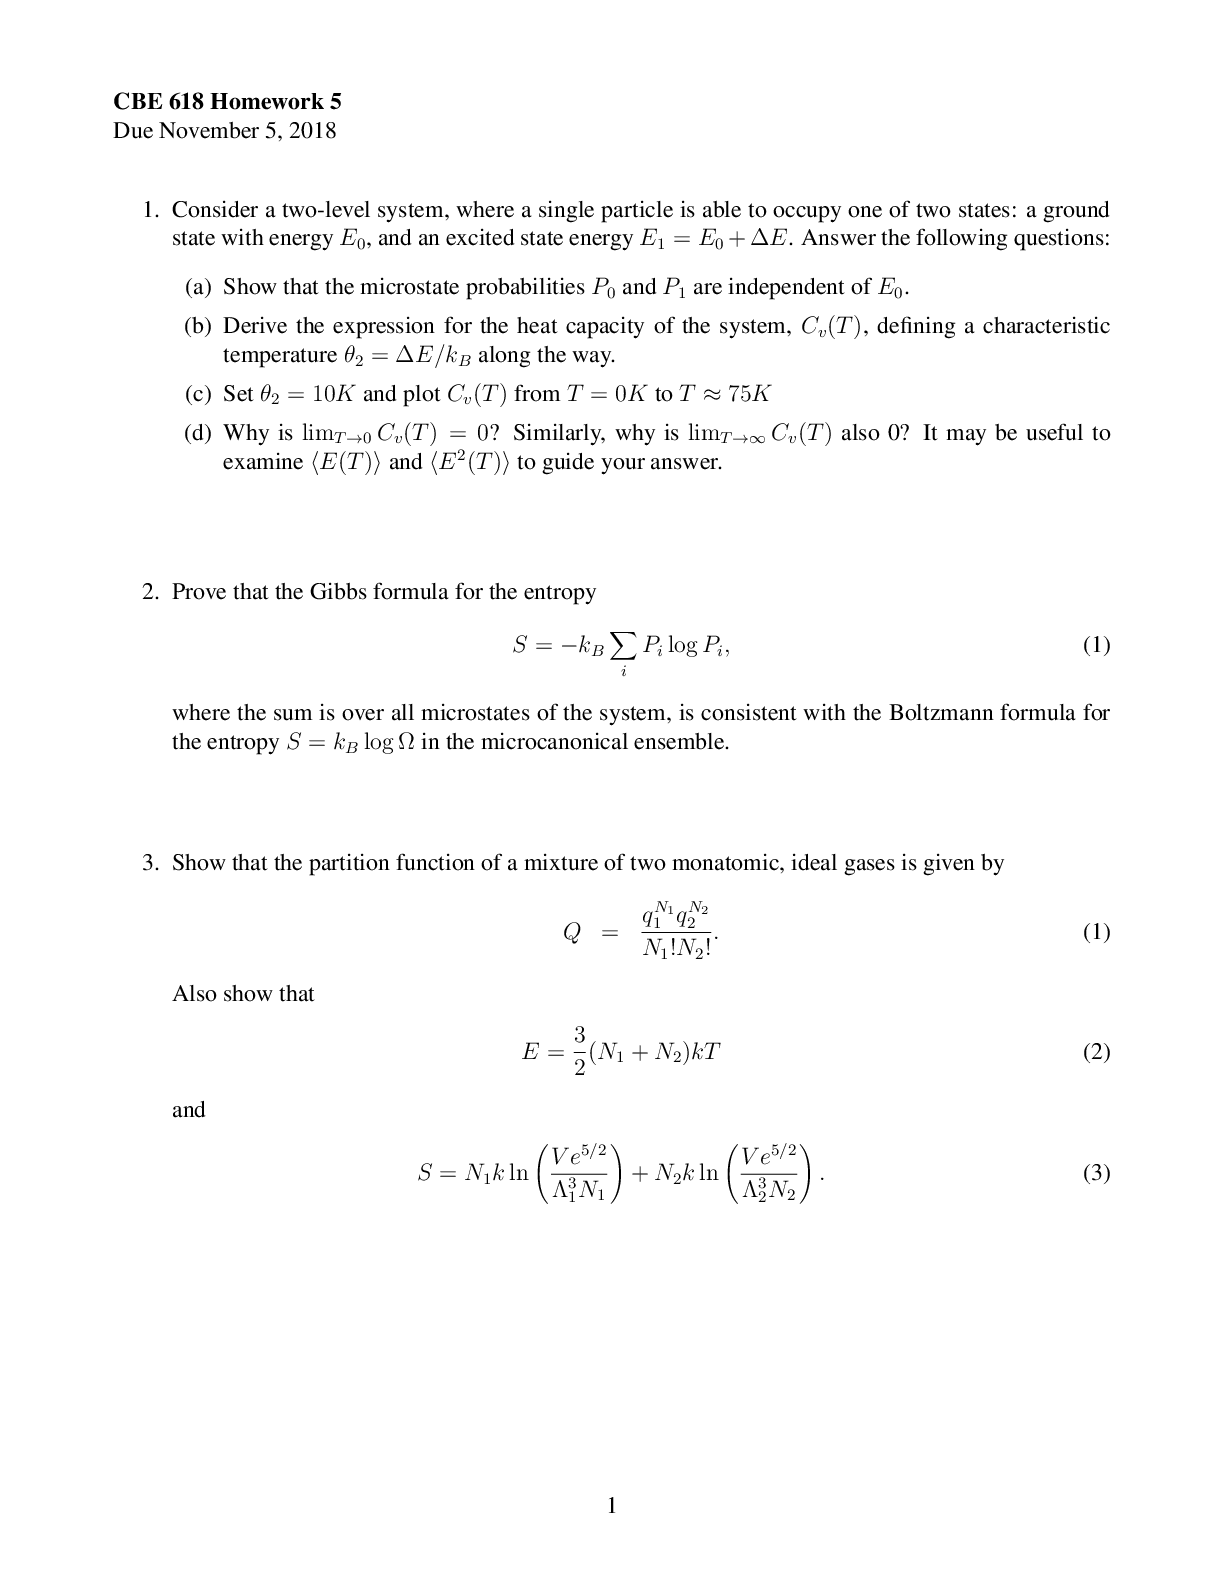
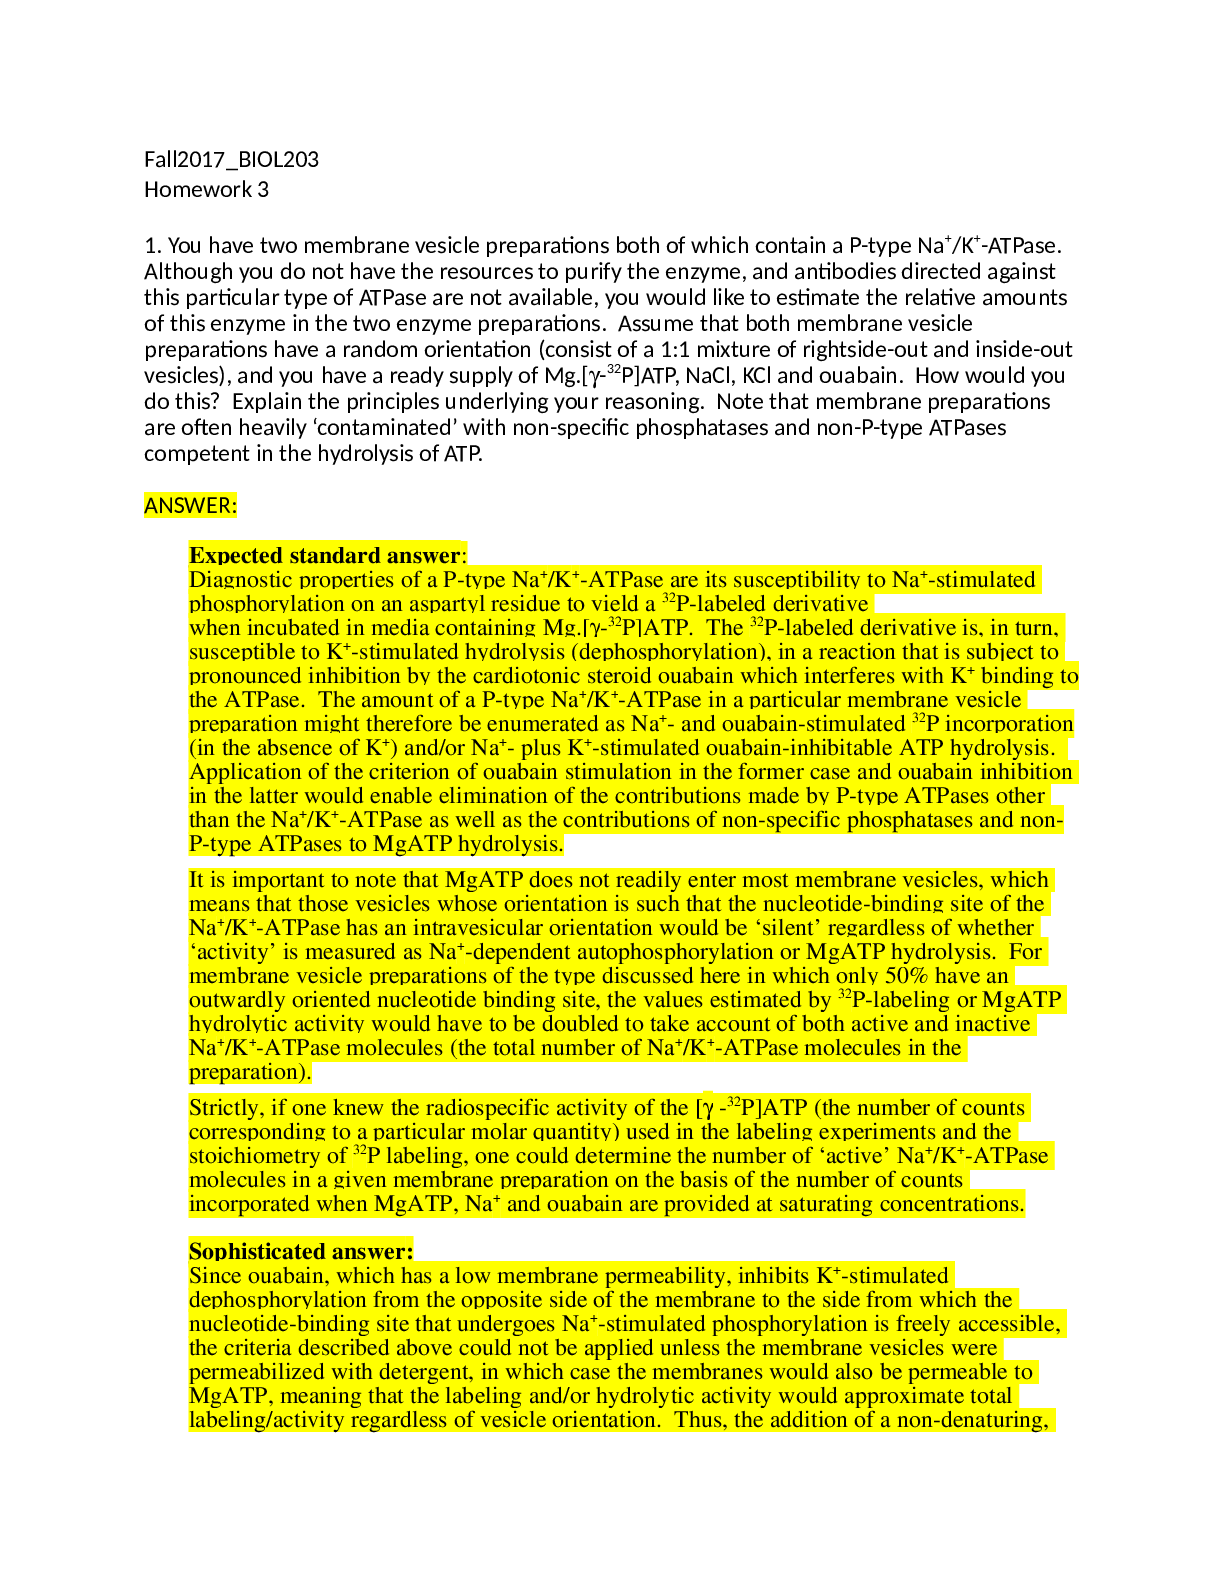
ESE503 - Simulation Modeling & Analysis (Homework #8) Problem #1 (20 points) The lifetimes (in hours) of 20 devices have been measured and the results are shown in the table below. Construct a quan... tile-quantile plot of the data assuming an exponential distribution with mean equal to the sample mean. Compute the best-fit linear regression line and plot it on the quantile-quantile graph. –––––––––––––––––––––––––––––––––––– Problem #2 (15 points) The pdf of the Rayleigh distribution with parameter α > 0 is given by f(x; α) = αxe- 1 2 αx2 for 0 < x. If a random sample {X1, X2, X3, . . . , Xn} is chosen from this distribution, a.) (8 points) determine an expression (in terms of X1, X2, X3, . . . , Xn and n), for the maximum likelihood estimate for the parameter α (call it αML). b.) (7 points) Determine an expression (in terms of X1, X2, X3, . . . , Xn and n), for the estimate you would get by just fitting the expected value of the above distribution to the sample mean (call it αSM). You may use the fact that Z0∞ u2e- 1 2 u2du = rπ2. –––––––––––––––––––––––––––––––––––– 2 –––––––––––––––––––––––––––––––––––– Problem #3 (20 points) Suppose that X is a geometric random variable with parameter γ > 0, so that the pmf and cdf of X are p(x) = (1 - γ)x-1γ and F(x) = 1 - (1 - γ)x, respectively, for x = 1, 2, 3, . . .. A sample {X1, X2, X3, . . . , Xn} from X is collected and a statistic S, defined by S = min{X1, X2, X3, . . . , Xn} is computed. Determine the p-value of S if the following sample {X1, X2, X3, X4, X5} = {4, 2, 3, 5, 2} of X is obtained, given also that γ = 0.153. –––––––––––––––––––––––––––––––––––– 3 –––––––––––––––––––––––––––––––––––– Problem #4 (15 points) Records pertaining to the monthly numbers of job-related injuries at an underground coal mine were being studied by a federal agency. The values for the past 100 months were as follows. a.) (5 points) Apply a chi-square test to these data to test the hypothesis that the underlying distribution is Poisson assuming a level of significance of α = 0.05. b.) (5 points) Apply a chi-square test to these data to test the hypothesis that the underlying distribution is Poisson with a mean of 1.0, assuming a level of significance of α = 0.05. c.) (5 points) What are the differences (if any) in parts (a) and (b), and when might each case arise? –––––––––––––––––––––––––––––––––––– 4 –––––––––––––––––––––––––––––––––––– Problem #5 (15 points) A random sample {0.16, 0.77, 0.48, 0.69, 0.21}, of size n = 5, is taken from a continuous random variable X having pdf f(x, α) = α(α + 2) 2 xα-1(1 - x2) for 1 < α and 0 ≤ x ≤ 1. a.) (8 points) Determine the resulting maximum likelihood estimate for α. Hint: You may use the fact that d(xα-1) dα = xα-1 ln(x) for 1 < α. b.) (7 points) Determine the estimate for α if the mean of the distribution is to equal the sample mean of the data. Hint: You may use the fact that Z01 xndx = n + 1 1 for n 6= -1. Of course, recall the fact that the solution to the equation Az2 + Bz + C = 0 is z = -B ± √B2 - 4AC 2A for A 6= 0. –––––––––– [Show More]
Last updated: 1 year ago
Preview 1 out of 17 pages
Buy this document to get the full access instantly
Instant Download Access after purchase
Add to cartInstant download
We Accept:

Reviews( 0 )
$9.50
Document information
Connected school, study & course
About the document
Uploaded On
Apr 12, 2023
Number of pages
17
Written in

Additional information
This document has been written for:
Uploaded
Apr 12, 2023
Downloads
0
Views
44


 Problem Set 4.png)
.png)
.png)