Basic Statistics > Presentation > measures of central tendancy 1 (All)
measures of central tendancy 1
Document Content and Description Below
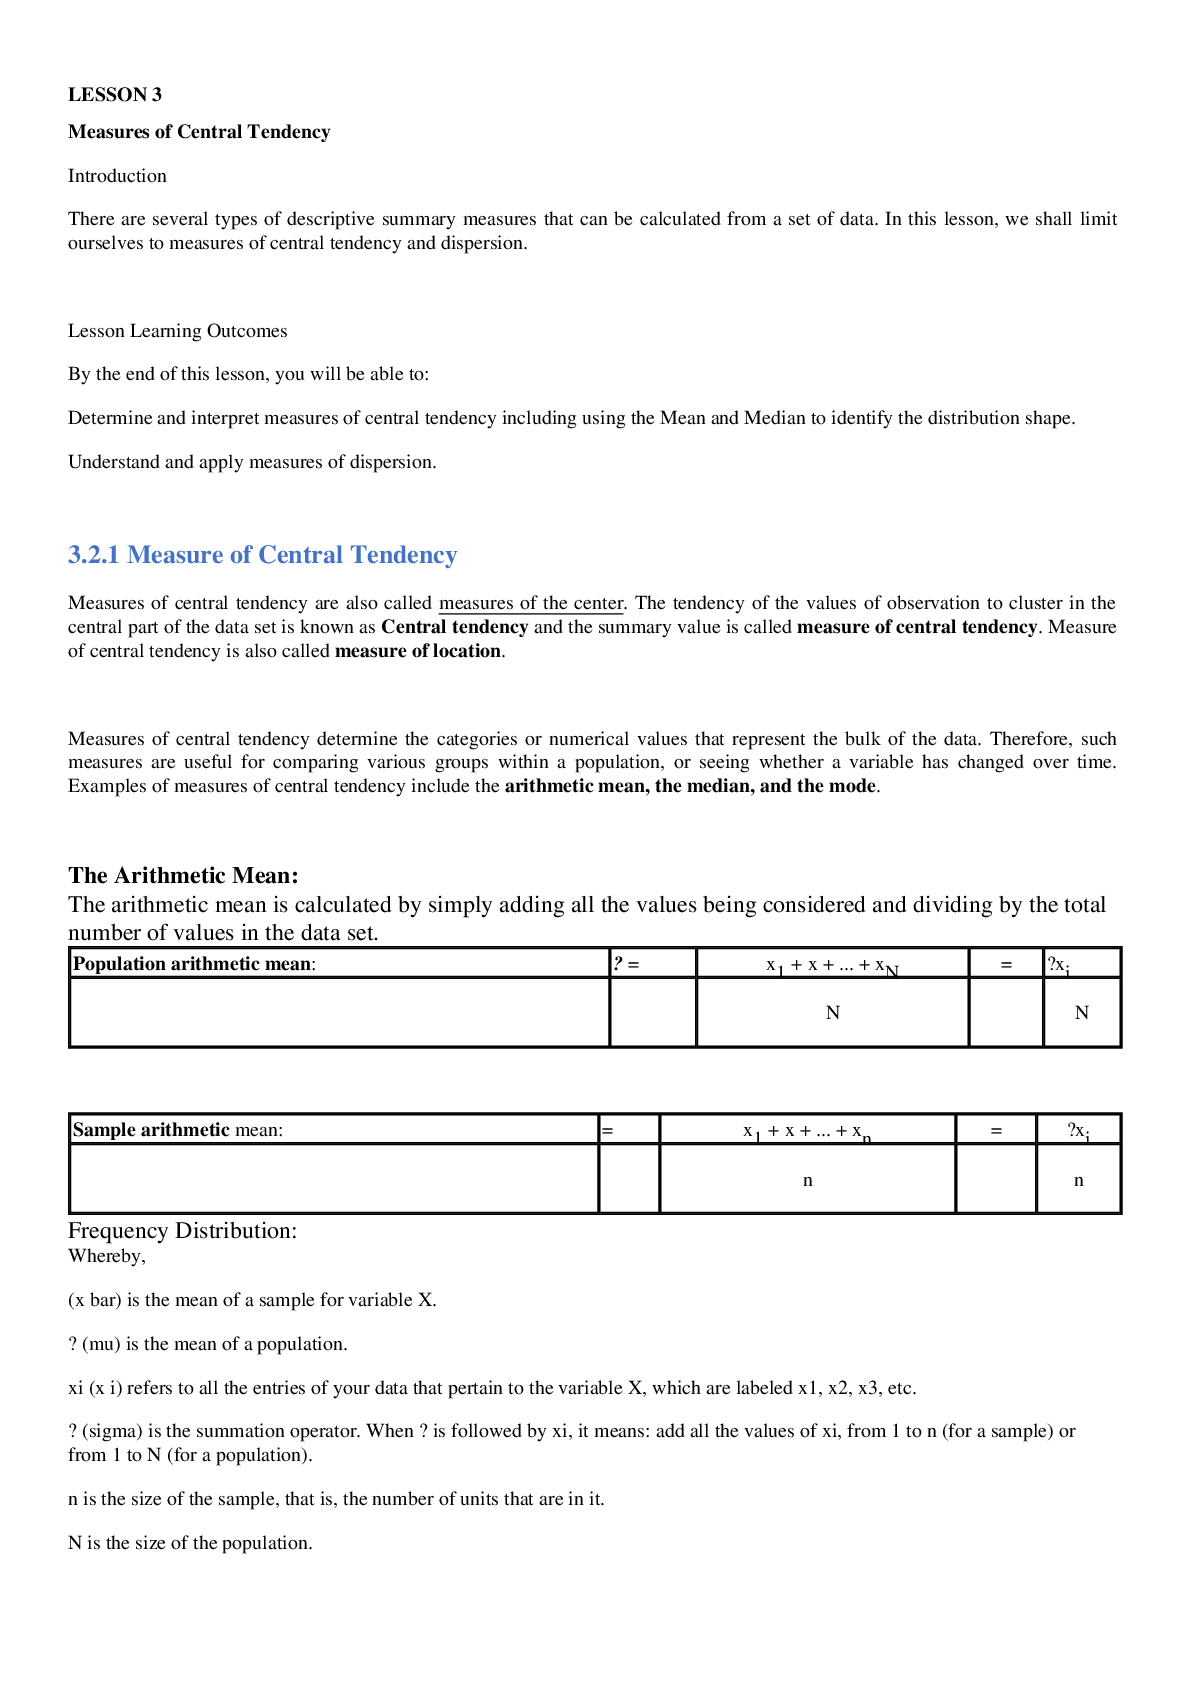
3.1 Introduction There are several types of descriptive summary measures that can be calculated from a set of data. In this lesson, we shall limit ourselves to measures of central tendency and disper... sion. 3.2 Lesson Learning Outcomes By the end of this lesson, you will be able to: 3.2.1ine Determand interpret measures of central tendency including using the Mean and Median to identify the distribution shape. 3.2.2 Understand and apply measures of dispersion. 3.2.1 Measure of Central Tendency Measures of central tendency are also called measures of the center. The tendency of the values of observation to cluster in the central part of the data set is known as Central tendency and the summary value is called measure of central tendency. Measure of central tendency is also called measure of location. Measures of central tendency determine the categories or numerical values that represent the bulk of the data. Therefore, such measures are useful for comparing various groups within a population, or seeing whether a variable has changed over time. Examples of measures of central tendency include the arithmetic mean, the median, and the mode. The Arithmetic Mean: The arithmetic mean is calculated by simply adding all the values being considered and dividing by the total number of values in the data set. Population arithmetic mean: μ = x1 + x + ... + xN = Σxi N N Sample arithmetic mean: = x1 + x + ... + xn = Σxi n n Frequency Distribution: Whereby, – (x bar) is the mean of a sample for variable X. – μ (mu) is the mean of a population. – xi (x i) refers to all the entries of your data that pertain to the variable X, which are labeled x1, x2, x3, etc. – Σ (sigma) is the summation operator. When Σ is followed by xi, it means: add all the values of xi, from 1 to n (for a sample) or from 1 to N (for a population). – n is the size of the sample, that is, the number of units that are in it. – N is the size of the population. [Show More]
Last updated: 9 months ago
Preview 1 out of 5 pages
Reviews( 1 )

by jones · 9 months ago
Document information
Connected school, study & course
About the document
Uploaded On
Aug 07, 2023
Number of pages
5
Written in

Additional information
This document has been written for:
Uploaded
Aug 07, 2023
Downloads
1
Views
40