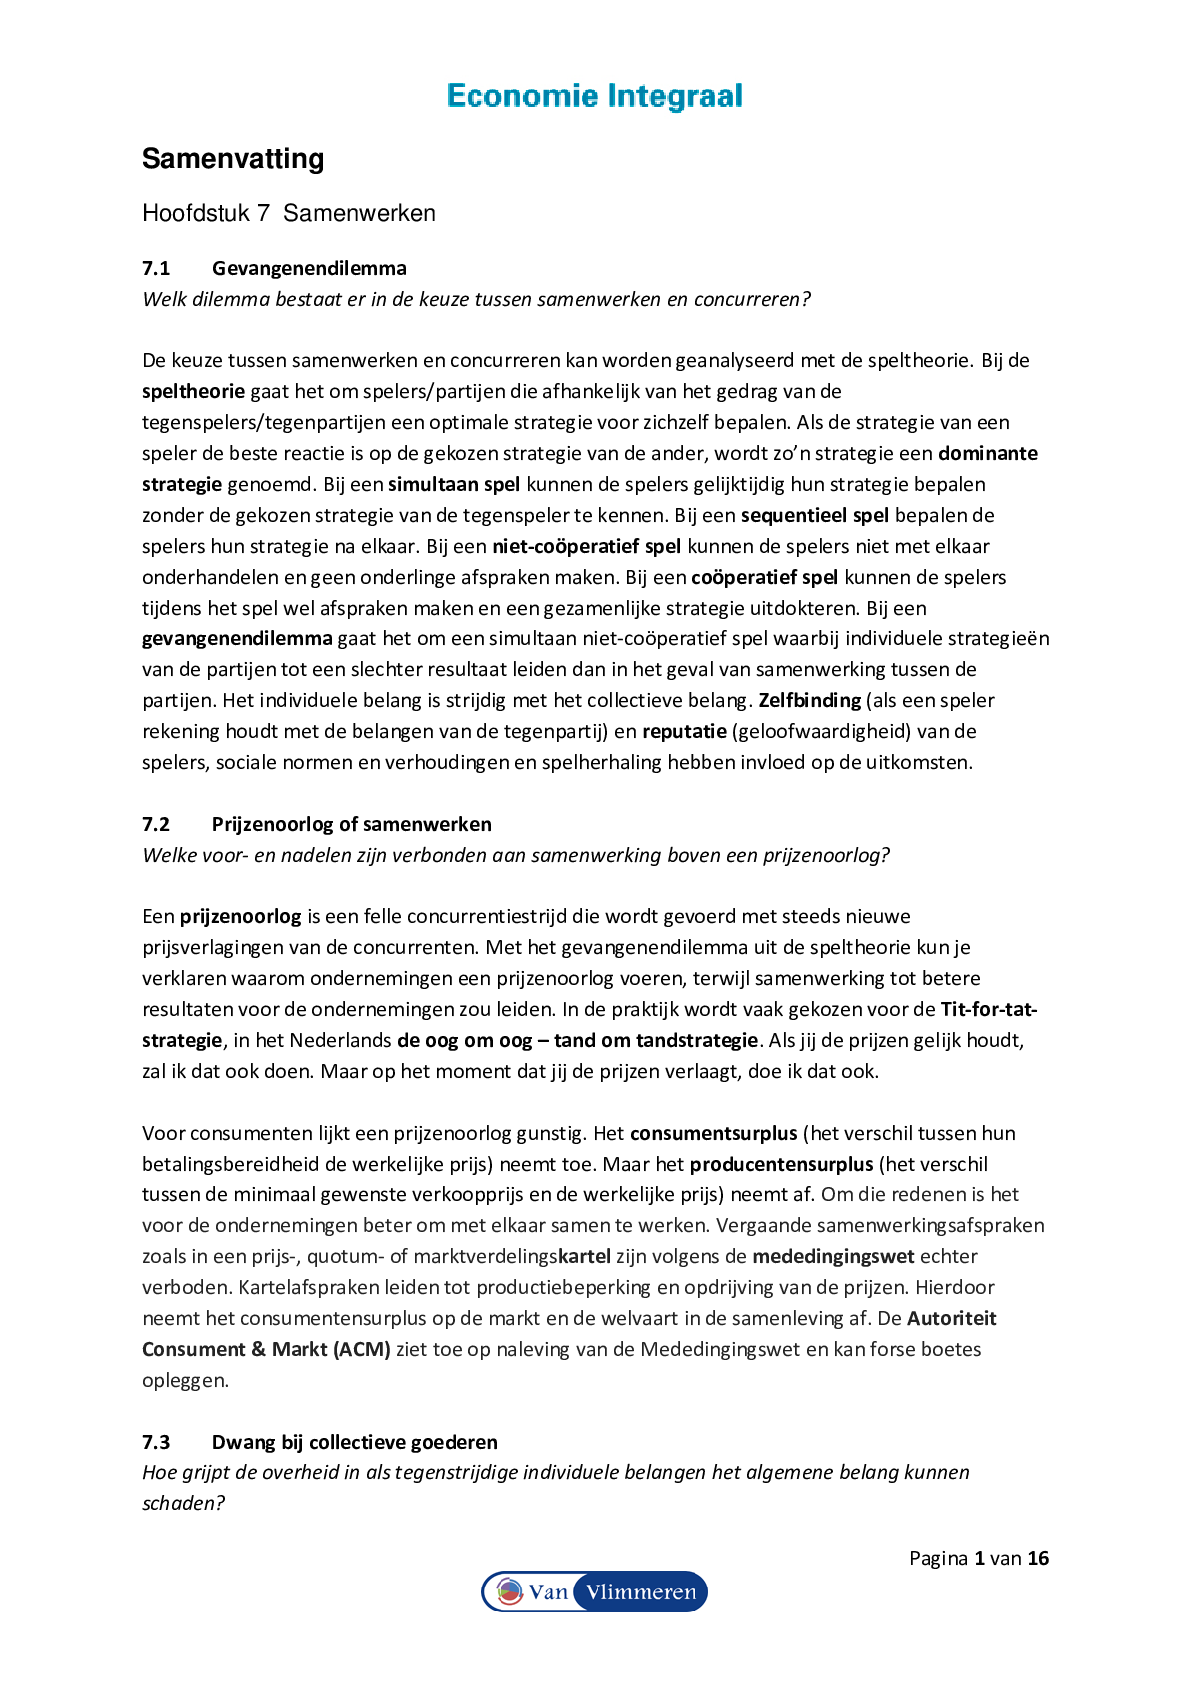
Economics and Statistics > SUMMARY > Applied Statistics for Economics and Business (All)
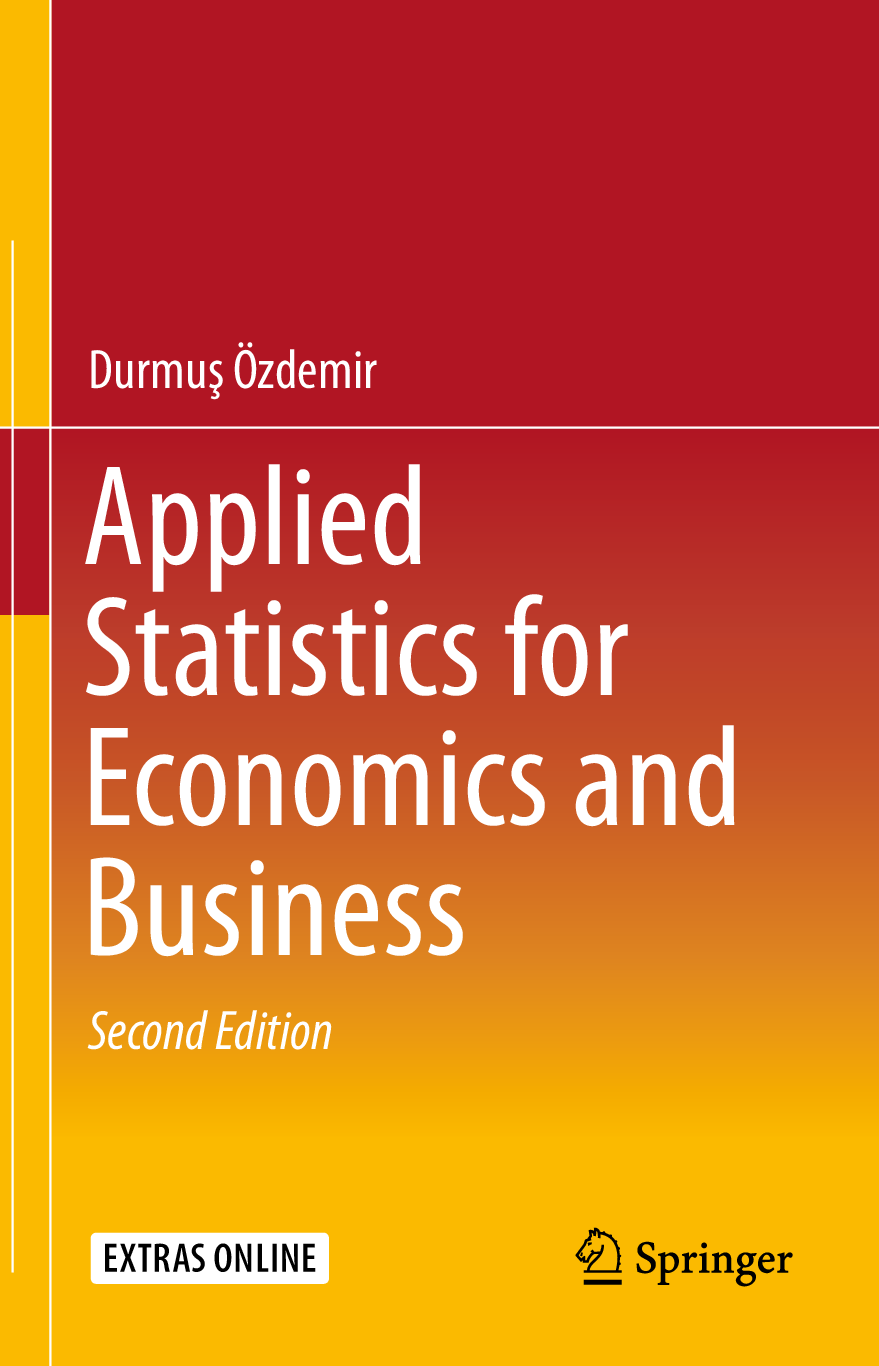
Applied Statistics for Economics and Business
Document Content and Description Below
1 Collecting Data . . . . . . . . . . . . . . . . . . . . . . . . . . . . . . . . . . . . . . . . 1 1.1 Introduction . . . . . . . . . . . . . . . . . . . . . . . . . . . . . . . . . . . . . . 1 1.2... Sources of Data . . . . . . . . . . . . . . . . . . . . . . . . . . . . . . . . . . . 2 1.2.1 Data Published by Industrial, Governmental or Individual Sources . . . . . . . . . . . . . . . . . . . . . . . . 2 1.2.2 Experiments . . . . . . . . . . . . . . . . . . . . . . . . . . . . . . 3 1.2.3 Observation . . . . . . . . . . . . . . . . . . . . . . . . . . . . . . . 3 1.2.4 Sources Created by Information Technology . . . . . . . 4 1.2.5 Surveys, Panel Surveys and Longitudinal Studies . . . 4 1.3 Questionnaire Design . . . . . . . . . . . . . . . . . . . . . . . . . . . . . . . 6 1.4 Employment and Earning Survey Questionnaire . . . . . . . . . . . . 8 1.5 A Review of This Chapter . . . . . . . . . . . . . . . . . . . . . . . . . . . . 12 1.6 Review Problems for Data Collecting . . . . . . . . . . . . . . . . . . . 13 2 Data Presentation: Graphs, Frequency Tables and Histograms . . . 15 2.1 Introduction . . . . . . . . . . . . . . . . . . . . . . . . . . . . . . . . . . . . . . 15 2.2 Simple Graphs and Charts . . . . . . . . . . . . . . . . . . . . . . . . . . . . 15 2.2.1 Bar Charts . . . . . . . . . . . . . . . . . . . . . . . . . . . . . . . . 15 2.2.2 Pareto Charts . . . . . . . . . . . . . . . . . . . . . . . . . . . . . . 17 2.2.3 Pie Charts . . . . . . . . . . . . . . . . . . . . . . . . . . . . . . . . 18 2.2.4 XY Graphs . . . . . . . . . . . . . . . . . . . . . . . . . . . . . . . 19 2.3 Histograms . . . . . . . . . . . . . . . . . . . . . . . . . . . . . . . . . . . . . . . 19 2.3.1 Frequency Density . . . . . . . . . . . . . . . . . . . . . . . . . . 23 2.3.2 Frequency Polygon . . . . . . . . . . . . . . . . . . . . . . . . . 25 2.3.3 Cumulative Frequency Distribution . . . . . . . . . . . . . . 26 2.3.4 Relative Frequency Distribution . . . . . . . . . . . . . . . . 26 2.4 A Review of This Chapter . . . . . . . . . . . . . . . . . . . . . . . . . . . . 27 2.5 Review Problems for Graphical Presentation . . . . . . . . . . . . . . 27 2.6 Computing Practical for Graphs and Charts in Economics . . . . 30 2.6.1 Using Paint . . . . . . . . . . . . . . . . . . . . . . . . . . . . . . . 30 2.6.2 Using Excel . . . . . . . . . . . . . . . . . . . . . . . . . . . . . . . 31 v Measures of Location . . . . . . . . . . . . . . . . . . . . . . . . . . . . . . . . . . . 35 3.1 Introduction . . . . . . . . . . . . . . . . . . . . . . . . . . . . . . . . . . . . . . 35 3.2 Arithmetic Mean . . . . . . . . . . . . . . . . . . . . . . . . . . . . . . . . . . 35 3.2.1 Un-Tabuled Data (Ungrouped Data) . . . . . . . . . . . . . 36 3.2.2 Tabulated (Grouped Data) . . . . . . . . . . . . . . . . . . . . 36 3.3 Median . . . . . . . . . . . . . . . . . . . . . . . . . . . . . . . . . . . . . . . . . 37 3.3.1 Calculating the Median for Ungrouped Data . . . . . . . 38 3.3.2 Calculation of the Median for Grouped Data . . . . . . . 39 3.3.3 Find the Appropriate Class Interval . . . . . . . . . . . . . . 40 3.4 Mode . . . . . . . . . . . . . . . . . . . . . . . . . . . . . . . . . . . . . . . . . . . 42 3.4.1 A Simple Example with Ungrouped Data . . . . . . . . . 42 3.4.2 Grouped Data . . . . . . . . . . . . . . . . . . . . . . . . . . . . . 42 3.4.3 The Mode by Calculation . . . . . . . . . . . . . . . . . . . . . 42 3.4.4 The Mode by Graphical Method . . . . . . . . . . . . . . . . 43 3.4.5 Another Example . . . . . . . . . . . . . . . . . . . . . . . . . . . 45 3.5 Other Measures of Location . . . . . . . . . . . . . . . . . . . . . . . . . . 45 3.5.1 The Geometric Mean . . . . . . . . . . . . . . . . . . . . . . . . 45 3.5.2 Harmonic Mean . . . . . . . . . . . . . . . . . . . . . . . . . . . . 46 3.6 Comparison . . . . . . . . . . . . . . . . . . . . . . . . . . . . . . . . . . . . . . 47 3.7 A Review of This chapter . . . . . . . . . . . . . . . . . . . . . . . . . . . . 47 3.7.1 Use the Mode . . . . . . . . . . . . . . . . . . . . . . . . . . . . . 47 3.7.2 Use the Median . . . . . . . . . . . . . . . . . . . . . . . . . . . . 47 3.7.3 Use the Mean . . . . . . . . . . . . . . . . . . . . . . . . . . . . . 47 3.8 Review Problems for Measures of Location . . . . . . . . . . . . . . . 47 4 Measures of Dispersion . . . . . . . . . . . . . . . . . . . . . . . . . . . . . . . . . . 51 4.1 Introduction . . . . . . . . . . . . . . . . . . . . . . . . . . . . . . . . . . . . . . 51 4.2 The Range . . . . . . . . . . . . . . . . . . . . . . . . . . . . . . . . . . . . . . . 52 4.3 Quartiles . . . . . . . . . . . . . . . . . . . . . . . . . . . . . . . . . . . . . . . . 52 4.4 The Inter-quartile Range . . . . . . . . . . . . . . . . . . . . . . . . . . . . . 53 4.5 The Variance . . . . . . . . . . . . . . . . . . . . . . . . . . . . . . . . . . . . . 56 4.6 The Standard Deviation . . . . . . . . . . . . . . . . . . . . . . . . . . . . . 60 4.7 The Variance and the Standard Deviation of a Sample . . . . . . . 60 4.8 The Coefficient of Variation . . . . . . . . . . . . . . . . . . . . . . . . . . 64 4.9 Measuring Skewness . . . . . . . . . . . . . . . . . . . . . . . . . . . . . . . . 64 4.10 A Review of This Chapter . . . . . . . . . . . . . . . . . . . . . . . . . . . . 65 4.10.1 Review Problems for Measures of Dispersion . . . . . . 65 4.10.2 Computing Practical For Calculation of Mean, Median, Mode and Standard Deviation . . . . . . . . . . . 67 5 Index Numbers . . . . . . . . . . . . . . . . . . . . . . . . . . . . . . . . . . . . . . . . 73 5.1 Introduction . . . . . . . . . . . . . . . . . . . . . . . . . . . . . . . . . . . . . . 73 5.2 A Simple Interpretation of an Index Number . . . . . . . . . . . . . . 73 5.3 A Simple Price Index . . . . . . . . . . . . . . . . . . . . . . . . . . . . . . . 74 5.4 Changing the Base Year . . . . . . . . . . . . . . . . . . . . . . . . . . . . . 75 [Show More]
Last updated: 6 months ago
Preview 1 out of 315 pages
Reviews( 0 )
Document information
Connected school, study & course
About the document
Uploaded On
Nov 07, 2023
Number of pages
315
Written in
Additional information
This document has been written for:
Uploaded
Nov 07, 2023
Downloads
0
Views
29

