Mathematics > Final Exam Review > Statistic Final MATH 225N MATH Questions with correct answers for best grades (All)
Statistic Final MATH 225N MATH Questions with correct answers for best grades
Document Content and Description Below
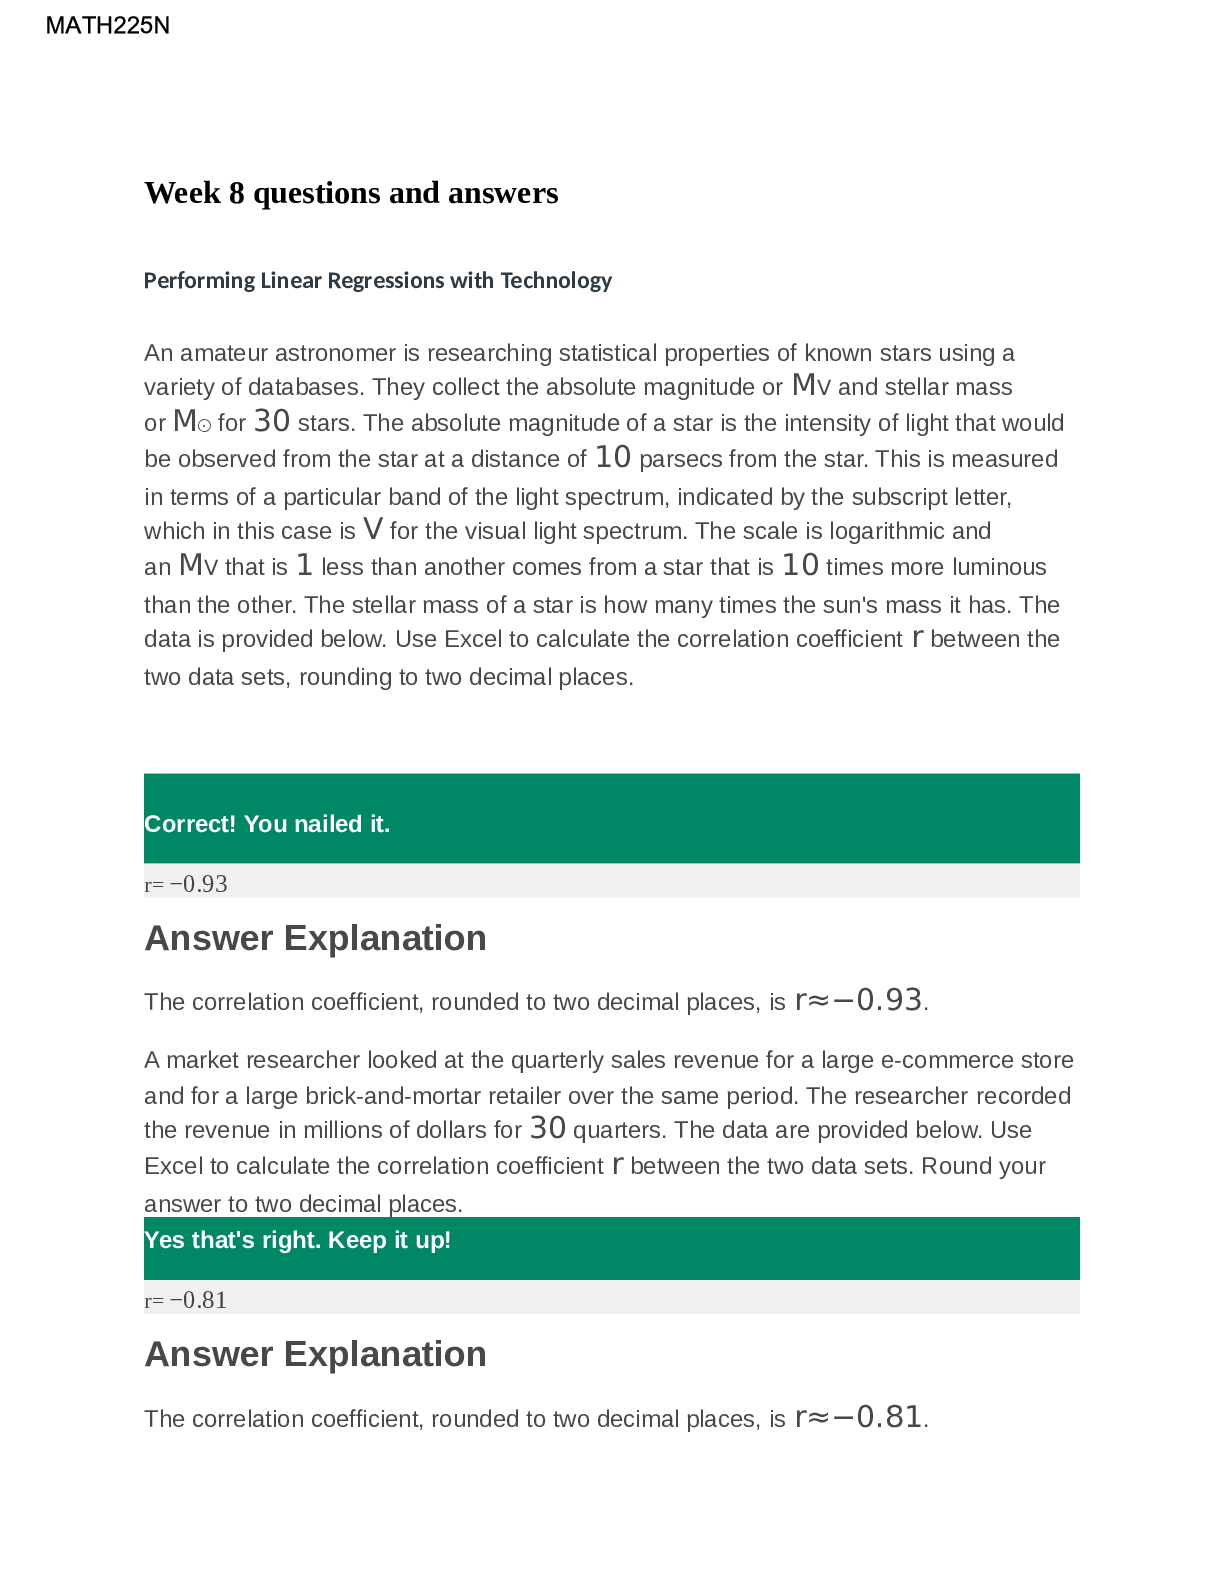
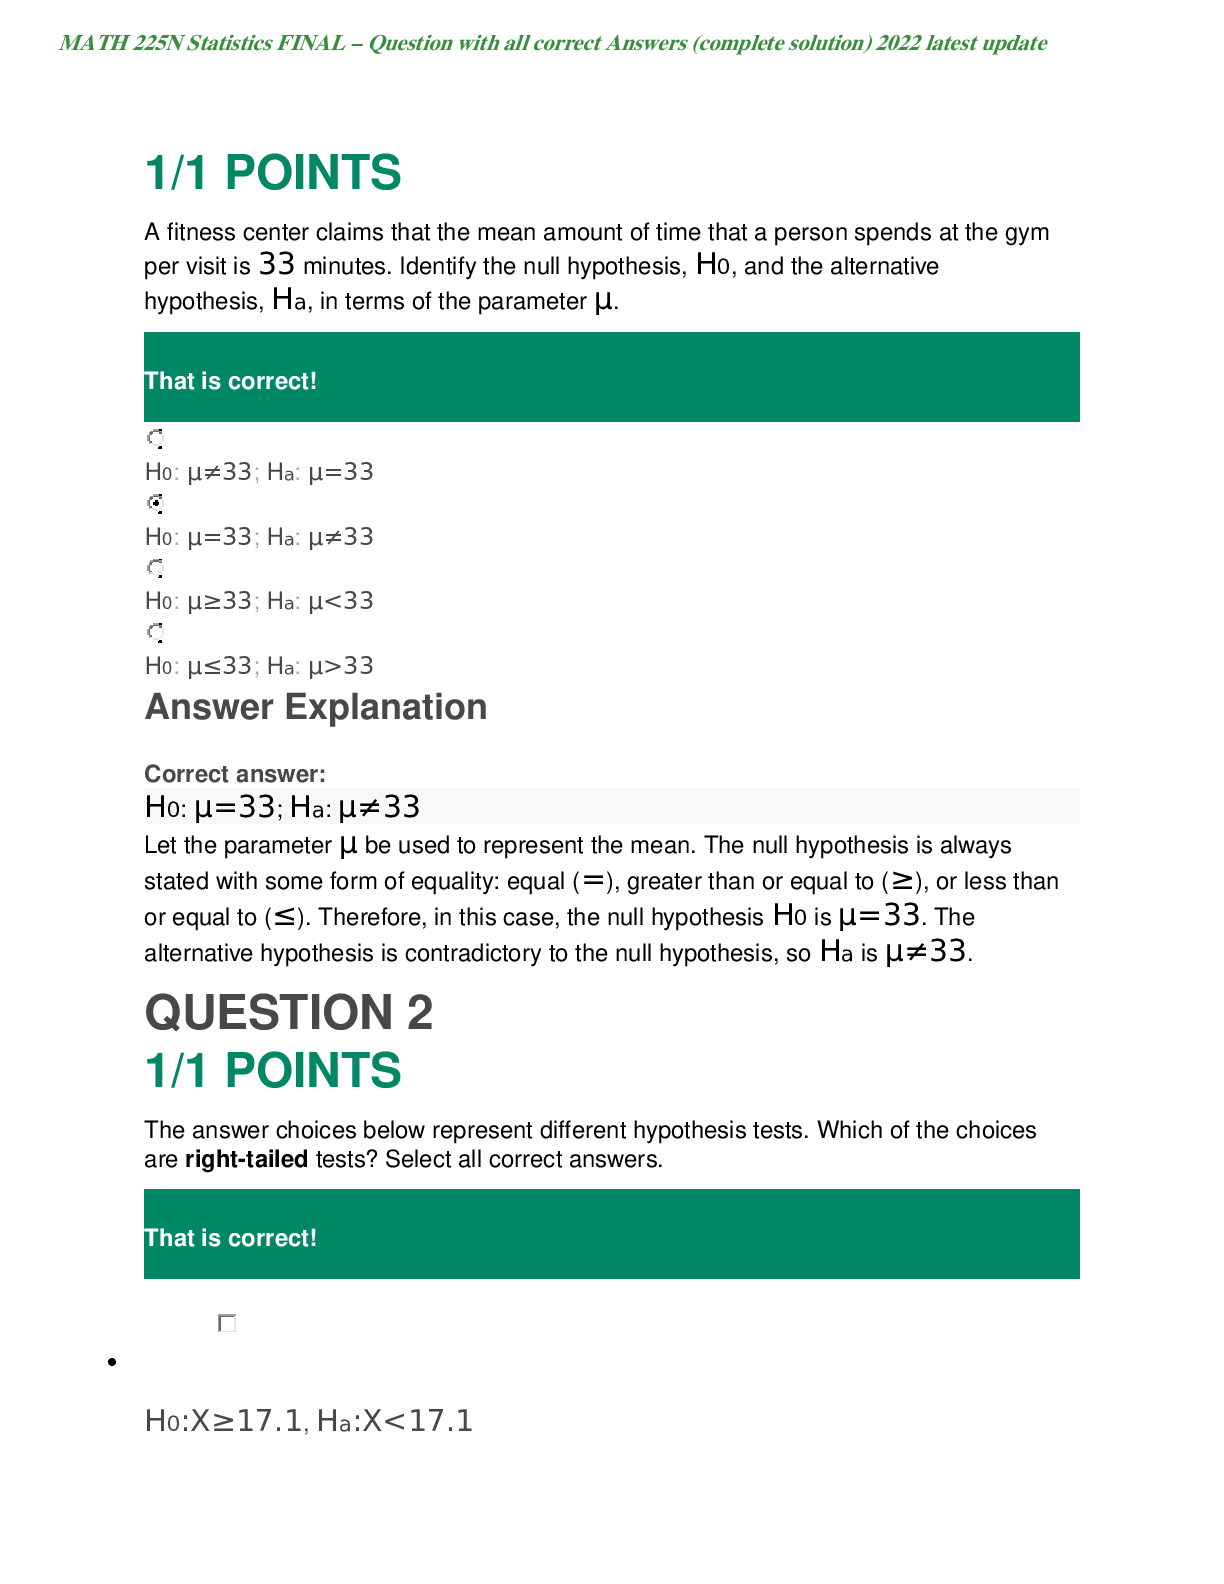
Statistic Final . 1/1 POINTS A fitness center claims that the mean amount of time that a person spends at the gym per visit is 33 minutes. Identify the null hypothesis, H0, and the alternative hypot... hesis, Ha, in terms of the parameter μ. ________________________________________ QUESTION 2 1/1 POINTS The answer choices below represent different hypothesis tests. Which of the choices are right-tailed tests? Select all correct answers. QUESTION 3 0/1 POINTS Find the Type II error given that the null hypothesis, H0, is: a building inspector claims that no more than 15% of structures in the county were built without permits. ________________________________________ QUESTION 4 1/1 POINTS Suppose a chef claims that her meatball weight is less than 4 ounces, on average. Several of her customers do not believe her, so the chef decides to do a hypothesis test, at a 10% significance level, to persuade them. She cooks 14 meatballs. The mean weight of the sample meatballs is 3.7 ounces. The chef knows from experience that the standard deviation for her meatball weight is 0.5 ounces. • H0: μ≥4; Ha: μ<4 • α=0.1 (significance level) What is the test statistic (z-score) of this one-mean hypothesis test, rounded to two decimal places? ________________________________________ QUESTION 5 1/1 POINTS What is the p-value of a right-tailed one-mean hypothesis test, with a test statistic of z0=1.74? (Do not round your answer; compute your answer using a value from the table below.) z1.51.61.71.81.90.000.9330.9450.9550.9640.9710.010.9340.9460.9560.9650.9720.020.9360.9470.9570.9660.9730.030.9370.9480.9580.9660.9730.040.9380.9490.9590.9670.9740.050.9390.9510.9600.9680.9740.060.9410.9520.9610.9690.9750.070.9420.9530.9620.9690.9760.080.9430.9540.9620.9700.9760.090.9440.9540.9630.9710.977 QUESTION 6 1/1 POINTS Kenneth, a competitor in cup stacking, claims that his average stacking time is 8.2 seconds. During a practice session, Kenneth has a sample stacking time mean of 7.8 seconds based on 11 trials. At the 4% significance level, does the data provide sufficient evidence to conclude that Kenneth's mean stacking time is less than 8.2 seconds? Accept or reject the hypothesis given the sample data below. • H0:μ=8.2 seconds; Ha:μ<8.2 seconds • α=0.04 (significance level) • z0=−1.75 • p=0.0401 QUESTION 7 1/1 POINTS A recent study suggested that 81% of senior citizens take at least one prescription medication. Amelia is a nurse at a large hospital who would like to know whether the percentage is the same for senior citizen patients who go to her hospital. She randomly selects 59 senior citizens patients who were treated at the hospital and finds that 49 of them take at least one prescription medication. What are the null and alternative hypotheses for this hypothesis test? ________________________________________ QUESTION 8 1/1 POINTS A researcher claims that the proportion of cars with manual transmission is less than 10%. To test this claim, a survey checked 1000 randomly selected cars. Of those cars, 95 had a manual transmission. The following is the setup for the hypothesis test: {H0:p=0.10Ha:p<0.10 Find the test statistic for this hypothesis test for a proportion. Round your answer to 2 decimal places. QUESTION 9 1/1 POINTS A medical researcher claims that the proportion of people taking a certain medication that develop serious side effects is 12%. To test this claim, a random sample of 900 people taking the medication is taken and it is determined that 93 people have experienced serious side effects. . The following is the setup for this hypothesis test: H0:p = 0.12 Ha:p ≠ 0.12 Find the p-value for this hypothesis test for a proportion and round your answer to 3 decimal places. The following table can be utilized which provides areas under the Standard Normal Curve: z 0.00 0.01 0.02 0.03 0.04 0.05 0.06 0.07 0.08 0.09 -1.8 0.036 0.035 0.034 0.034 0.033 0.032 0.031 0.031 0.030 0.029 -1.7 0.045 0.044 0.043 0.042 0.041 0.040 0.039 0.038 0.038 0.037 -1.6 0.055 0.054 0.053 0.052 0.051 0.049 0.048 0.047 0.046 0.046 -1.5 0.067 0.066 0.064 0.063 0.062 0.061 0.059 0.058 0.057 0.056 -1.4 0.081 0.079 0.078 0.076 0.075 0.074 0.072 0.071 0.069 0.068 QUESTION 10 1/1 POINTS An economist claims that the proportion of people who plan to purchase a fully electric vehicle as their next car is greater than 65%. To test this claim, a random sample of 750 people are asked if they plan to purchase a fully electric vehicle as their next car Of these 750 people, 513 indicate that they do plan to purchase an electric vehicle. The following is the setup for this hypothesis test: H0:p=0.65 Ha:p>0.65 In this example, the p-value was determined to be 0.026. Come to a conclusion and interpret the results for this hypothesis test for a proportion (use a significance level of 5%.) ________________________________________ QUESTION 11 1/1 POINTS Becky's statistics teacher was teaching the class how to perform the z-test for a proportion. Becky was bored because she had already mastered the test, so she decided to see if the coin she had in her pocket would come up heads or tails in a truly random fashion when flipped. She discretely flipped the coin 30 times and got heads 18 times. Becky conducts a one-proportion hypothesis test at the 5% significance level, to test whether the true proportion of heads is different from 50%. QUESTION 12 1/1 POINTS John owns a computer repair service. For each computer, he charges $50 plus $45 per hour of work. A linear equation that expresses the total amount of money John earns per computer is y=50+45x. What are the independent and dependent variables? What is the y-intercept and the slope? ________________________________________ QUESTION 13 1/1 POINTS Ariana keeps track of the amount of time she studies and the score she gets on her quizzes. The data are shown in the table below. Which of the scatter plots below accurately records the data? Hours studying Quiz score 1 5 2 5 3 7 4 9 5 9 ________________________________________ QUESTION 14 1/1 POINTS Data is collected on the relationship between time spent playing video games and time spent with family. The data is shown in the table and the line of best fit for the data is y^=−0.27x+57.5. Assume the line of best fit is significant and there is a strong linear relationship between the variables. Video Games (Minutes) 306090120 Time with Family (Minutes) 50403525 According to the line of best fit, the predicted number of minutes spent with family for someone who spent 95 minutes playing video games is 31.85. Is it reasonable to use this line of best fit to make the above prediction? ________________________________________ QUESTION 15 0/1 POINTS Which of the following are feasible equations of a least squares regression line for the annual population change of a small country from the year 2000 to the year 2015? Select all that apply. ________________________________________ QUESTION 17 1/1 POINTS An amateur astronomer is researching statistical properties of known stars using a variety of databases. They collect the color index, or B−V index, and distance (in light years) from Earth for 30 stars. The color index of a star is the difference in the light absorption measured from the star using two different light filters (a B and a V filter). This then allows the scientist to know the star's temperature and a negative value means a hot blue star. A light year is the distance light can travel in 1 year, which is approximately 5.9 trillion miles. The data is provided below. Use Excel to calculate the correlation coefficient r between the two data sets, rounding to two decimal places. B-V index Distance (ly) 1.1 1380 0.4 556 1.0 771 0.5 304 1.4 532 1.0 751 0.5 267 0.8 229 0.5 552 HelpCopy to ClipboardDownload CSV ........................................................................CONTINUED,.................................................. [Show More]
Last updated: 1 year ago
Preview 1 out of 63 pages
Reviews( 0 )
Document information
Connected school, study & course
About the document
Uploaded On
Feb 26, 2021
Number of pages
63
Written in

Additional information
This document has been written for:
Uploaded
Feb 26, 2021
Downloads
0
Views
121


.png)