Mathematics > Final Exam Review > Week 6 quiz MATH 225N MATH Questions with correct answers (All)
Week 6 quiz MATH 225N MATH Questions with correct answers
Document Content and Description Below
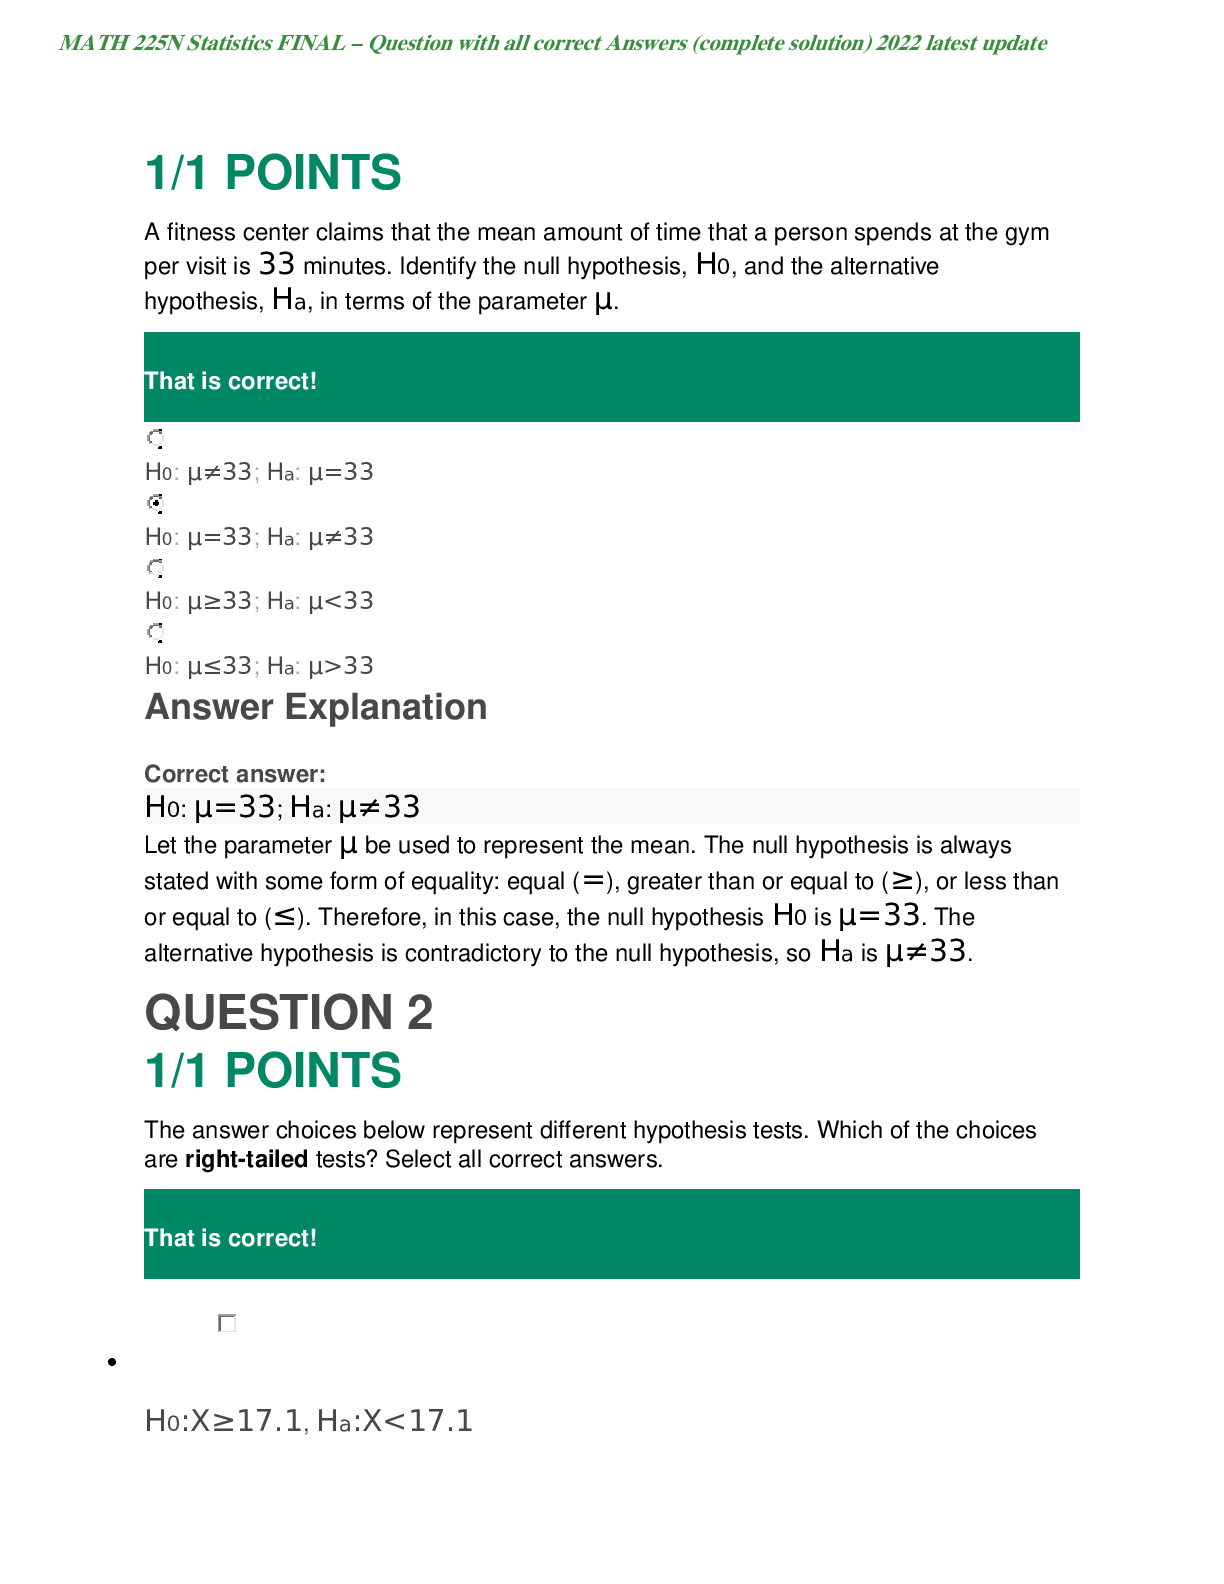
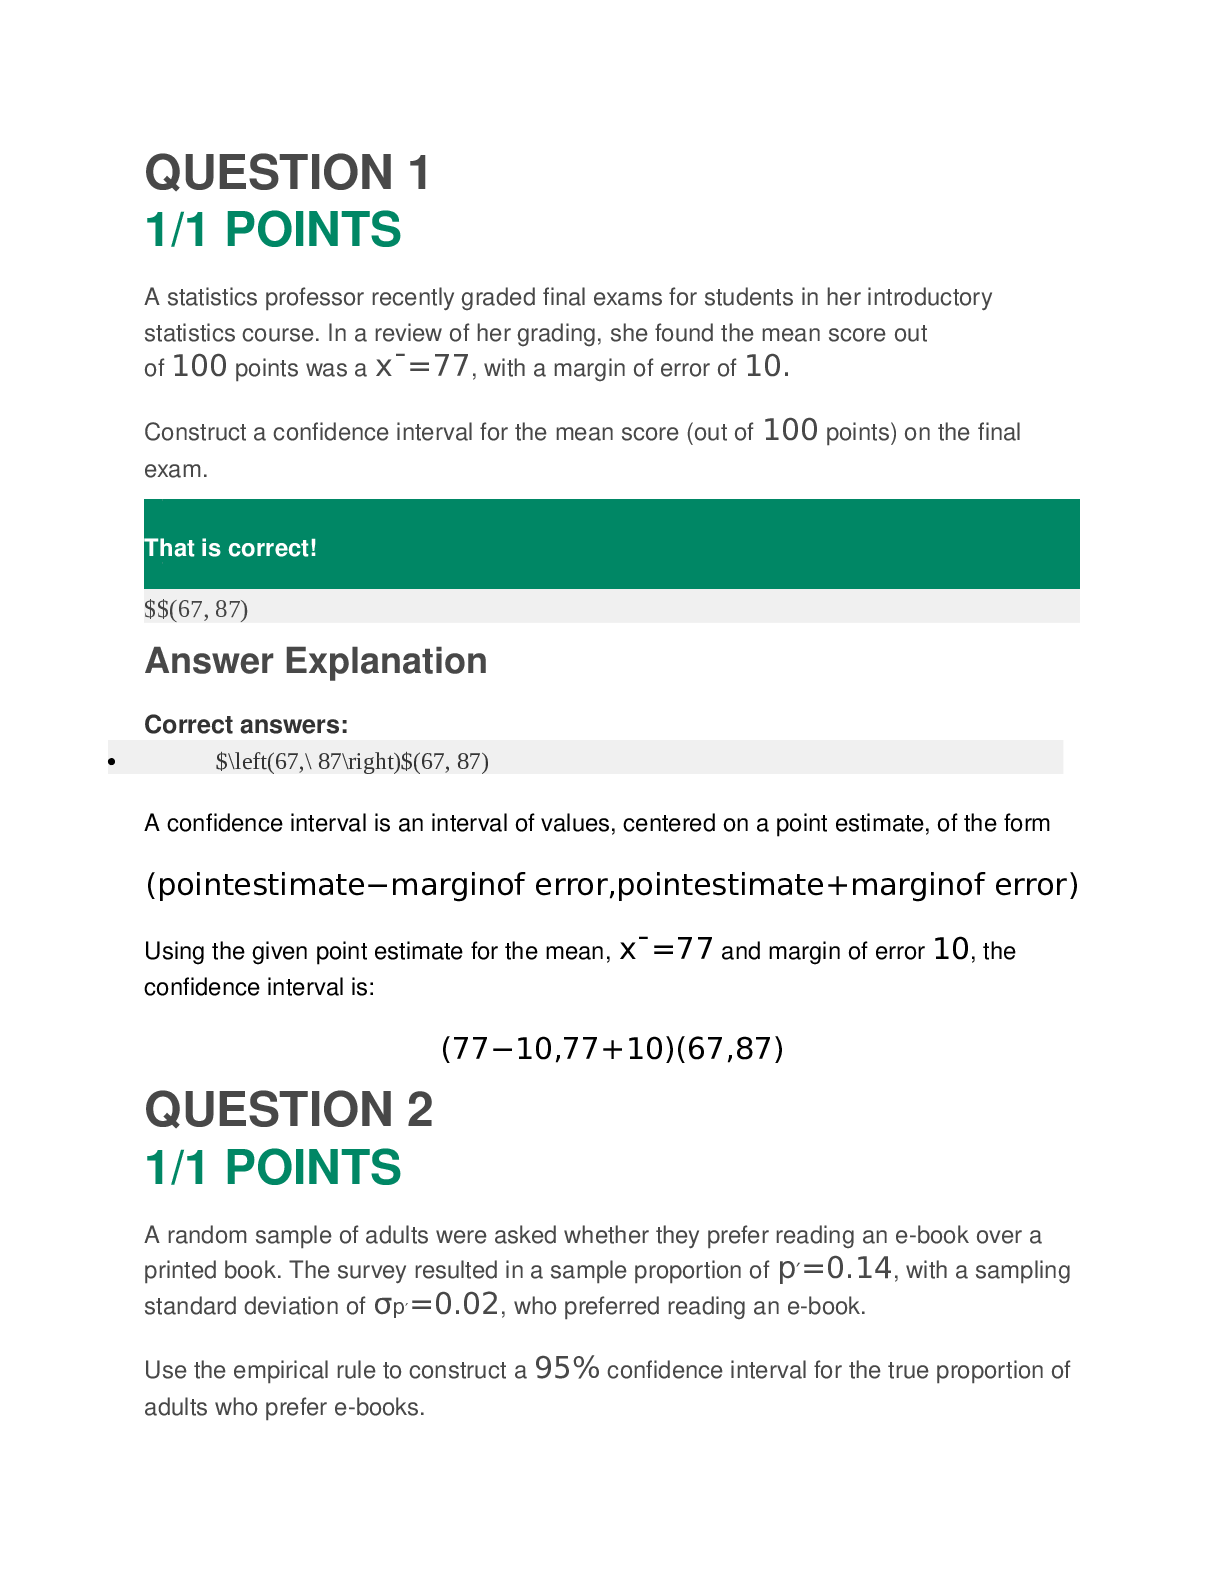
Week 6 quiz QUESTION 1 1/1 POINTS A statistics professor recently graded final exams for students in her introductory statistics course. In a review of her grading, she found the mean score out o... f 100 points was a x¯=77, with a margin of error of 10. Construct a confidence interval for the mean score (out of 100 points) on the final exam. ________________________________________ QUESTION 2 1/1 POINTS A random sample of adults were asked whether they prefer reading an e-book over a printed book. The survey resulted in a sample proportion of p′=0.14, with a sampling standard deviation of σp′=0.02, who preferred reading an e-book. Use the empirical rule to construct a 95% confidence interval for the true proportion of adults who prefer e-books. ________________________________________ QUESTION 3 1/1 POINTS The pages per book in a library are normally distributed with an unknown population mean. A random sample of books is taken and results in a 95% confidence interval of (237,293) pages. What is the correct interpretation of the 95% confidence interval? ________________________________________ QUESTION 4 1/1 POINTS The population standard deviation for the heights of dogs, in inches, in a city is 3.7 inches. If we want to be 95% confident that the sample mean is within 2 inches of the true population mean, what is the minimum sample size that can be taken? z0.101.282z0.051.645z0.0251.960z0.012.326z0.0052.576 Use the table above for the z-score, and be sure to round up to the nearest integer. ________________________________________ That is correct! QUESTION 5 1/1 POINTS Clarence wants to estimate the percentage of students who live more than three miles from the school. He wants to create a 98% confidence interval which has an error bound of at most 4%. How many students should be polled to create the confidence interval? z0.10 z0.05 z0.025 z0.01 z0.005 1.282 1.645 1.960 2.326 2.576 Use the table of values above. ________________________________________ QUESTION 6 0/1 POINTS The average score of a random sample of 87 senior business majors at a university who took a certain standardized test follows a normal distribution with a standard deviation of 28. Use Excel to determine a 90% confidence interval for the mean of the population. Round your answers to two decimal places and use ascending order. Score 516 536 462 461 519 496 517 488 521 HelpCopy to ClipboardDownload CSV QUESTION 7 1/1 POINTS A random sample of 28 statistics tutorials was selected from the past 5 years and the percentage of students absent from each one recorded. The results are given below. Assume the percentages of students' absences are approximately normally distributed. Use Excel to estimate the mean percentage of absences per tutorial over the past 5 years with 90% confidence. Round your answers to two decimal places and use increasing order. Number of Absences 13.9 16.4 12.3 13.2 8.4 4.4 10.3 8.8 4.8 HelpCopy to ClipboardDownload CSV ________________________________________ QUESTION 9 · 1/1 POINTS A sample of 27 employees for the Department of Health and Human Services has the following salaries, in thousands of dollars. Assuming normality, use Excel to find the 98% confidence interval for the true mean salary, in thousands of dollars. Round your answers to two decimal places and use increasing order. Salary 71 70 69 65 72 69 72 72 71 HelpCopy to ClipboardDownload CSV ________________________________________ QUESTION 10 1/1 POINTS The population standard deviation for the heights of dogs, in inches, in a city is 3.7 inches. If we want to be 95% confident that the sample mean is within 1 inch of the true population mean, what is the minimum sample size that can be taken? z0.101.282z0.051.645z0.0251.960z0.012.326z0.0052.576 Use the table above for the z-score, and be sure to round up to the nearest integer. ________________________________________ That is correct! QUESTION 11 1/1 POINTS A random sample of house sizes in major city has a sample mean of x¯=1204.9 sq ft and sample standard deviation of s=124.6 sq ft. Use the Empirical Rule to determine the approximate percentage of house sizes that lie between 955.7 and 1454.1 sq ft. Round your answer to the nearest whole number (percent). ________________________________________ That is correct! QUESTION 14 1/1 POINTS A baker knows that the daily demand for strawberry pies is a random variable that follows the normal distribution with a mean of 31.8 pies and a standard deviation of 4.5 pies. Find the demand that has an 8% probability of being exceeded. • Use Excel, and round your answer to two decimal places. ________________________________________ That is correct! QUESTION 15 1/1 POINTS A group of friends has gotten very competitive with their board game nights. They have found that overall, they each have won an average of 18 games, with a population standard deviation of 6 games. If a sample of only 2 friends is selected at random from the group, select the expected mean and the standard deviation of the sampling distribution from the options below. Remember to round to the nearest whole number. ________________________________________ QUESTION 16 0/1 POINTS An elementary school has a population of 635 students, 600 of whom have received the chicken pox vaccine. The school nurse wants to make sure that the school meets all state requirements for vaccinations at public schools. Find the population proportion, as well as the mean and standard deviation of the sampling distribution for samples of size n=120. Round all answers to 3 decimal places. ________________________________________ QUESTION 17 1/1 POINTS The lengths of text messages are normally distributed with an unknown population mean. A random sample of text messages is taken and results in a 95% confidence interval of (23,47) characters. What is the correct interpretation of the 95% confidence interval? ________________________________________ QUESTION 20 1/1 POINTS From a recent company survey, it is known that the proportion of employees older than 55 and considering retirement is 8%. For a random sample of size 110, what is standard deviation for the sampling distribution of the sample proportions, rounded to three decimal places? ________________________________________ QUESTION 21 0/1 POINTS In order to estimate the average electricity usage per month, a sample of 125 residential customers were selected, and the monthly electricity usage was determined using the customers' meter readings. Assume a population variance of 12,100kWh2. Use Excel to find the 98% confidence interval for the mean electricity usage in kilowatt hours. Round your answers to two decimal places and use ascending order. Electric Usage 765 1139 714 687 1027 1109 749 799 911 HelpCopy to ClipboardDownload CSV ………………………………CONTINUED…………………………………. [Show More]
Last updated: 1 year ago
Preview 1 out of 20 pages
Instant download
Buy this document to get the full access instantly
Instant Download Access after purchase
Add to cartInstant download
Reviews( 0 )
Document information
Connected school, study & course
About the document
Uploaded On
Feb 26, 2021
Number of pages
20
Written in

Additional information
This document has been written for:
Uploaded
Feb 26, 2021
Downloads
0
Views
99