Mathematics > EXAM > MATH 225N Week 4 Statistics Quiz (Version 1) Latest 2019/20 Complete Solutions , Chamberlain. (All)
MATH 225N Week 4 Statistics Quiz (Version 1) Latest 2019/20 Complete Solutions , Chamberlain.
Document Content and Description Below
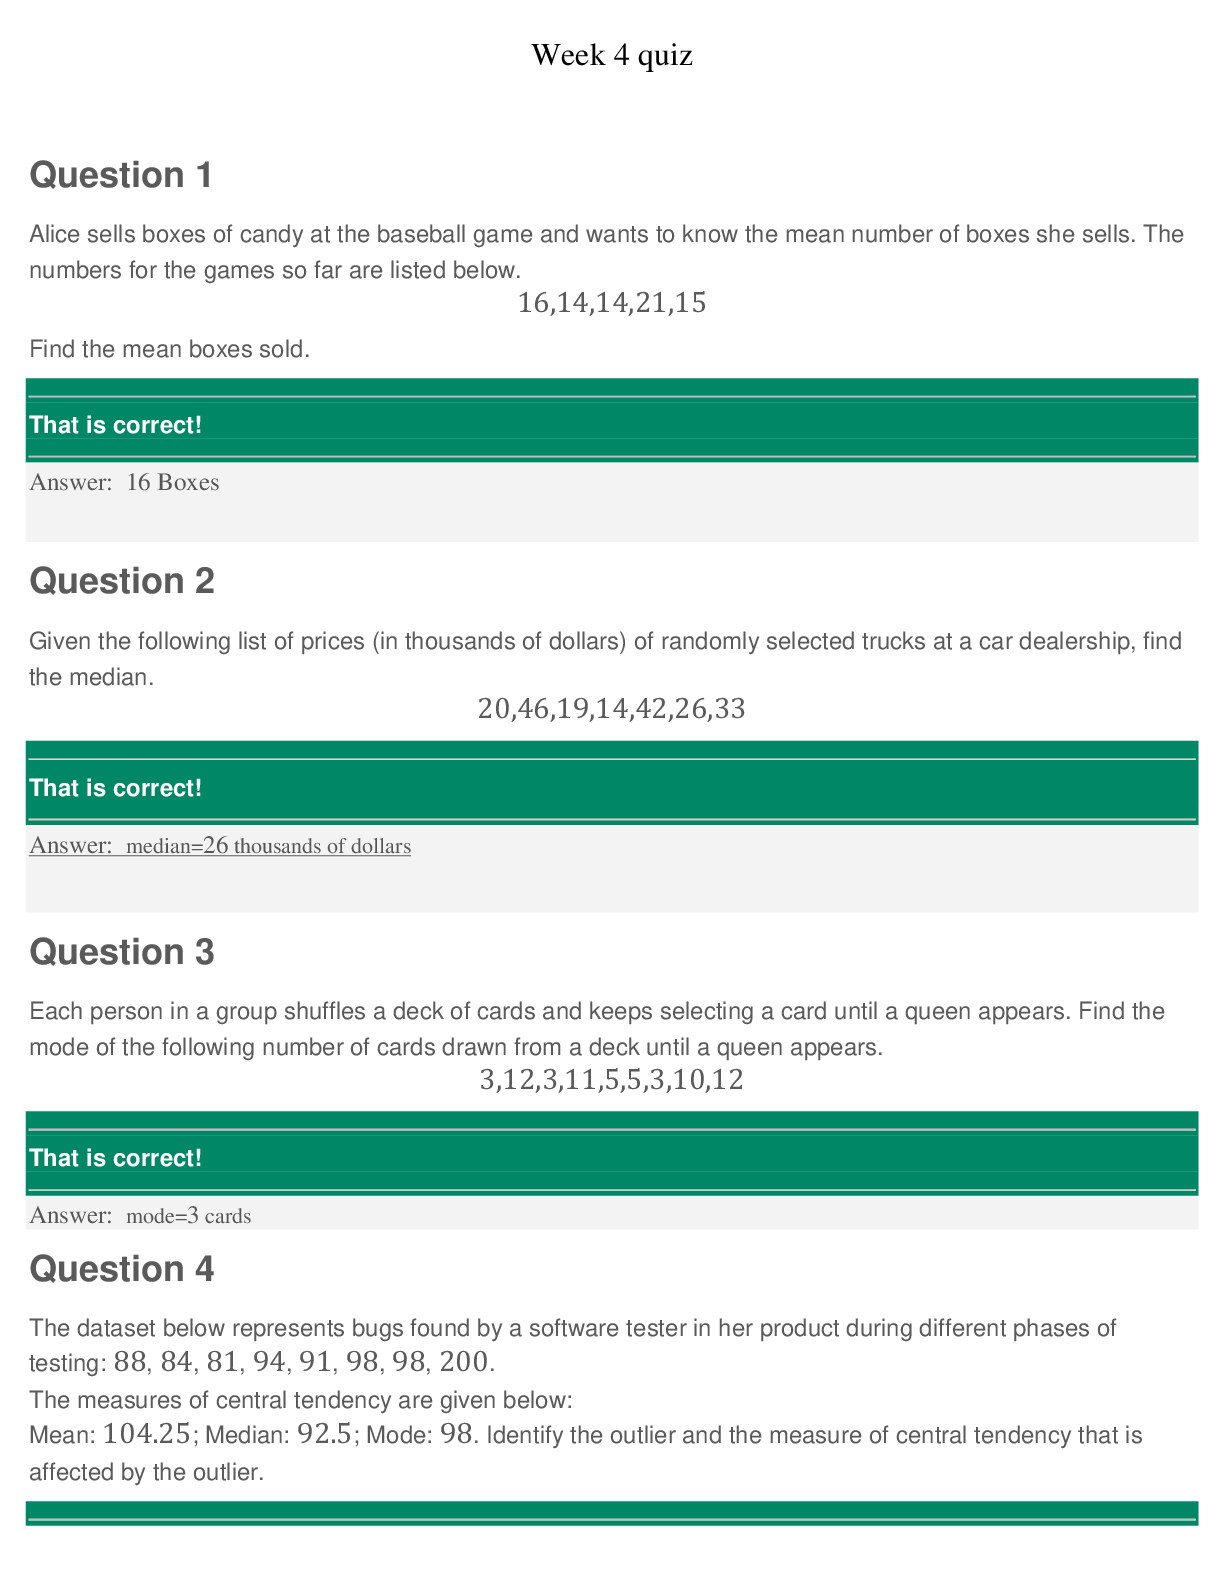
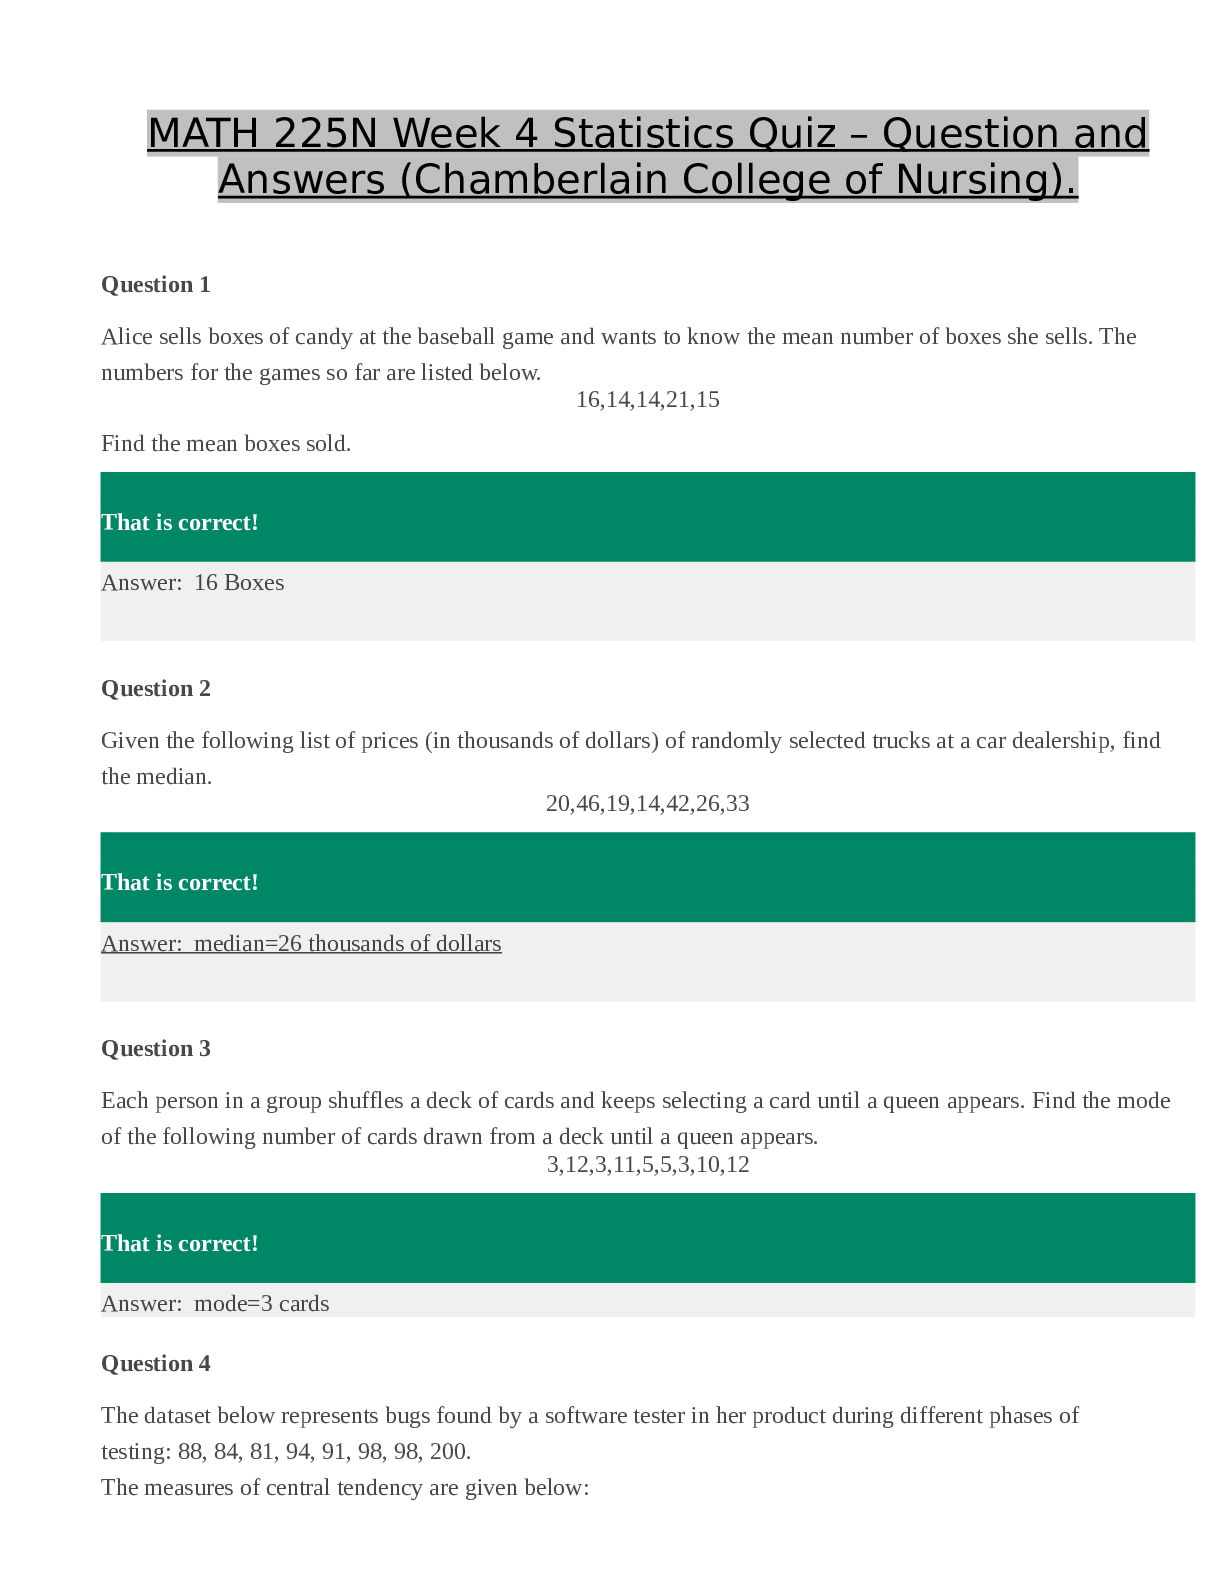
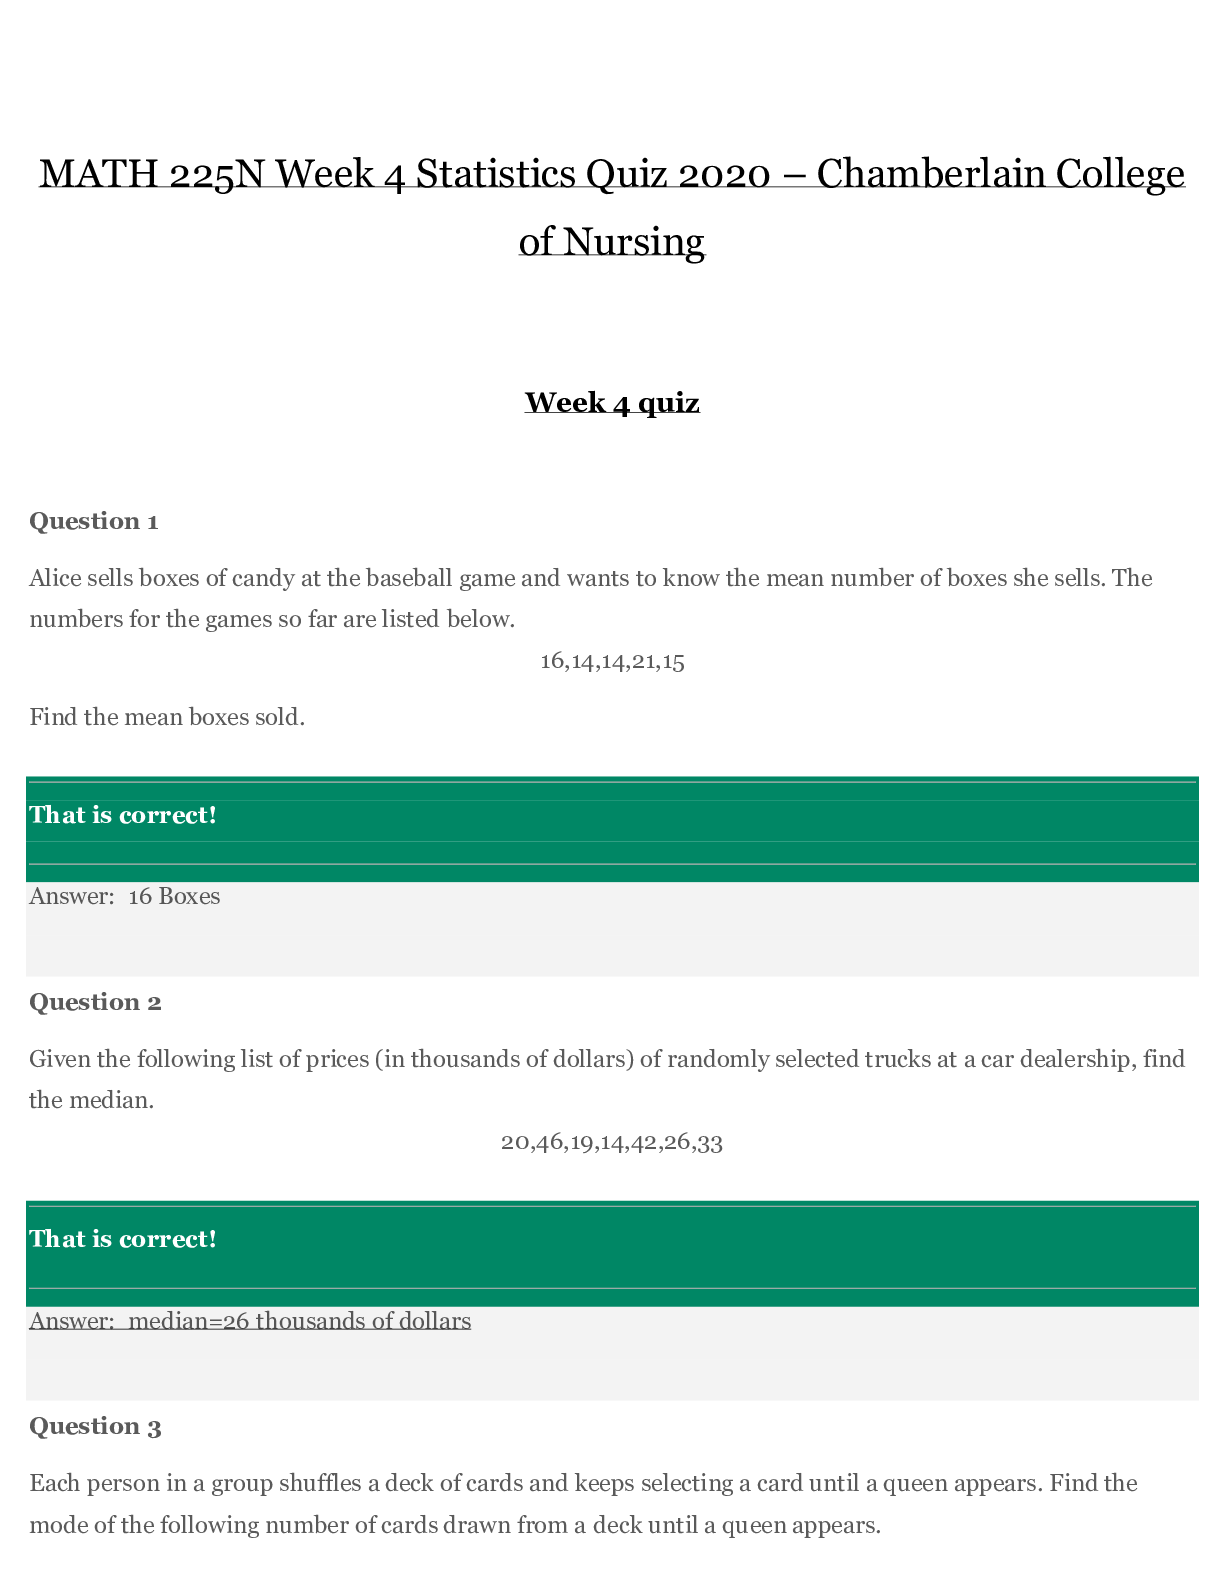
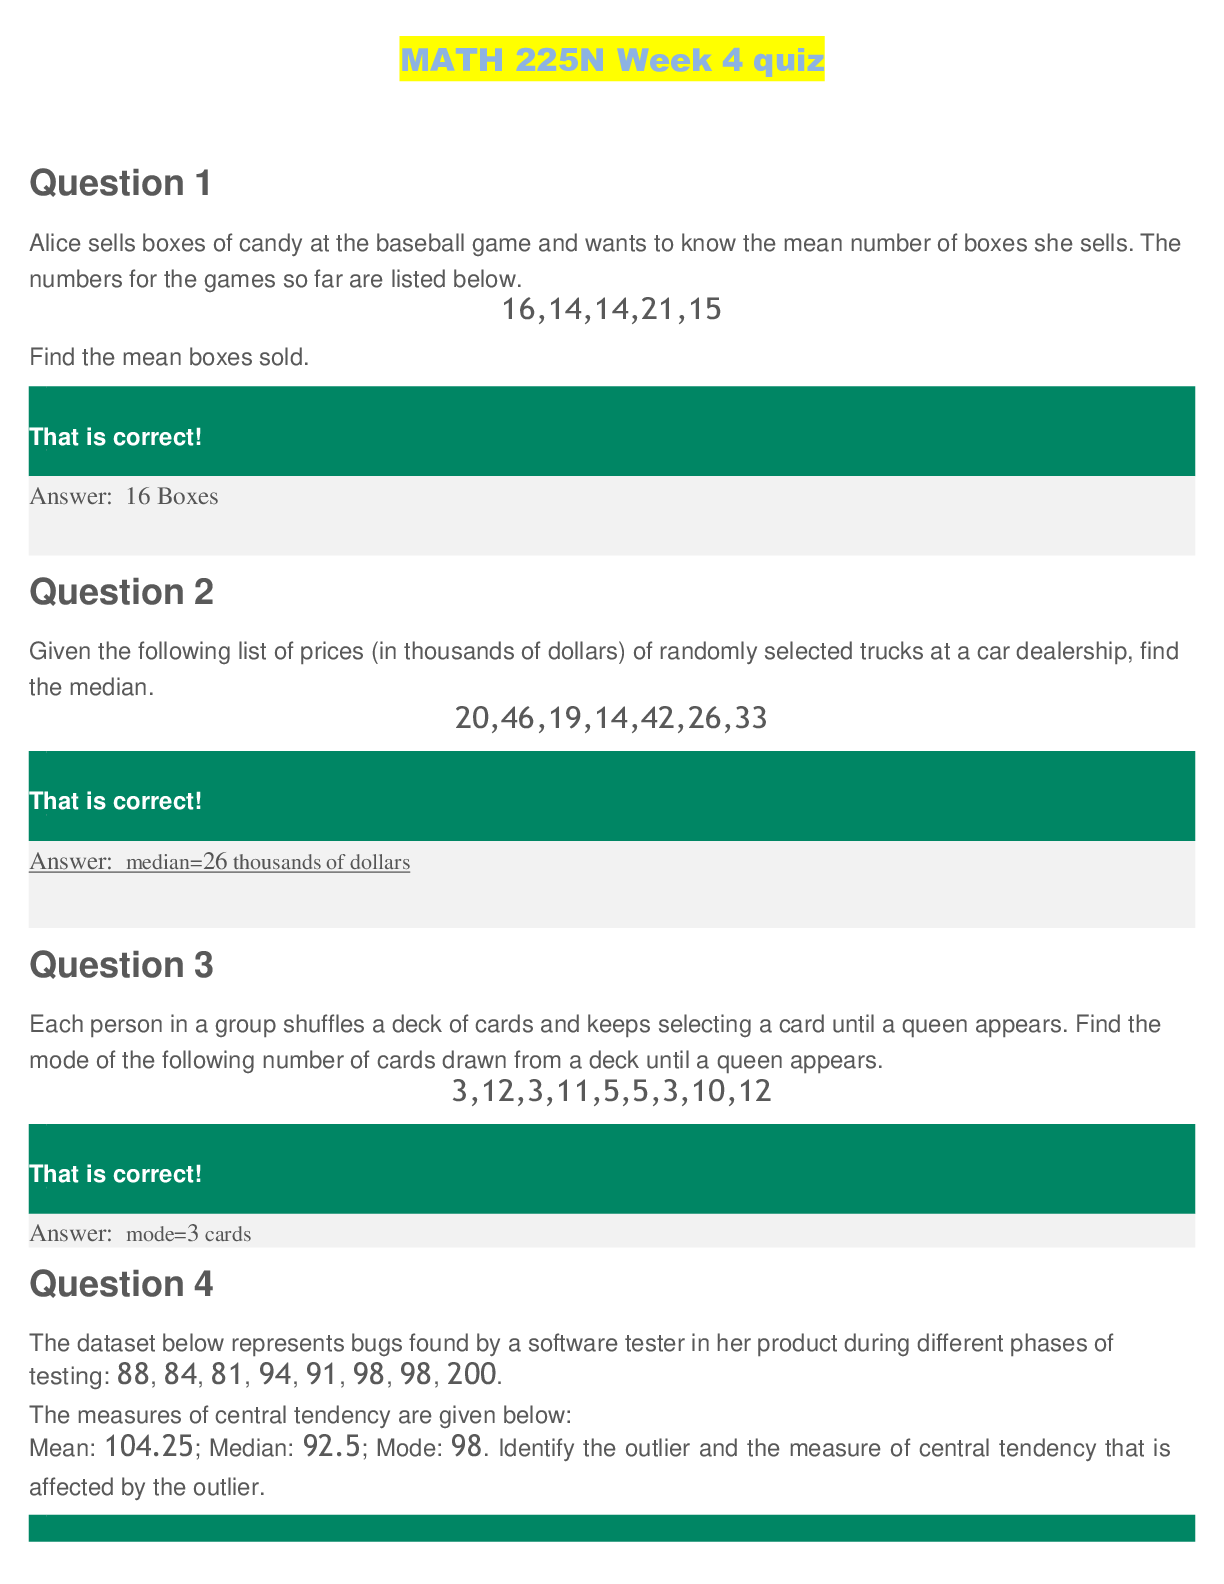
MATH 225N Week 4 Statistics Quiz (Version 1) 1. Question: Alice sells boxes of candy at the baseball game and wants to know the mean number of boxes she sells. The numbers for the games so far are �... �…. 16,14,14,21,15 2. Question: Given the following list of prices (in thousands of dollars) of randomly selected trucks at a car dealership, find the median…… 20,46,19,14,42,26,33 3. Question: Each person in a group shuffles a deck of cards and keeps selecting a card until a queen appears. Find the mode of the following number of cards drawn from a deck until a queen appears……. 3,12,3,11,5,5,3,10,12 4. Question: The dataset below represents bugs found by a software tester in her product during different phases of testing:….. 88, 84, 81, 94, 91, 98, 98, 200. The measures of central tendency are … below: Mean: 25; Median: 92.5; Mode: 98. Identify the outlier and the measure of central tendency that is … by the outlier. 5. Question: Given the following histogram, decide if the data is … or symmetrical……. A bar graph has a horizontal axis titled Values labeled from 2 to 18 in increments of 2 and a vertical axis titled Frequency labeled from 0 to 200 in increments of 50. 14 bars are plotted, above the numbers 2 to 16. From left to right, the heights of the bars are as follows: 1. 5. 10. 40, 75, 125, 190, 180, 130, 125, 60, 25,20, 10. All values are approximate. 6. Question: The following data set represents the ages of all seven grandchildren in a family……. 4, 5, 11, 12, 11, 8, 5 If the variance of the ages is 7, what is the standard deviation? Round the final answer to one decimal place. 7. Question: Which of the data sets represented by the following box and whisker plots has the smallest standard deviation?……. Four horizontal box-and-whisker plots share a vertical axis with the classes D, C, B, and A and a horizontal axis from 0 to 120 in increments of 20. The box-and-whisker plot above the class label A has the following five-number summary: 44, 69, 77, 82, and 112. The box-and-whisker plot above the class label B has the following five-number summary: 19, 64, 78, 87, and 121. The box-and-whisker plot above the class label C has the following five-number summary: 60, 72, 75, 80, and 92. The box-and-whisker plot above the class label D has the following five-number summary: 2, 63, 77, 92, and 138. All values are approximate. 8. Question: The box-and-whisker plot shows the number of books read by history students during the last school year…… A box and whisker plot with minimum 4, first quartile 6, median 8, third quartile 10, and maximum 15…… What is the range of the data? 9. Question: A random sample of house sizes in major city has a sample mean of x¯=1204.9sq ft and sample standard deviation of s=124.6 sq ft. Use the Empirical Rule to determine the approximate percentage of house sizes that lie between 7and 1454.1 sq ft……. Round your answer to the nearest whole number (percent). 10. Question: Is the statement below true or false?….. Independent is the property of two events in which the knowledge that one of the events occurred does not affect the chance the other occurs. 11. Question: Brayden tosses a coin 500 Of those 500times, he observes heads a total of 416 times. Calculations show that the probability of this occurring by chance is less than 0.01, assuming the coin is fair. Determine the meaning of the significance level. 12. Question: A spinner contains the numbers 1through 80. What is the probability that the spinner will land on a number that is not a multiple of 11?….. Give your answer in fraction form. 13. Question: Of the following pairs of events, which pair has mutually exclusive events? 14. Question: Fill in the following contingency table and find the number of students who both go to the beach AND go to the mountains. 15. Question: A group of 140students at an elementary school were asked if they prefer the color orange to the color green. The results are shown in the table below. Given that a randomly selected survey participant is a male, what is the probability that this student prefers the color green?…… Enter your answer as a fraction. 16. Question: Researchers want to study whether or not a fear of flying is related to a fear of heights. They surveyed a large group of people and asked them whether or not they had a fear of flying and whether or not they had a fear of heights. The data are … in the contingency table below. What is the relative risk of being afraid of heights for those who are afraid of flying? Round your answer to two decimal places. 17. Question: Which of the following frequency tables show a skewed data set? Select all answers that apply. 18. Question: A student wants to know his average homework grade for the first half of his math class. There were 7homeworks in the first half of the class, and his grades out of 100are given by….. 100,90,95,89,92,85,95…… What is the population mean of his homework grades? Round your answer to the nearest tenth. 19. Question: The following data set represents the ages of all six grandchildren in a family….. Find the variance for this data set of ages:….. 6, 3, 14, 11, 14, 6….. Round the final answer to one decimal place. 20. Question: A poll was conducted during the final game of the basketball season to determine whether fans wanted to see the defending champions win the game or the challenging team win the game. From the poll, 216of the 374residents sampled from urban areas want the defending champions to win the game. In more rural areas, 304 of the 466 residents polled want the defending champions to win the game. Assuming location has nothing to do with team preference, the probability that the data gathered was the result of chance is calculated to be 03. What is the correct interpretation of this calculation? 21. Question: Find the mode of the following amounts (in thousands of dollars) in savings accounts of randomly selected people aged 25-30…… 8,6,8,7,2,2,2,4,4,4,4,7 22. Question: A deck of cards contains red cards numbered 1,2,3,4,5, blue cards numbered 1,2,3,4,5,6,7,8and green cards numbered 1,2,3,4,5,6,7,8,9,10. If a single card is picked at random, what is the probability that the card is green?…… Give your answer as a fraction. 23. Question: The five-number summary for a set of data is given below Min Q1 Median Q3 Max 60 65 70 75 87 What is the interquartile range of the set of data? 24. Question: The five-number summary for a set of data is … below Min Q1 Median Q3 Max 43 47 53 62 72 What is the interquartile range of the set of data? 25. Question: The following frequency table summarizes a set of data. What is the five-number summary? Value Frequency 3 3 5 2 10 1 13 1 14 3 15 3 16 1 20 1 Further Additional Questions & Answers (from Different Quiz/Test Attempts) 1. Question: A deck of cards contains red cards numbered 1,2,3,4,5,6,7,8,9, blue cards numbered 1,2,3,4and green cards numbered 1,2,3,4,5,6,7,8,9,10. If a single card is picked at random, what is the probability that the card is green? 2. Question: The five-number summary for a set of data is given below. Min Q1 Median Q3 Max 49 55 59 67 72 What is the interquartile range of the set of data? 3. Question: The five-number summary for a set of data is given below. Min Q1 Median Q3 Max 43 51 53 58 94 What is the interquartile range of the set of data? 4. Question: The following frequency table summarizes a set of data. What is the five-number summary? 5. Question: Find the mode of the following amounts (in thousands of dollars) in savings accounts of randomly selected people aged 25-30. 8,6,8,7,2,2,2,4,4,4,4,7 6. Question: A deck of cards contains red cards numbered 1,2,3, blue cards numbered 1,2,3,4and green cards numbered 1,2,3,4,5,6,7,8,9,10,11,12,13,14,15,16. If a single card is picked at random, what is the probability that the card is blue? Give your answer as a fraction. 7. Question: The five-number summary for a set of data is given below. Min Q1 Median Q3 Max 57 61 67 71 98 What is the interquartile range of the set of data? 8. Question: The five-number summary for a set of data is given below. Min Q1 Median Q3 Max 60 67 70 78 93 What is the interquartile range of the set of data? 9. Question: The following frequency table summarizes a set of data. What is the five-number summary? Value Frequency 1 6 2 2 5 1 6 1 9 1 11 1 13 1 14 6 15 3 16 1 19 1 23 1 24 1 28 1 [Show More]
Last updated: 1 year ago
Preview 1 out of 19 pages

Reviews( 0 )
Document information
Connected school, study & course
About the document
Uploaded On
Apr 27, 2020
Number of pages
19
Written in

Additional information
This document has been written for:
Uploaded
Apr 27, 2020
Downloads
0
Views
41