Economics > QUESTIONS & ANSWERS > Saydel High School - ECON 101Apply Concepts of Taxes and Income Distribution (All)
Saydel High School - ECON 101Apply Concepts of Taxes and Income Distribution
Document Content and Description Below
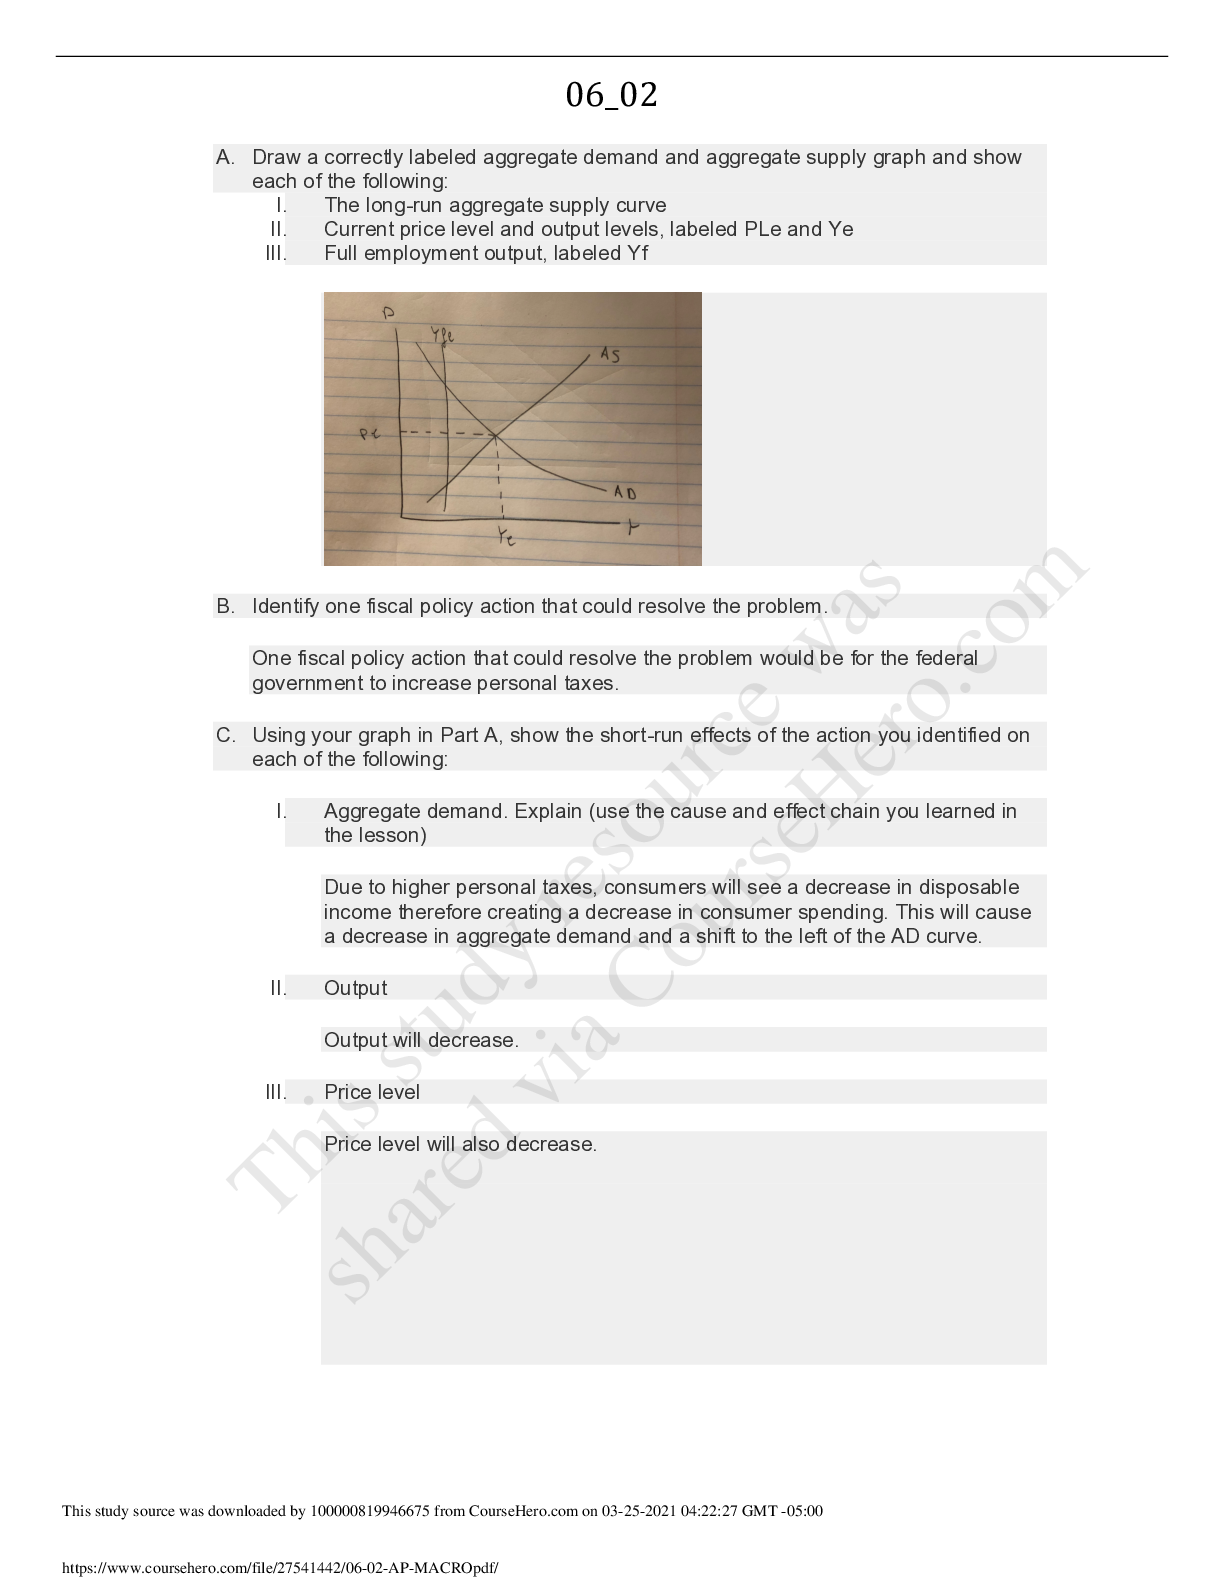
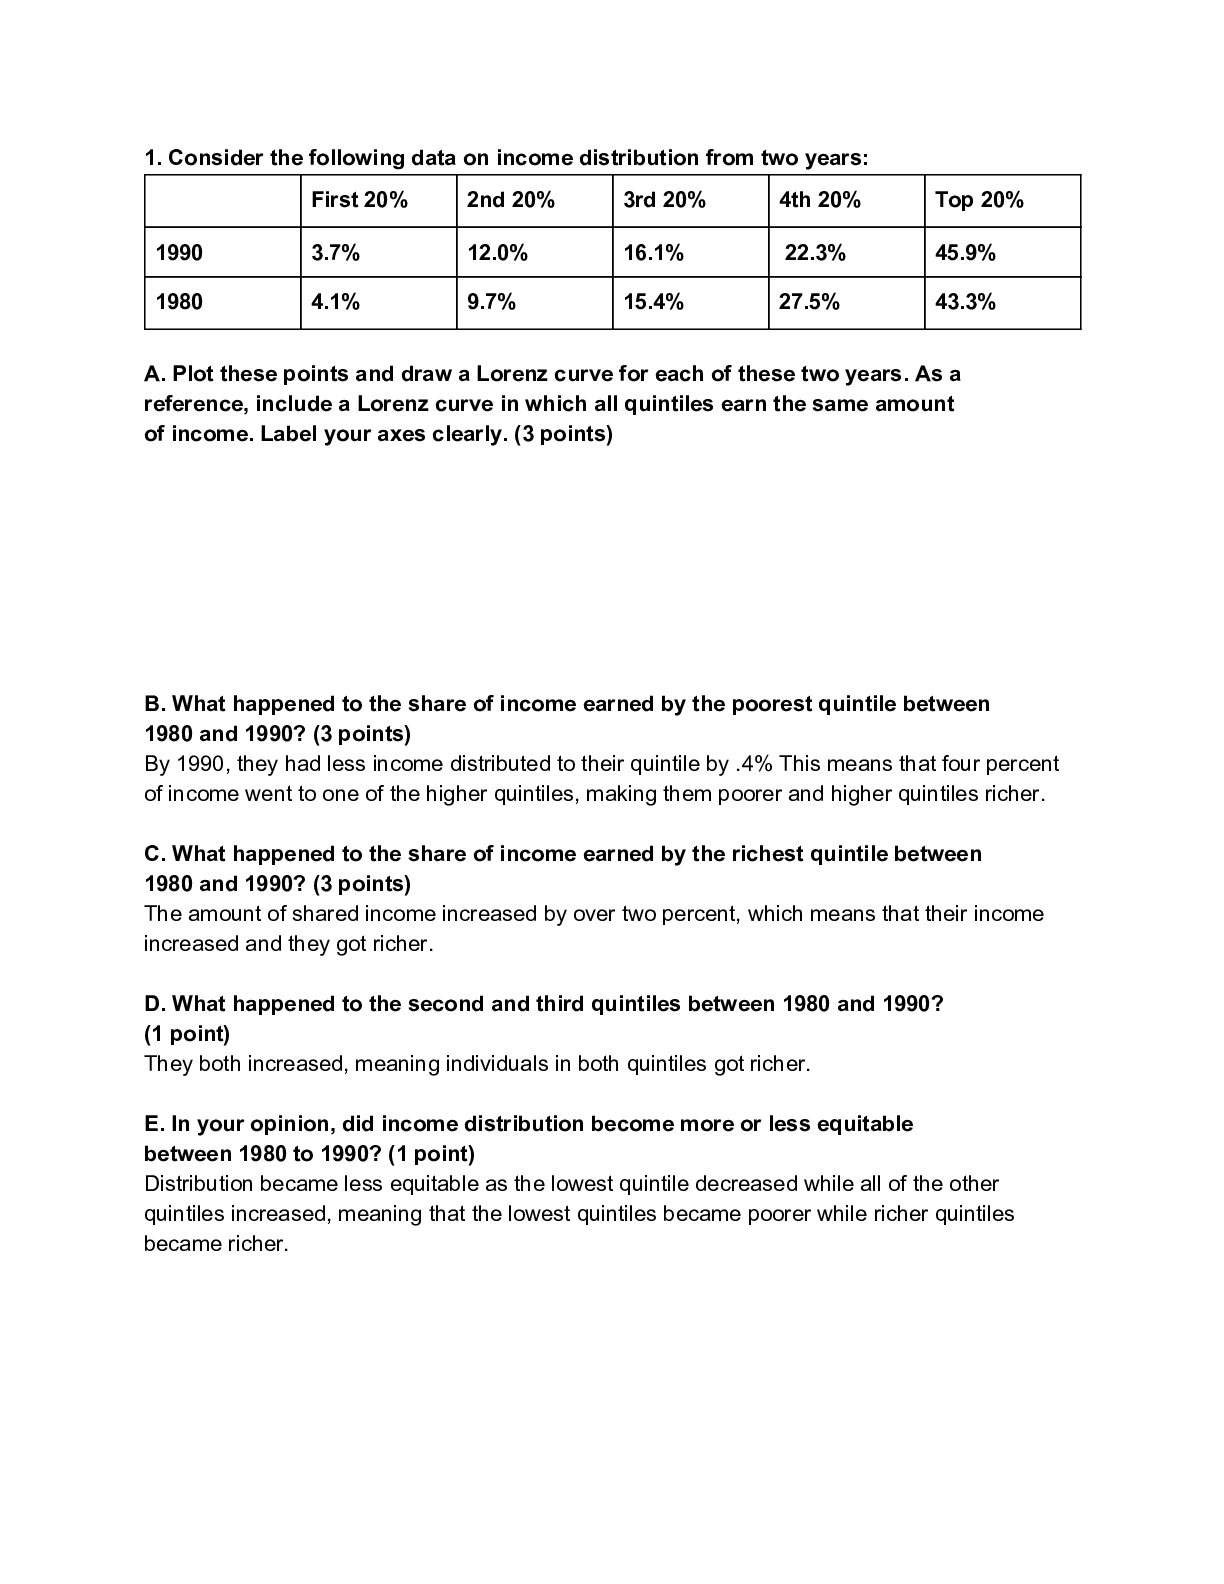
1. Consider the following data on income distribution from two years: First 20% 2nd 20% 3rd 20% 4th 20% Top 20% 1990 3.7% 12.0% 16.1% 22.3% 45.9% 1980 4.1% 9.7% 15.4% 27.5% 43.3% A. Plot these poi... nts and draw a Lorenz curve for each of these two years. As a reference, include a Lorenz curve in which all quintiles earn the same amount of income. Label your axes clearly. (3 points) B. What happened to the share of income earned by the poorest quintile between 1980 and 1990? (3 points) By 1990, they had less income distributed to their quintile by .4% This means that four percent of income went to one of the higher quintiles, making them poorer and higher quintiles richer [Show More]
Last updated: 1 year ago
Preview 1 out of 4 pages
Buy this document to get the full access instantly
Instant Download Access after purchase
Add to cartInstant download
We Accept:

Reviews( 0 )
$5.00
Document information
Connected school, study & course
About the document
Uploaded On
Mar 29, 2021
Number of pages
4
Written in

Additional information
This document has been written for:
Uploaded
Mar 29, 2021
Downloads
0
Views
22