Geography > Lab Report > College of Staten Island, CUNY - GEOGRAPHY MISCLab 8 Earthquakes DONE (All)
College of Staten Island, CUNY - GEOGRAPHY MISCLab 8 Earthquakes DONE
Document Content and Description Below
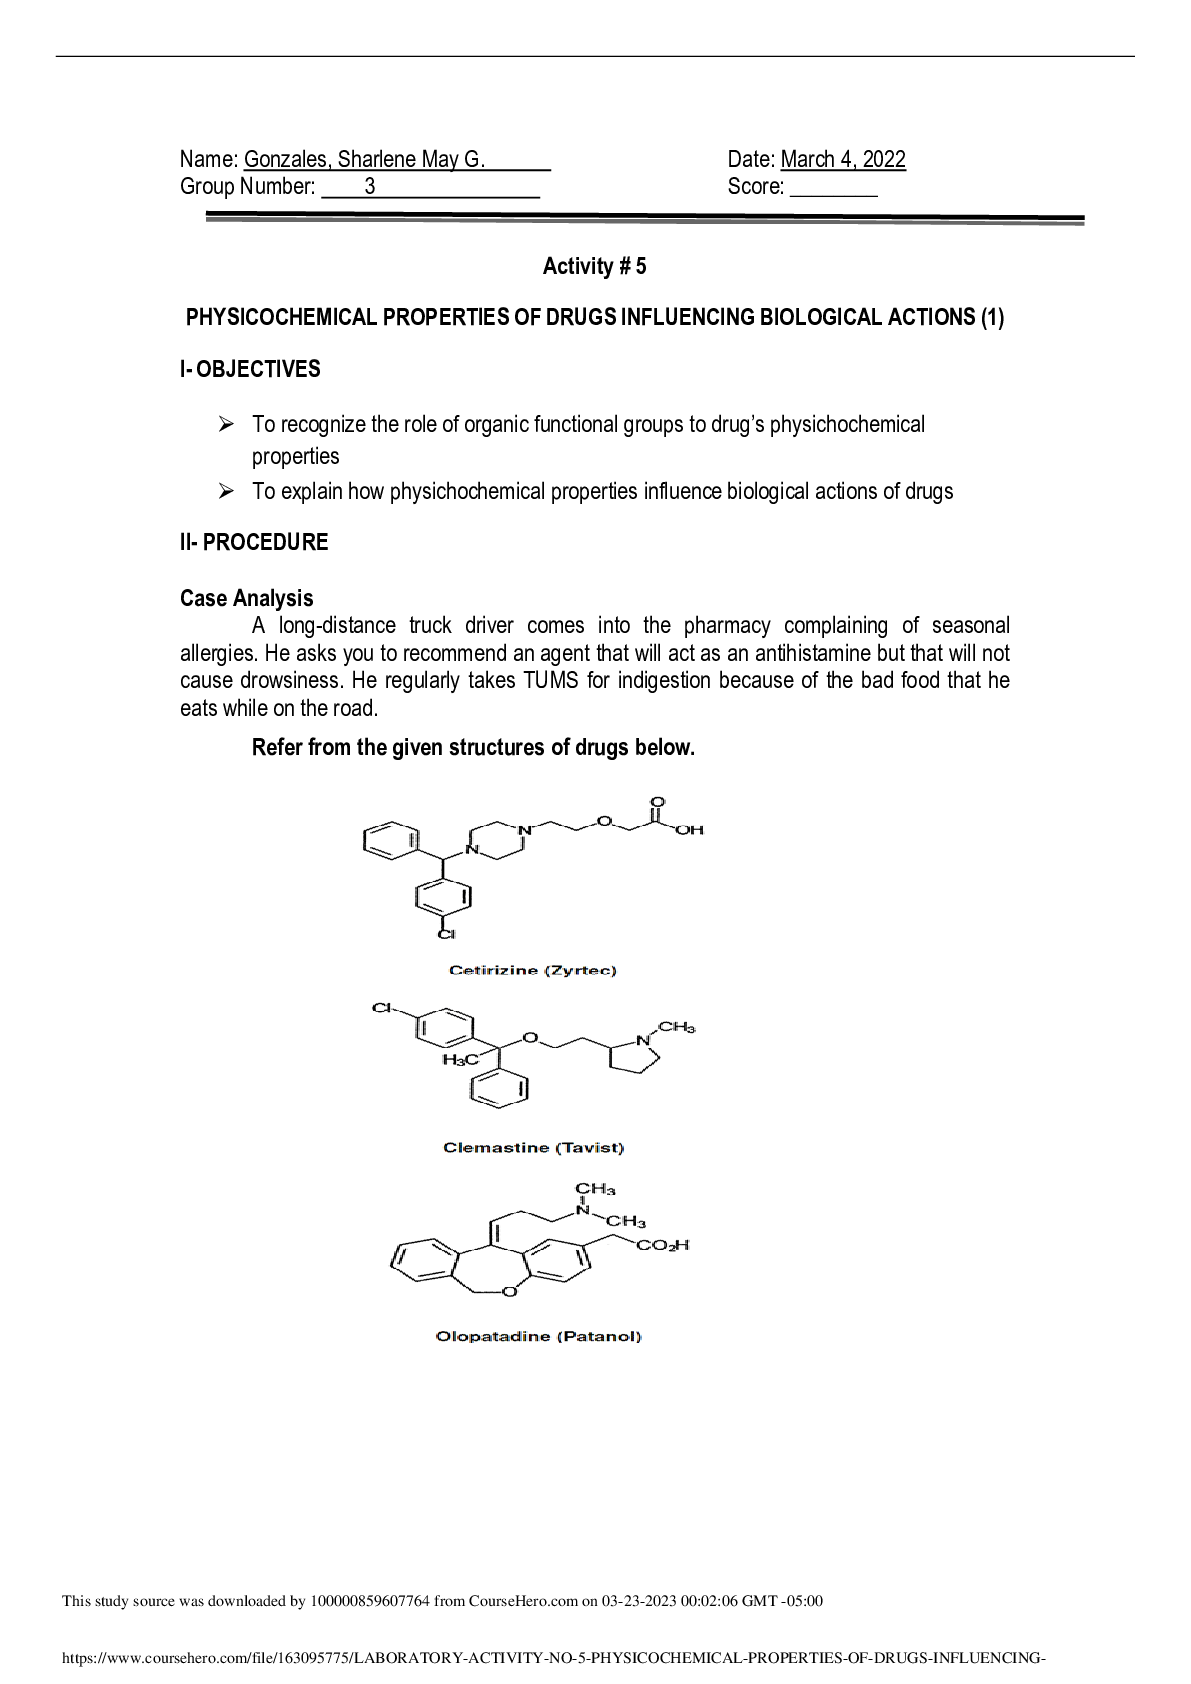
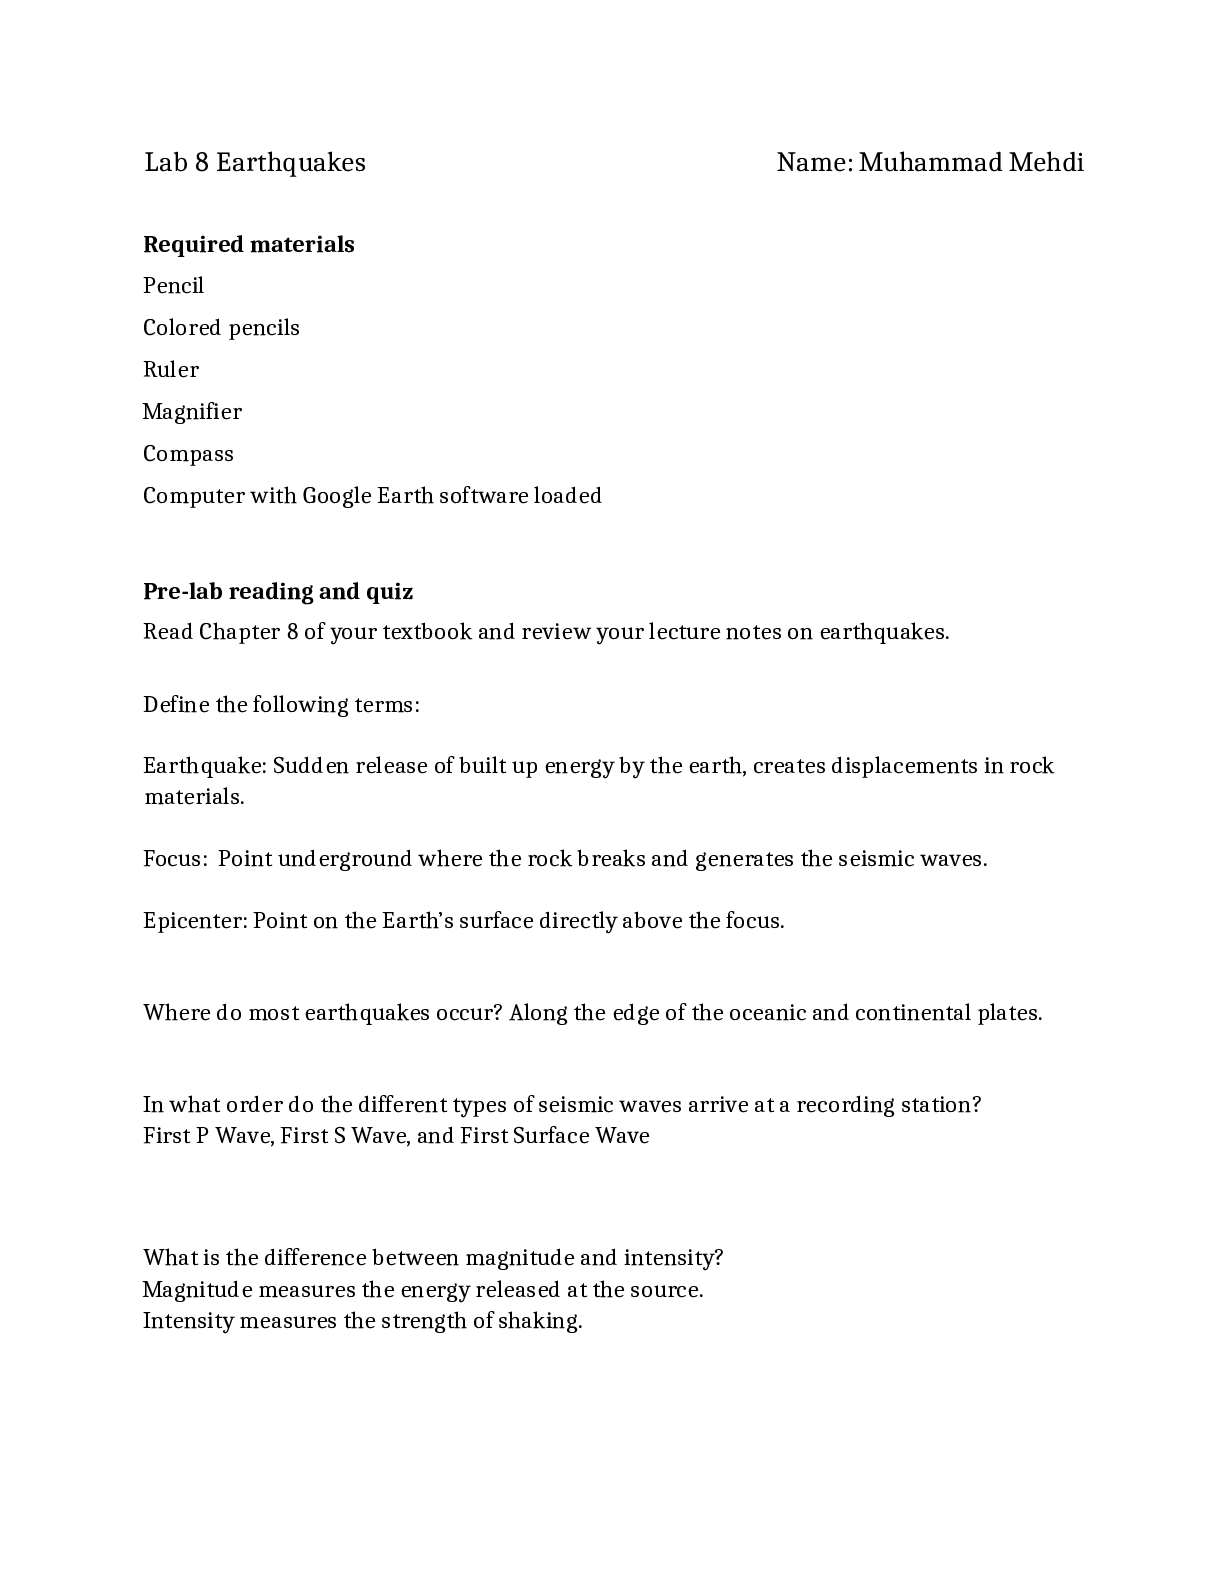
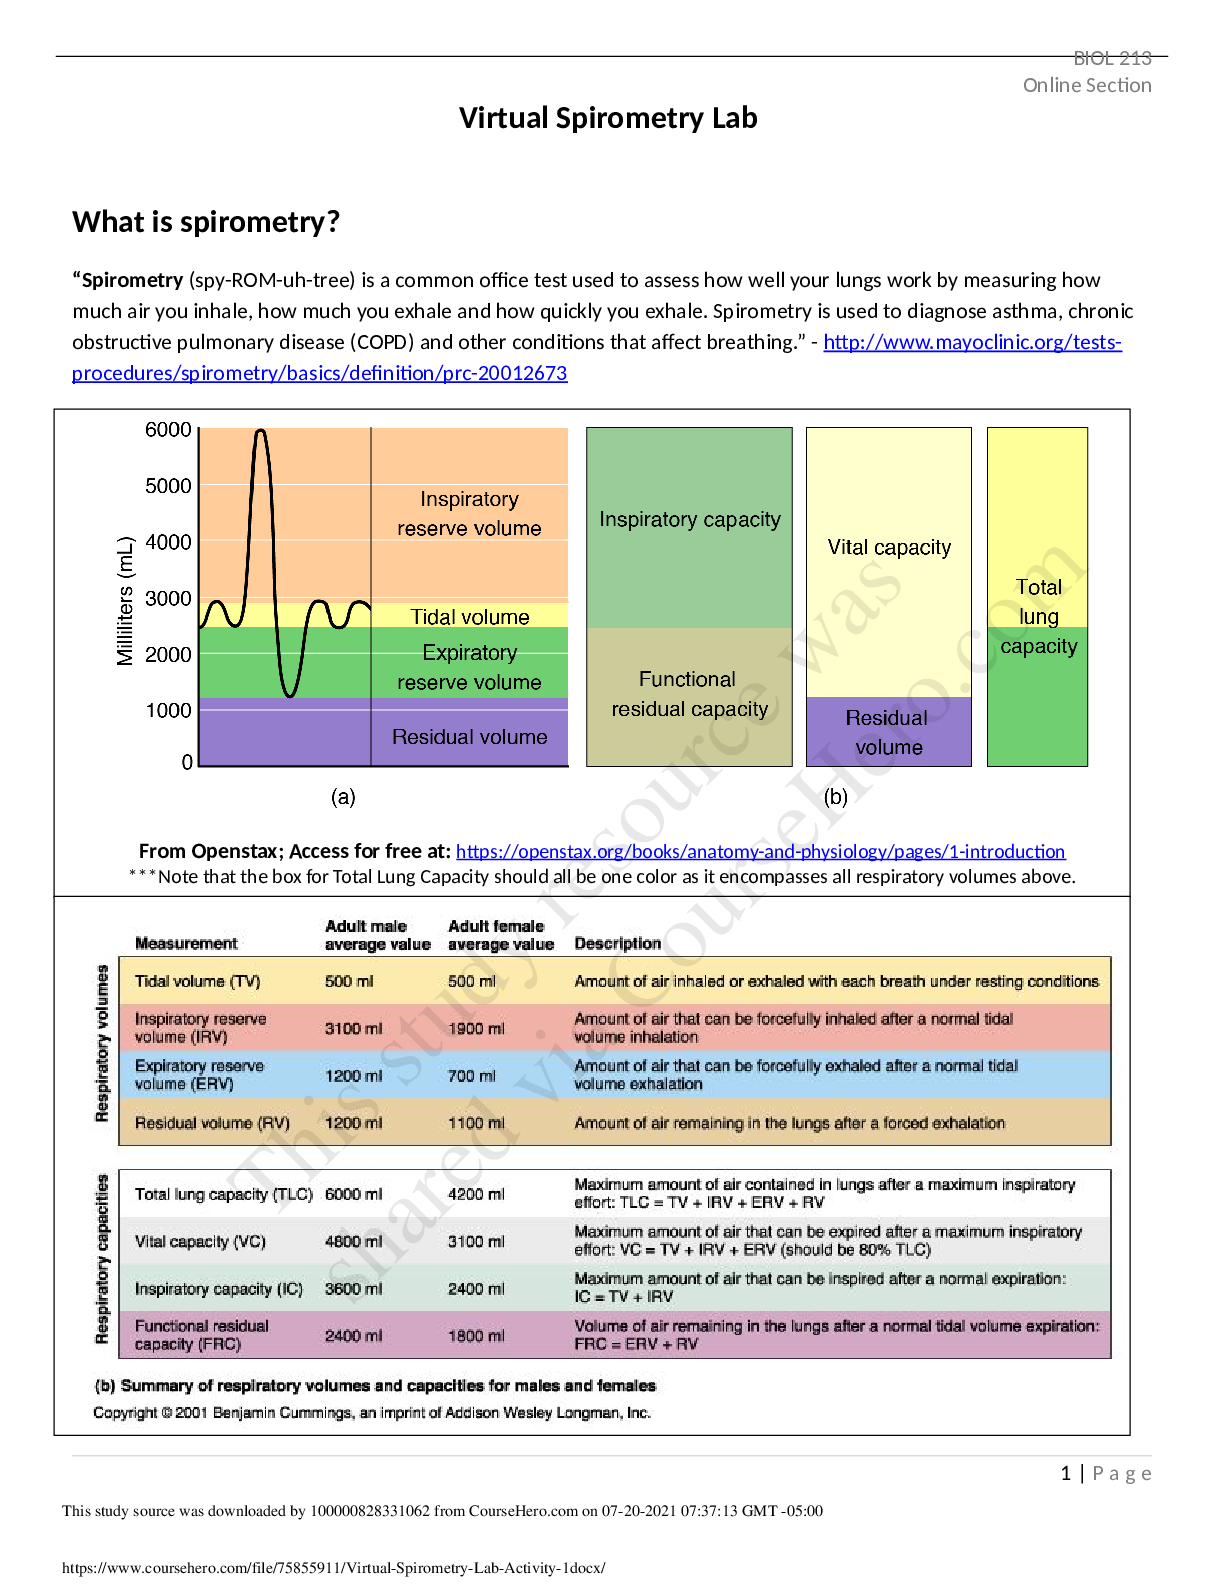
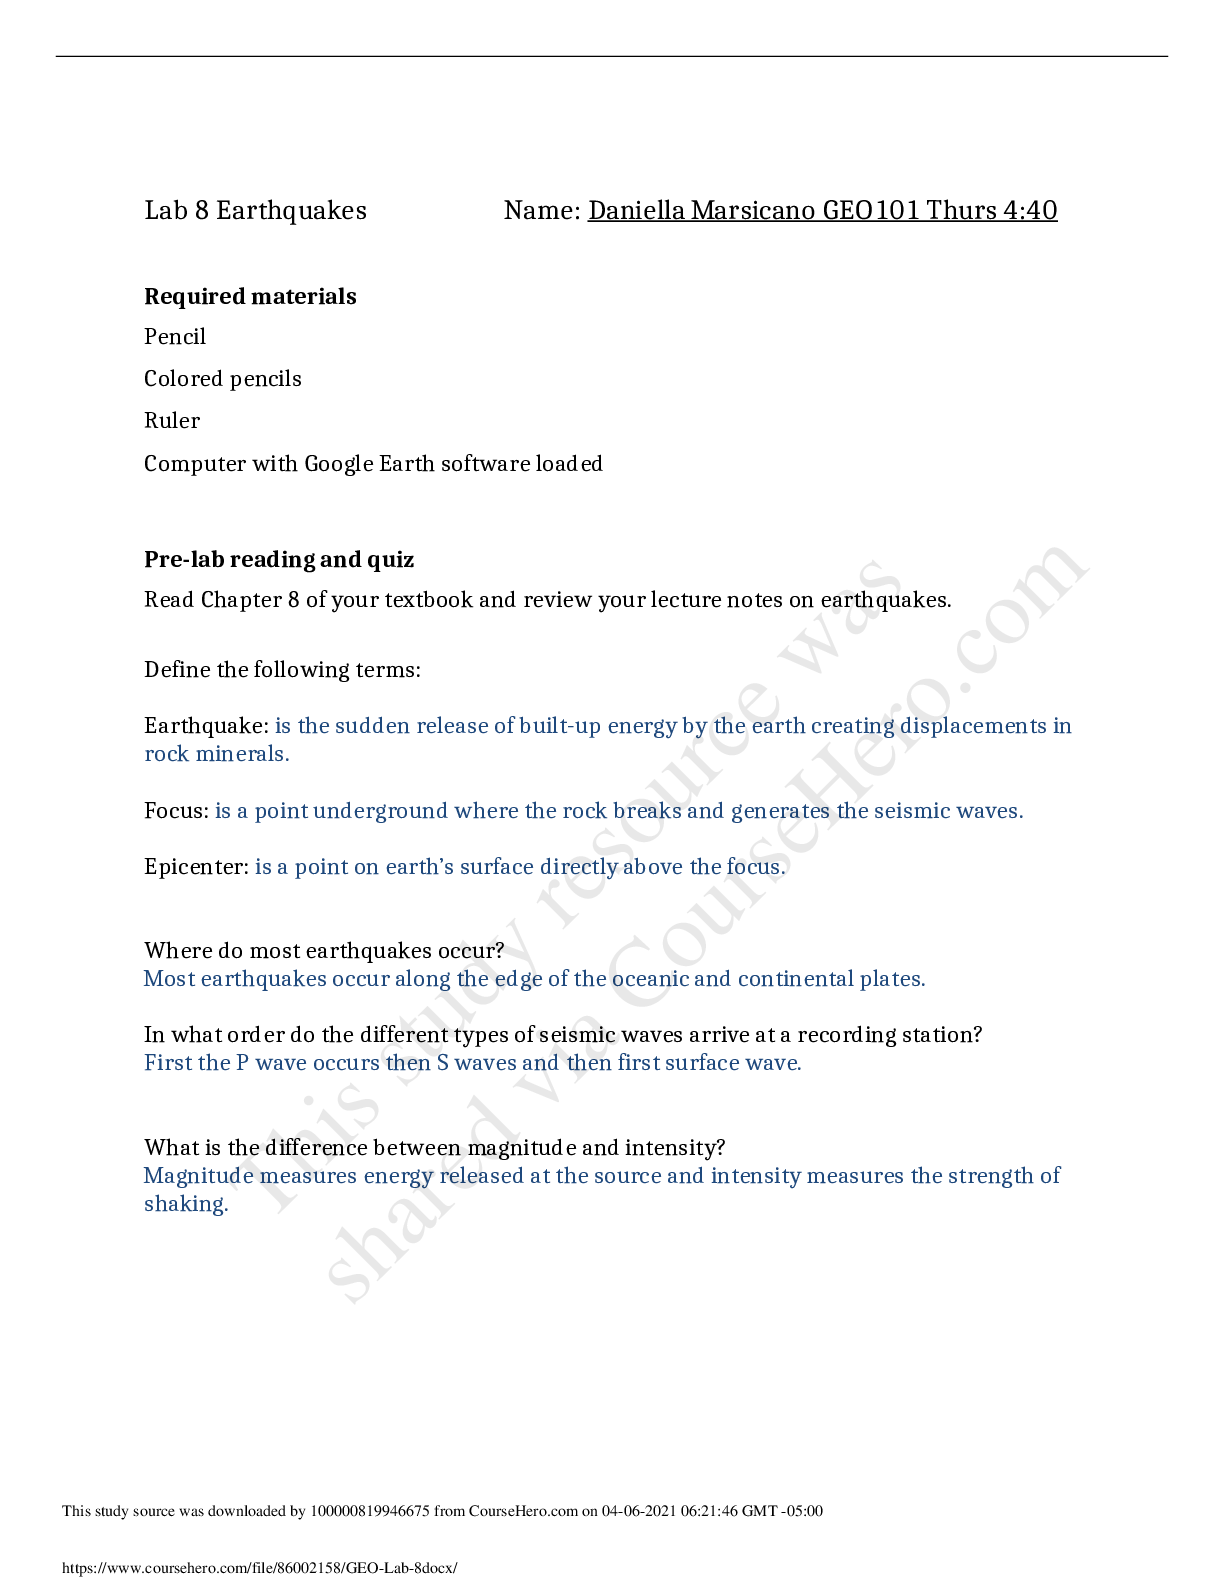
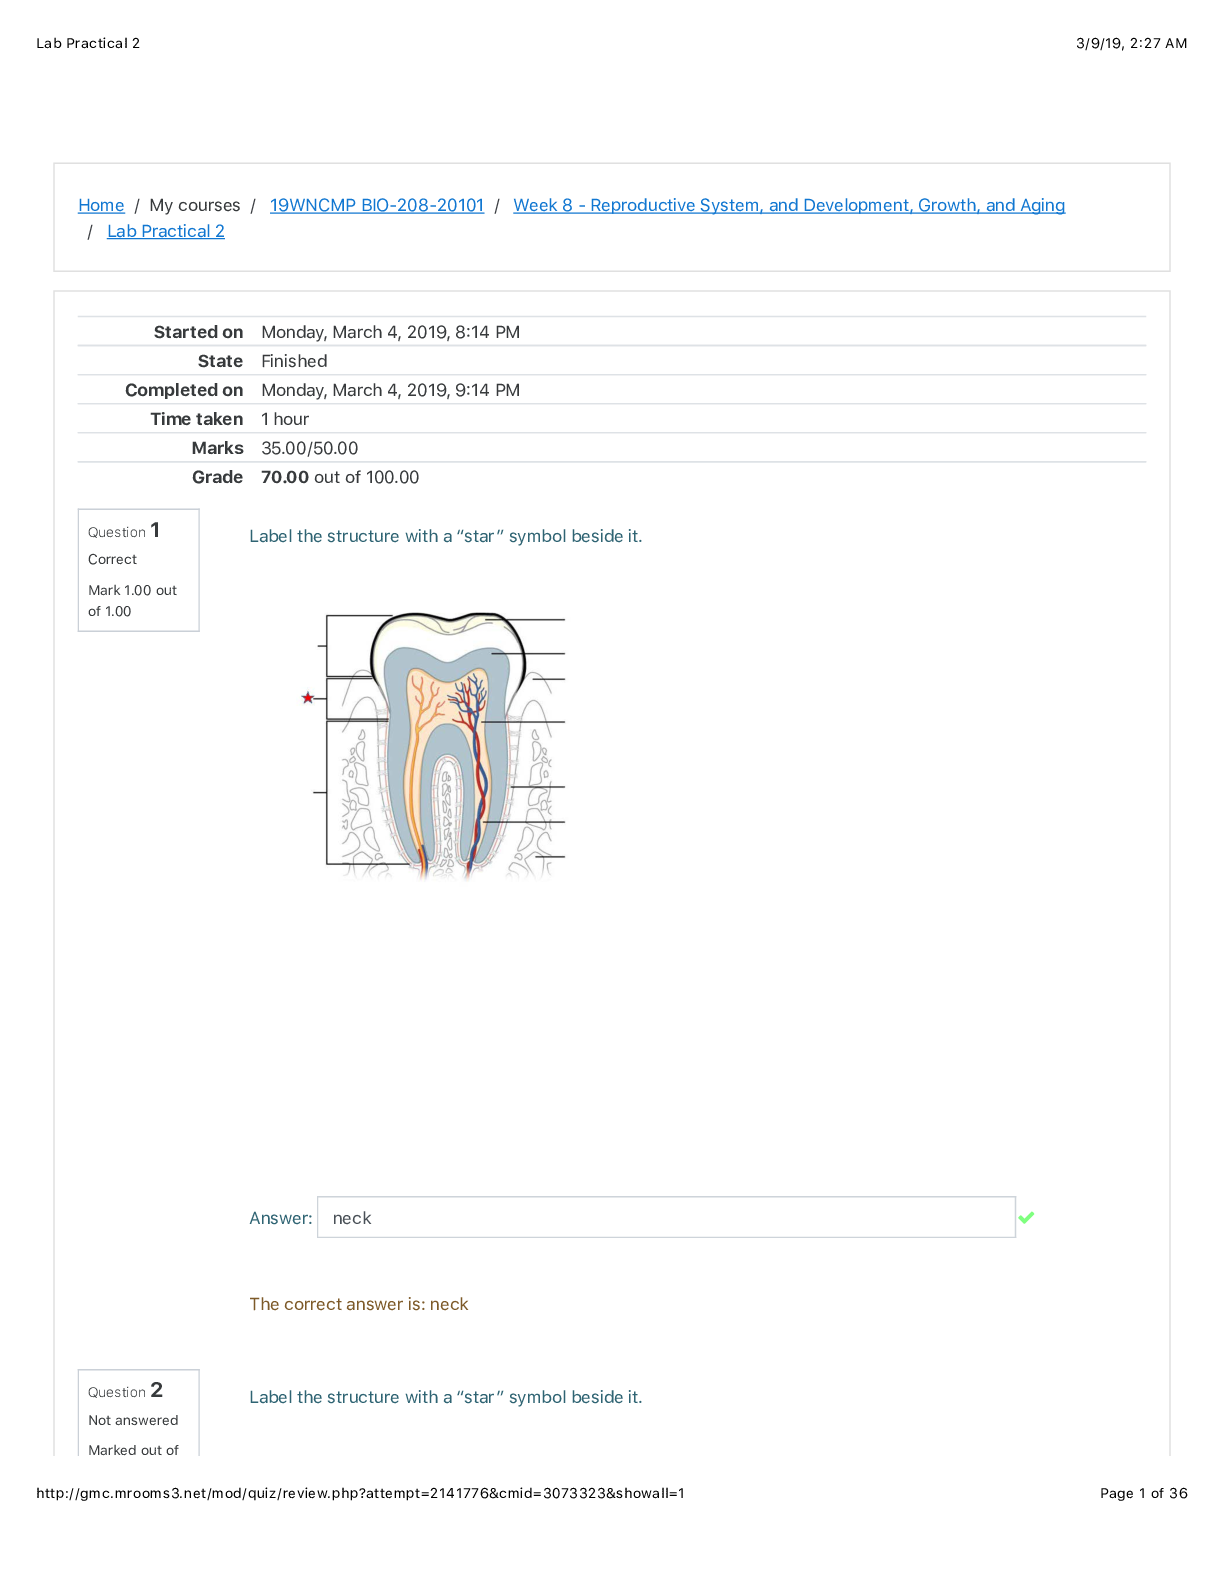
Lab 8 Earthquakes Name: Muhammad Mehdi Required materials Pencil Colored pencils Ruler Magnifier Compass Computer with Google Earth software loaded Pre-lab reading and quiz Read Chapter 8 of ... your textbook and review your lecture notes on earthquakes. Define the following terms: Earthquake: Sudden release of built up energy by the earth, creates displacements in rock materials. Focus: Point underground where the rock breaks and generates the seismic waves. Epicenter: Point on the Earth’s surface directly above the focus. Where do most earthquakes occur? Along the edge of the oceanic and continental plates. In what order do the different types of seismic waves arrive at a recording station? First P Wave, First S Wave, and First Surface Wave What is the difference between magnitude and intensity? Magnitude measures the energy released at the source. Intensity measures the strength of shaking.In-class lab exercises Part 1: Epicenter and Magnitude Use the following diagram to calculate the magnitude of the earthquake.On the seismogram, measure the amplitude of the largest S-wave displacement. Don’t forget the units for your answer. Roughly 130mmIn the key, what is the distance of this recording station from the epicenter of the earthquake? 6000km Plot your answers to the previous 2 questions on the bottom part of the diagram. Using your ruler, draw a straight line between the 2 points. What is the magnitude of this earthquake? 7 The epicenter of an earthquake can be estimated by assuming that the P-waves travel at a constant velocity of about 6 km/sec. If we subtract the time of occurrence from the time that the P-wave arrived at a station, we determine the time it took for the wave to get from the earthquake to the station. If we multiply this time by the velocity of travel, we know the distance to the source. Using data from several stations we can use a map and a compass to locate the earthquake approximately. Once the distance from the station to the earthquake has been determined, as described above, draw a circle of that radius about the station. Do the same for each station. The circles will intersect, or come close to intersecting, at the epicenter. Example: time of occurrence = 1:01:05 AM Station P-wave arrival Distance traveled 1 1:01:10 5 sec X 6 km/sec = 30 km. 2 1:01:13 8 sec X 6 km/sec = 48 km. 3 1:01:17 12 sec X 6 km/sec = 72 km. [Show More]
Last updated: 1 year ago
Preview 1 out of 11 pages
Reviews( 0 )
Document information
Connected school, study & course
About the document
Uploaded On
Apr 06, 2021
Number of pages
11
Written in

Additional information
This document has been written for:
Uploaded
Apr 06, 2021
Downloads
0
Views
43
.png)


.png)
.png)


 (1).png)