Physics > Lab Report > PHY 2048L Experiment 4 Lab Report: Force Table, Florida Atlantic University (All)
PHY 2048L Experiment 4 Lab Report: Force Table, Florida Atlantic University
Document Content and Description Below
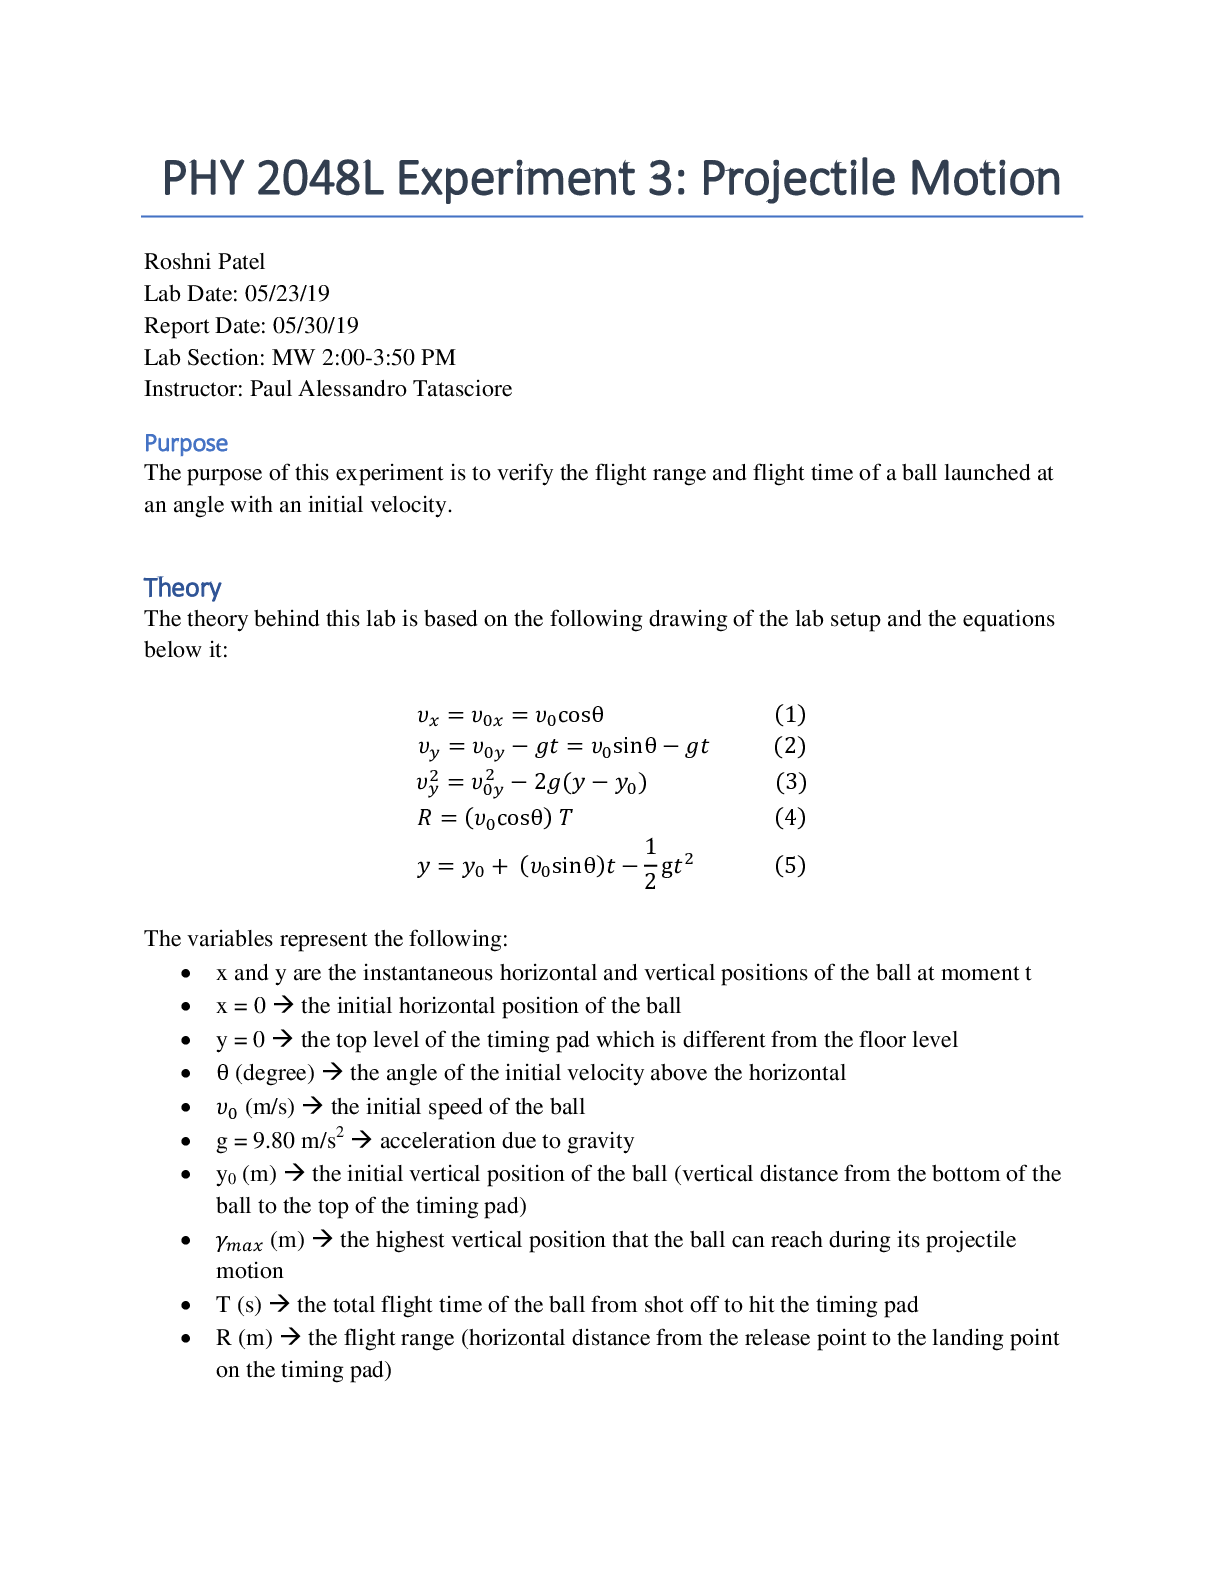
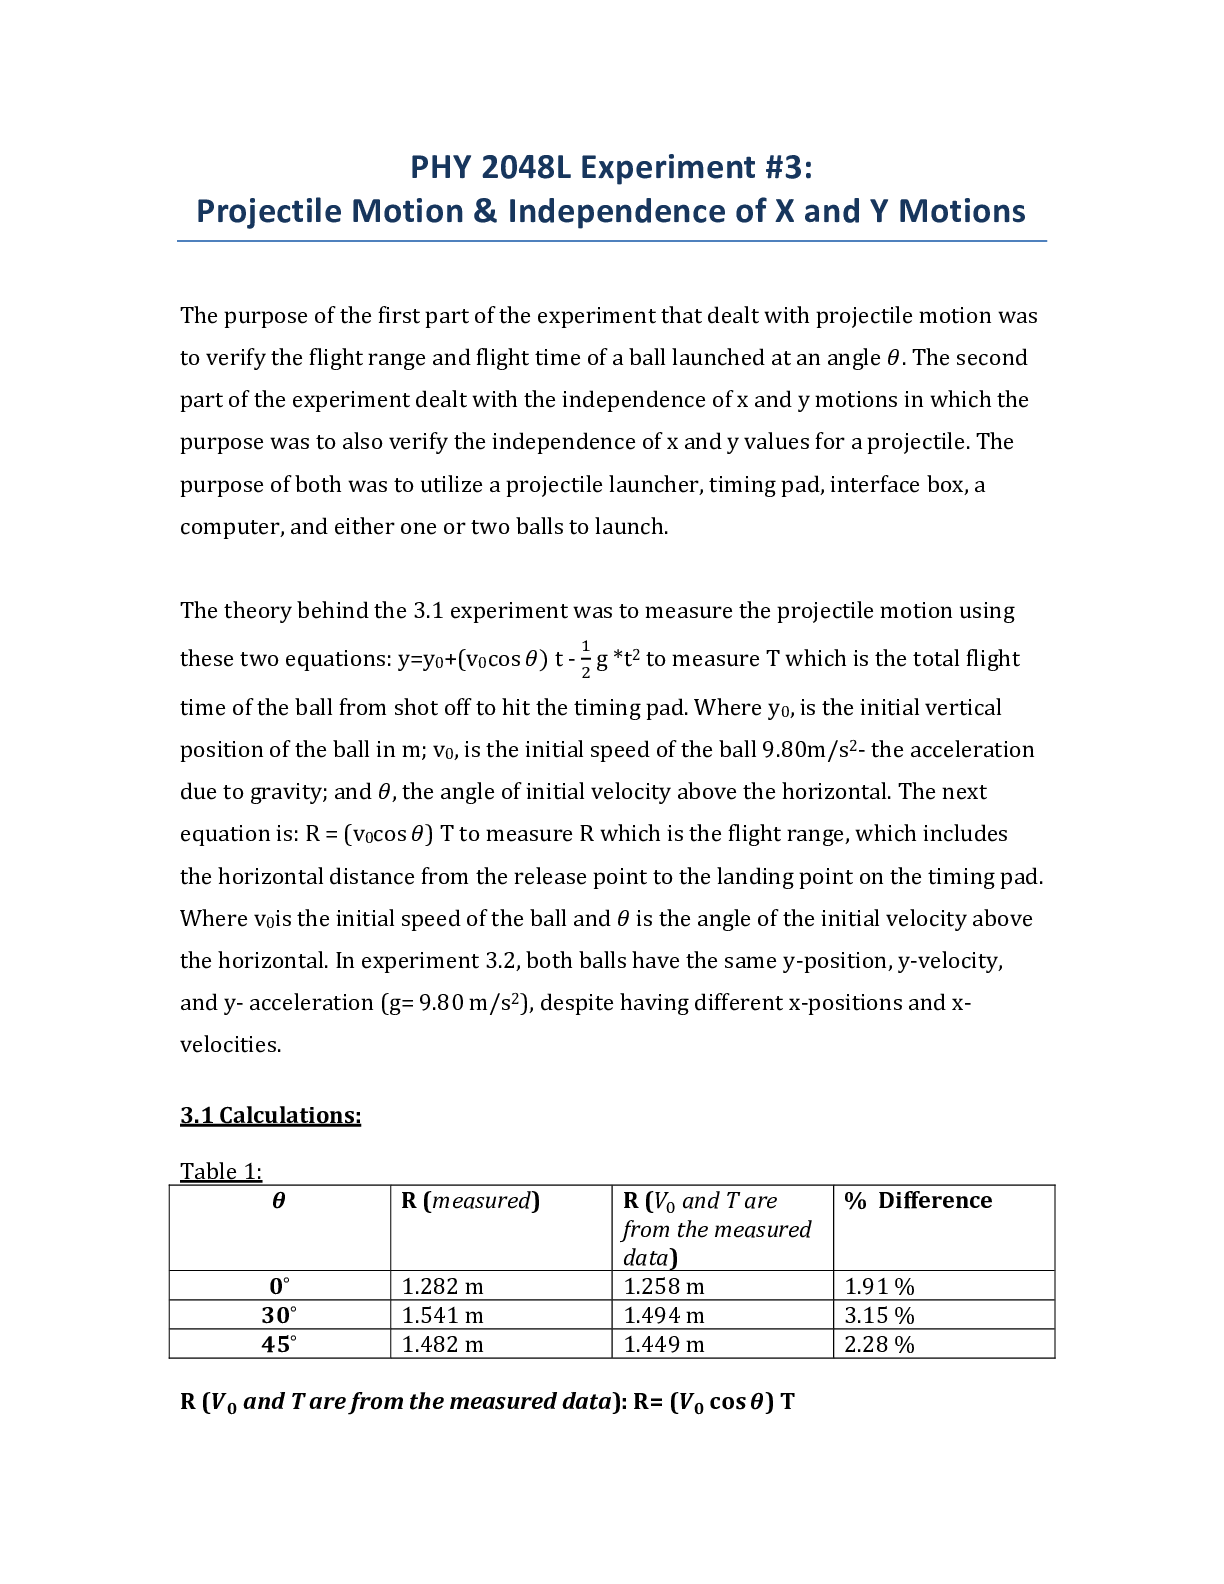
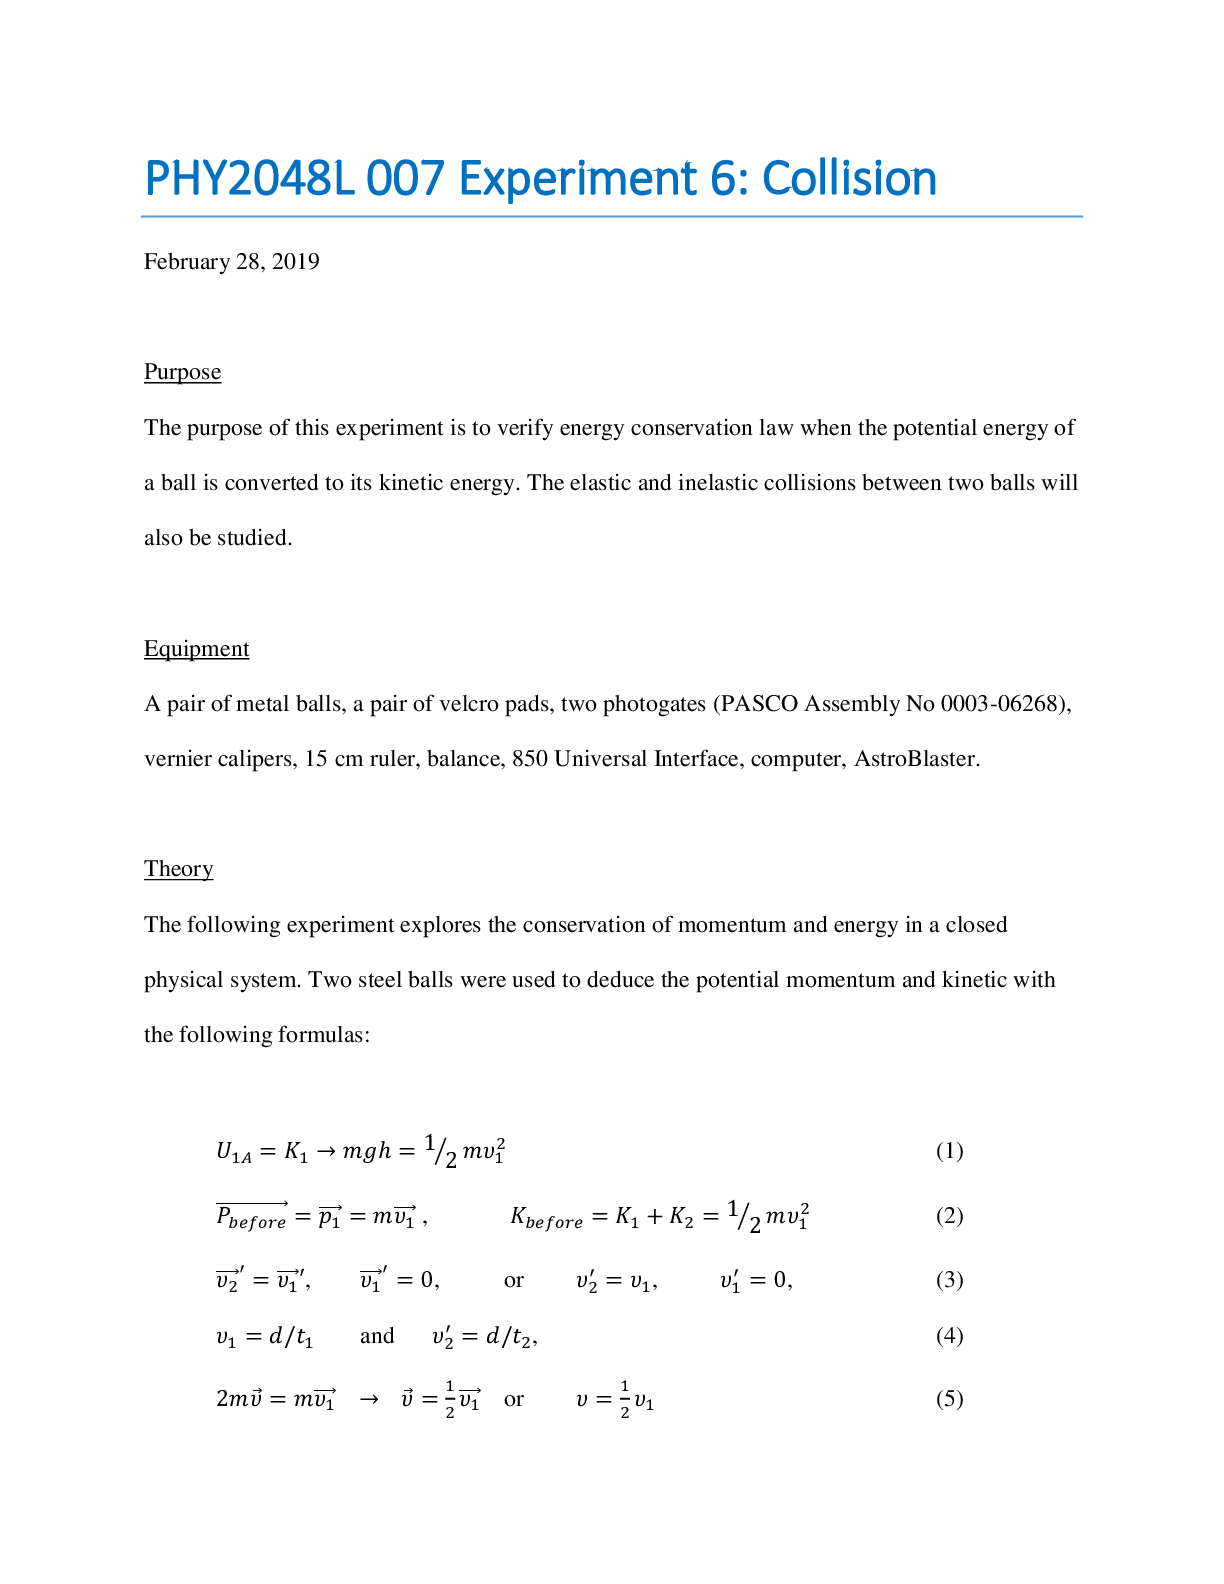
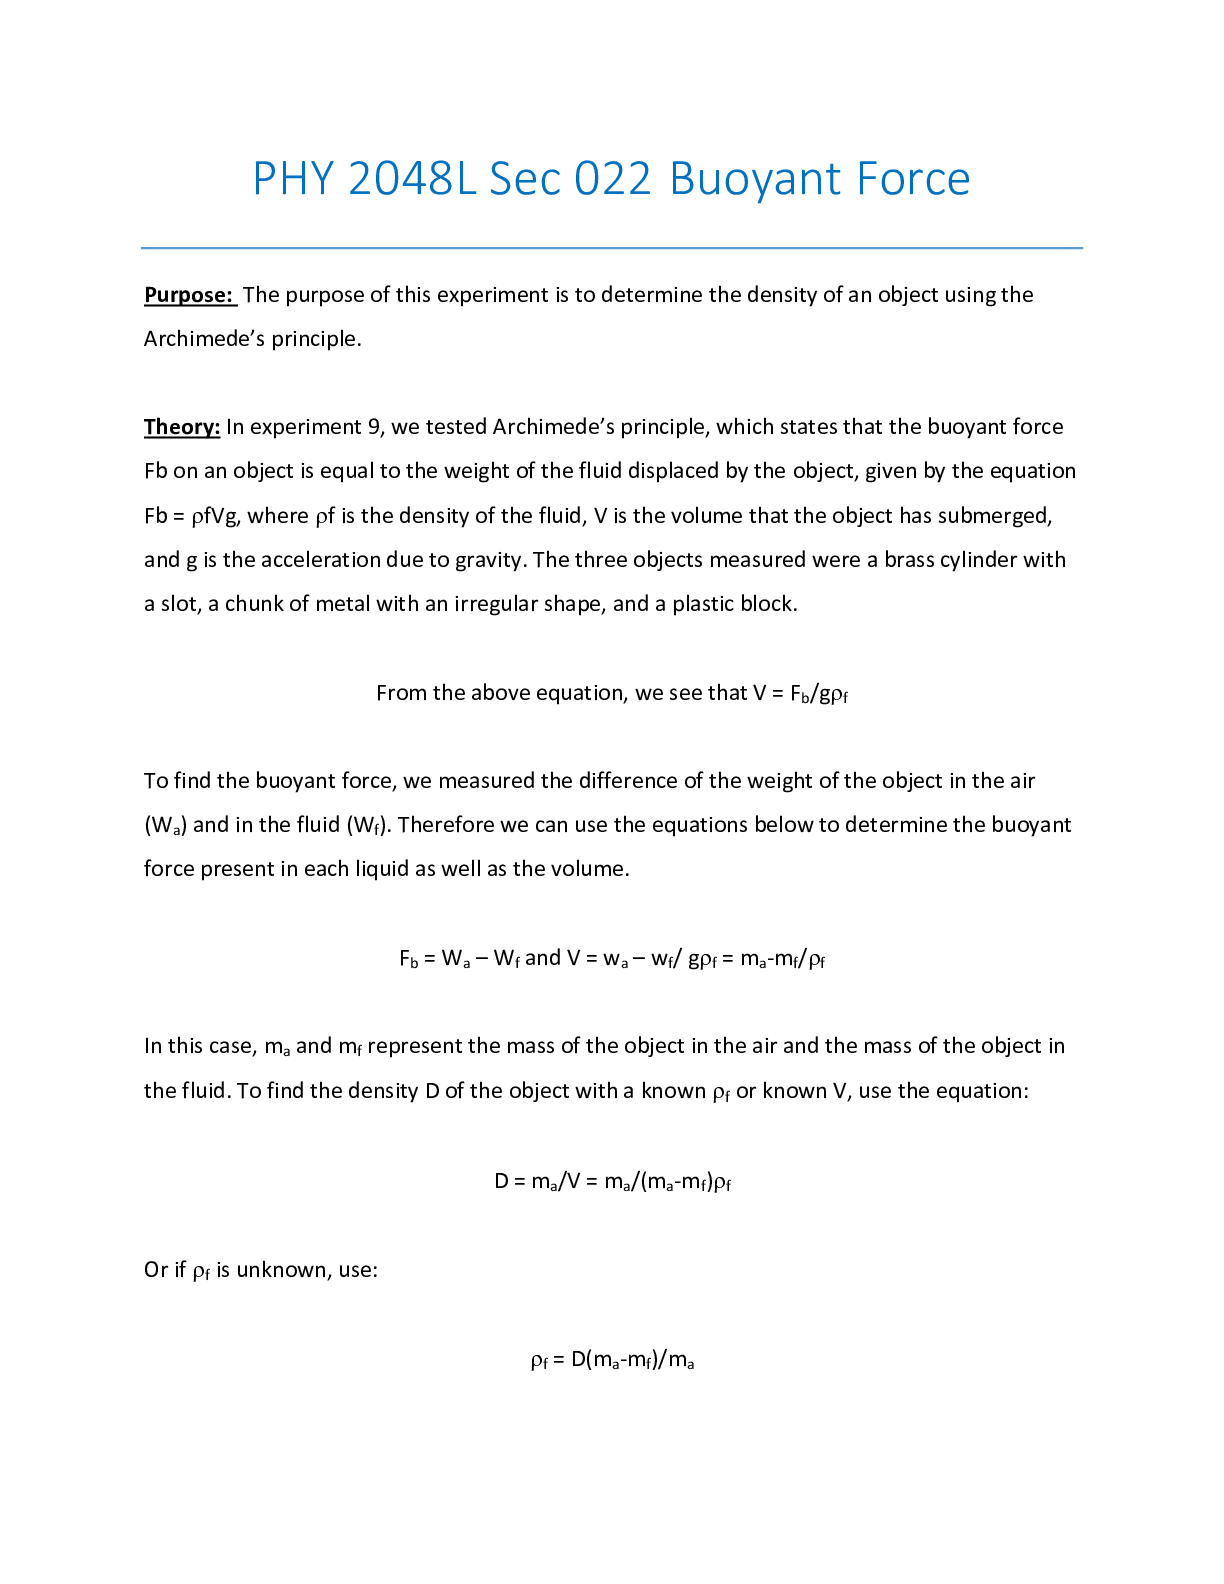
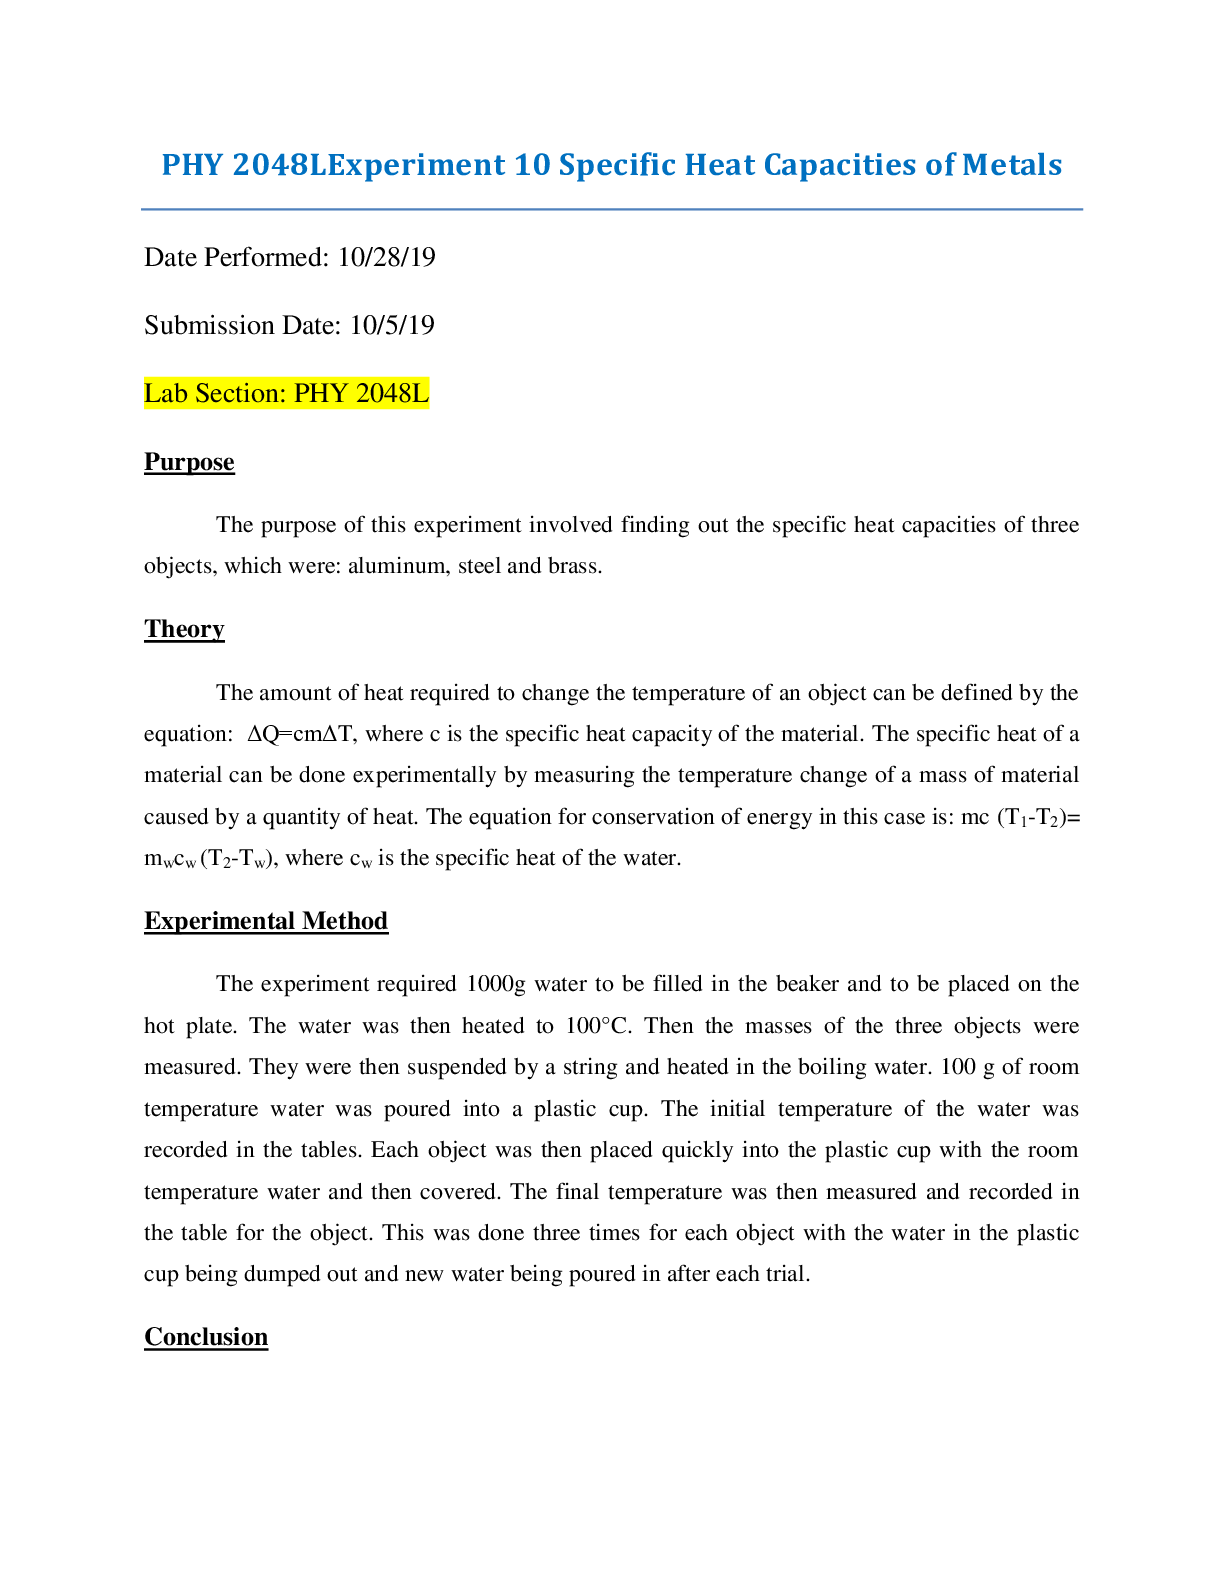
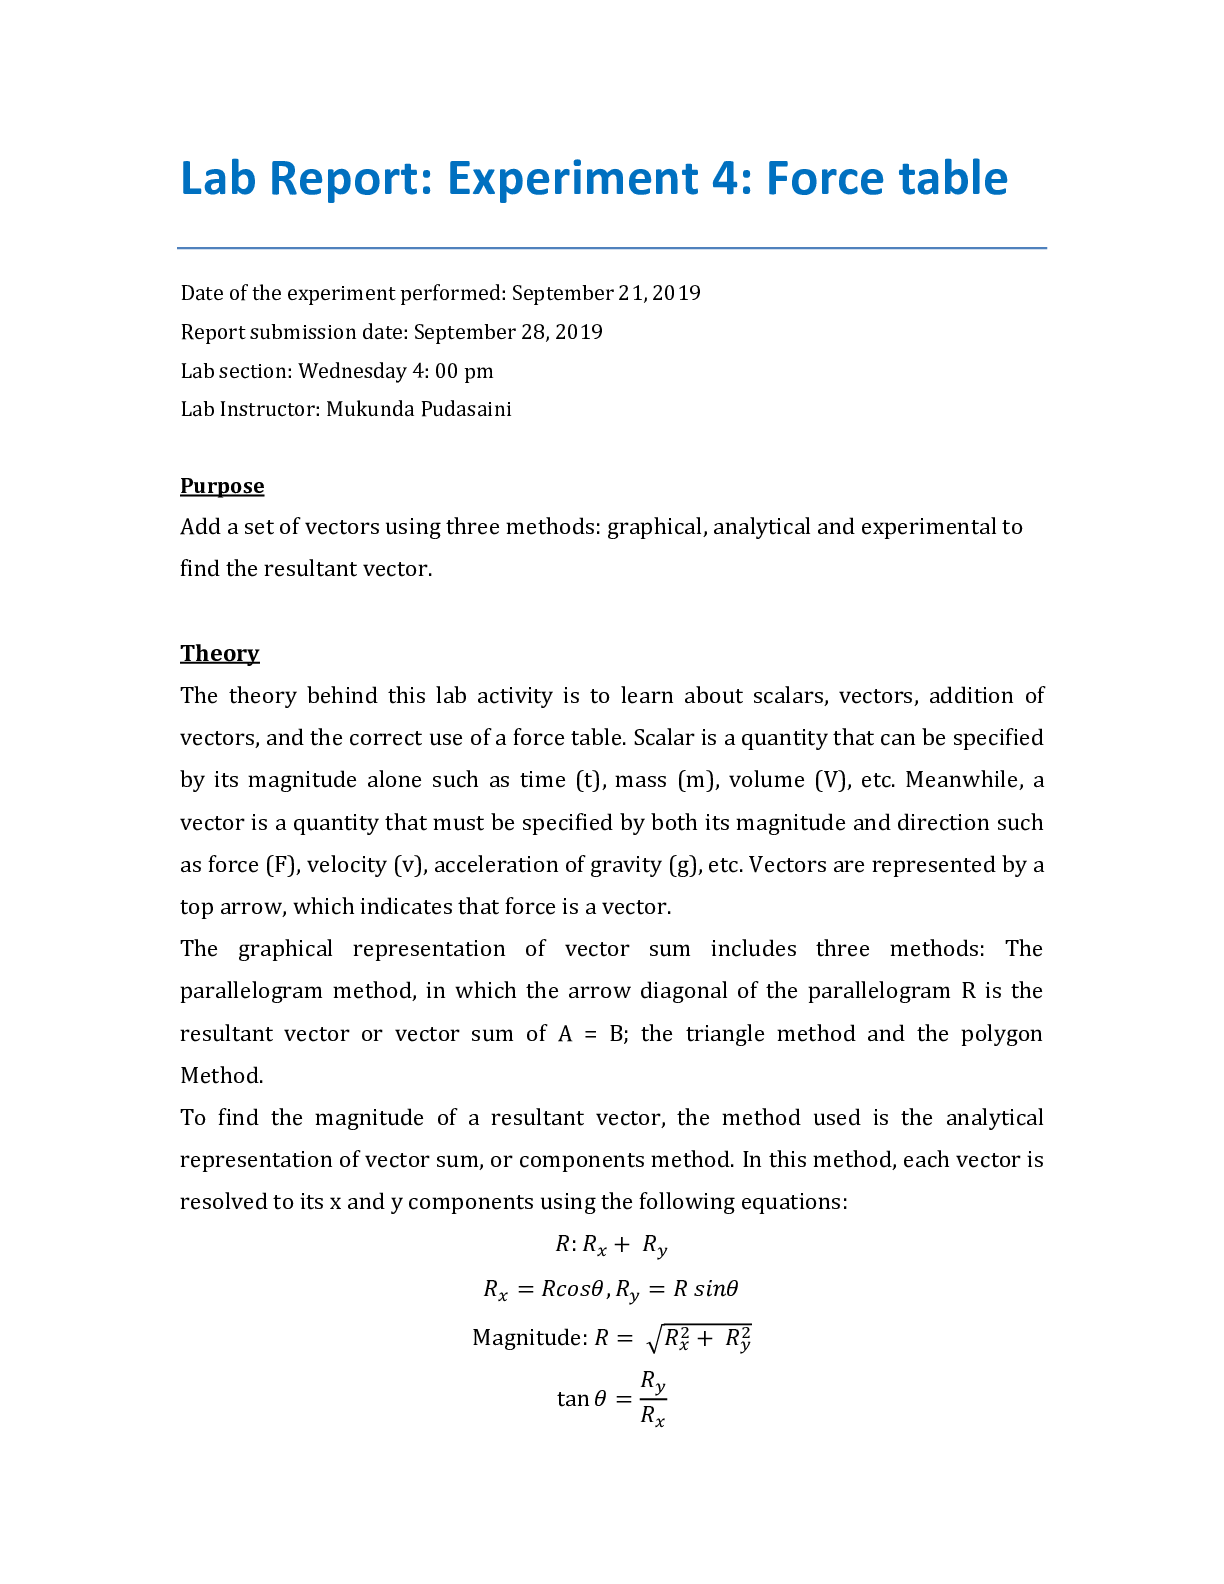
PHY2048L 007: Experiment 4: Force Table February 14, 2020 Purpose The purpose of this experiment is to add a set of vectors using three different methods (graphical, analytical, and experimental)... to find the resultant vector. Equipment Force table with pulleys, weight hangers, a set of slotted weights (masses), string, protractor, compass, rulers (15 cm and 30 cm), bubble level, graph papers. Theory 1. Scalar quantity and vector quantity (a) Scalar: a quantity can be specified by magnitude alone such as time (t), mass (m), volume (V), etc. (b) Vector: a quantity must be specified by both magnitude and direction such as force (F ⃗), velocity (υ ⃗), acceleration (a ⃗), etc. 2. Representation of a vector 3. Graphical representation of vector sum (vector addition and subtraction) Procedure 1. Place the bubble level on the force table to check whether it is leveled. Adjust if necessary. 2. Clamp pulleys on the force table at specified angles and add specified weight to each hanger as listed in each of the three measurements. - Measurement #1: F ⃗1: 200 g at 30.0°; F ⃗2: 200 g at 120.0°. - Measurement #2: F ⃗1: 150 g at 30.0°; F ⃗2: 150 g at 150.0°; F ⃗3: 150 g at 180.0°. - Measurement #3: F ⃗1: 250 g at 30.0°; F ⃗2: 200 g at 120.0°; F ⃗3: 150 g at 180.0°. 3. Find the magnitude and direction of the equilibrant (E ⃗) that maintains the central ring centered in equilibrium around the center pin. 4. Check your results using the following methods and record the magnitudes and directions of the resultant forces (R ⃗) in the three data tables. Remember R ⃗=-E ⃗. 5. Graphical method: Using the polygon method of vector sum, draw a vector diagram to scale on graph paper, e.g., use 1 cm to represent 0.49 N (produced by a hanging mass of 50 g), i.e., the scaling factor is 0.49 N/cm. 6. Analytical method: Using the law of cosines, compute the magnitude of the resultant force. Compute the angle of orientation from tanθ=R_y/R_x. 7. Record the data from Measurements #1, #2, and #3 in Tables 1, 2, and 3 respectively. [Show More]
Last updated: 1 month ago
Preview 1 out of 4 pages

Reviews( 0 )
Document information
Connected school, study & course
About the document
Uploaded On
Oct 01, 2020
Number of pages
4
Written in

Additional information
This document has been written for:
Uploaded
Oct 01, 2020
Downloads
1
Views
151
 (1).png)


.png)